


Crypto Today: Bitcoin, Ethereum, XRP hold steady ahead of US CPI
- Bitcoin ticks up amid consolidation in a narrow range, capped by $84,000 supply ahead of the US CPI inflation report.
- Ethereum bulls are positioning for a potential rebound toward $2,600, with the 50-day EMA supporting upward momentum.
- XRP is navigating a tight trading range, with the 100-day EMA acting as a support base while the 50- and 200-day EMAs cap gains.
Bitcoin (BTC) is staging a subtle recovery on Wednesday, holding above $84,000. The Crypto King remains broadly in bullish hands despite failure to break the supply cluster in the $87,000-$88,000 range. On the downside, BTC is supported by a solid psychological level at $84,000, along with major moving averages.
Ethereum (ETH) reflects Bitcoin's resilience, trading above $2,500. The smart contract token marks the second straight day of gains, as bulls build momentum for the next recovery phase above $2,600.
Ripple (XRP), meanwhile, is facing an uphill battle toward the critical $1.40 supply level after testing support near $1.30 on Monday. Its upside remains capped by structural hurdles.
Focus stays on US CPI
August’s Consumer Price Index (CPI) data from the US Bureau of Labor Statistics is set for release on Wednesday. The Federal Reserve will closely consider this report, along with other core economic indicators, as it formulates its policy stance at the October Federal Open Market Committee (FOMC) meeting.
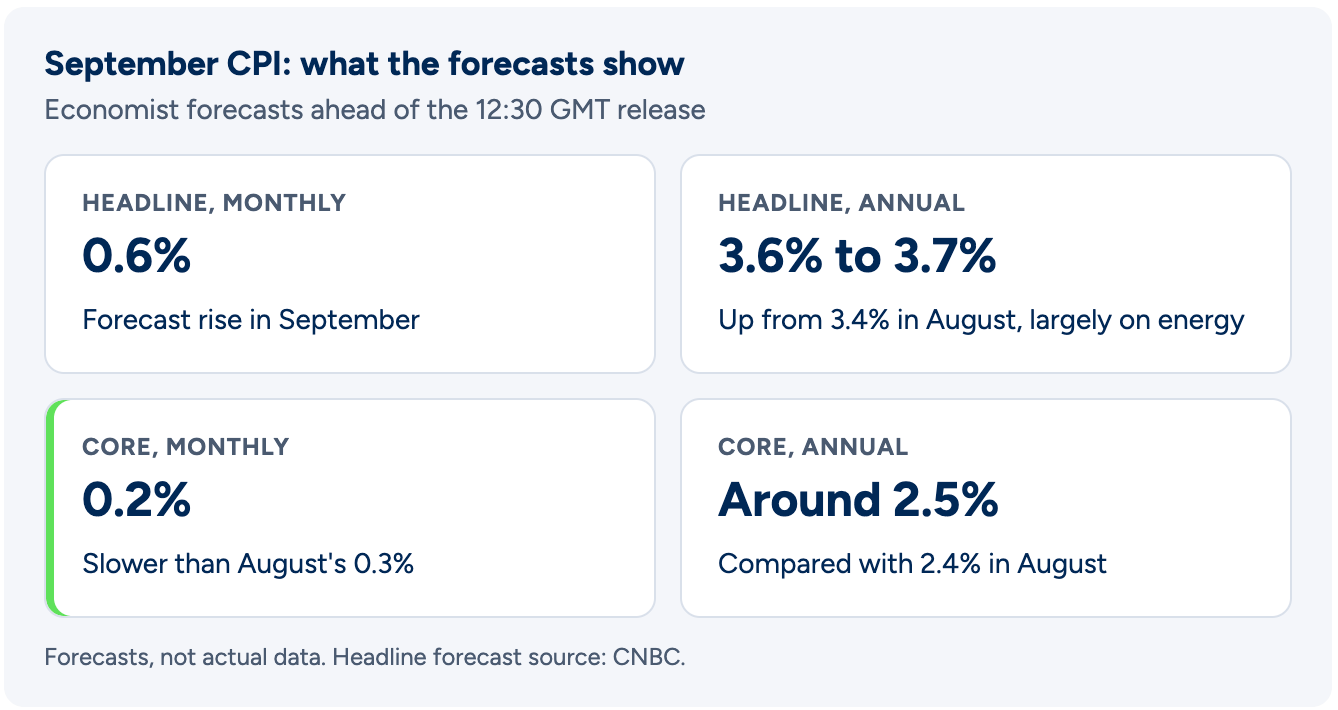
The Fed raised interest rates in September by 25 basis points to the 3.75-4.00% range. Economists broadly expect headline inflation to rise 0.6% in September, bringing the annual rate to between 3.6% and 3.7%, up from 3.4% in August.
Core CPI, which excludes the volatile prices of food and energy, is forecast to rise 0.2% monthly, slower than August’s 0.3% print. The annual rate is expected to rise 2.5% in September compared to 2.4% in August.
“Investors are therefore likely to spend less time interpreting the inflation number itself and more time reassessing what it means for interest rates, Treasury yields and financing conditions,” Maksym Sakharov, Co-founder and Group CEO of WeFi.co, said in an emailed commentary, adding, “higher real yields increase the return available from lower-risk fixed-income assets, raising the opportunity cost of holding assets such as Bitcoin that do not generate income.”
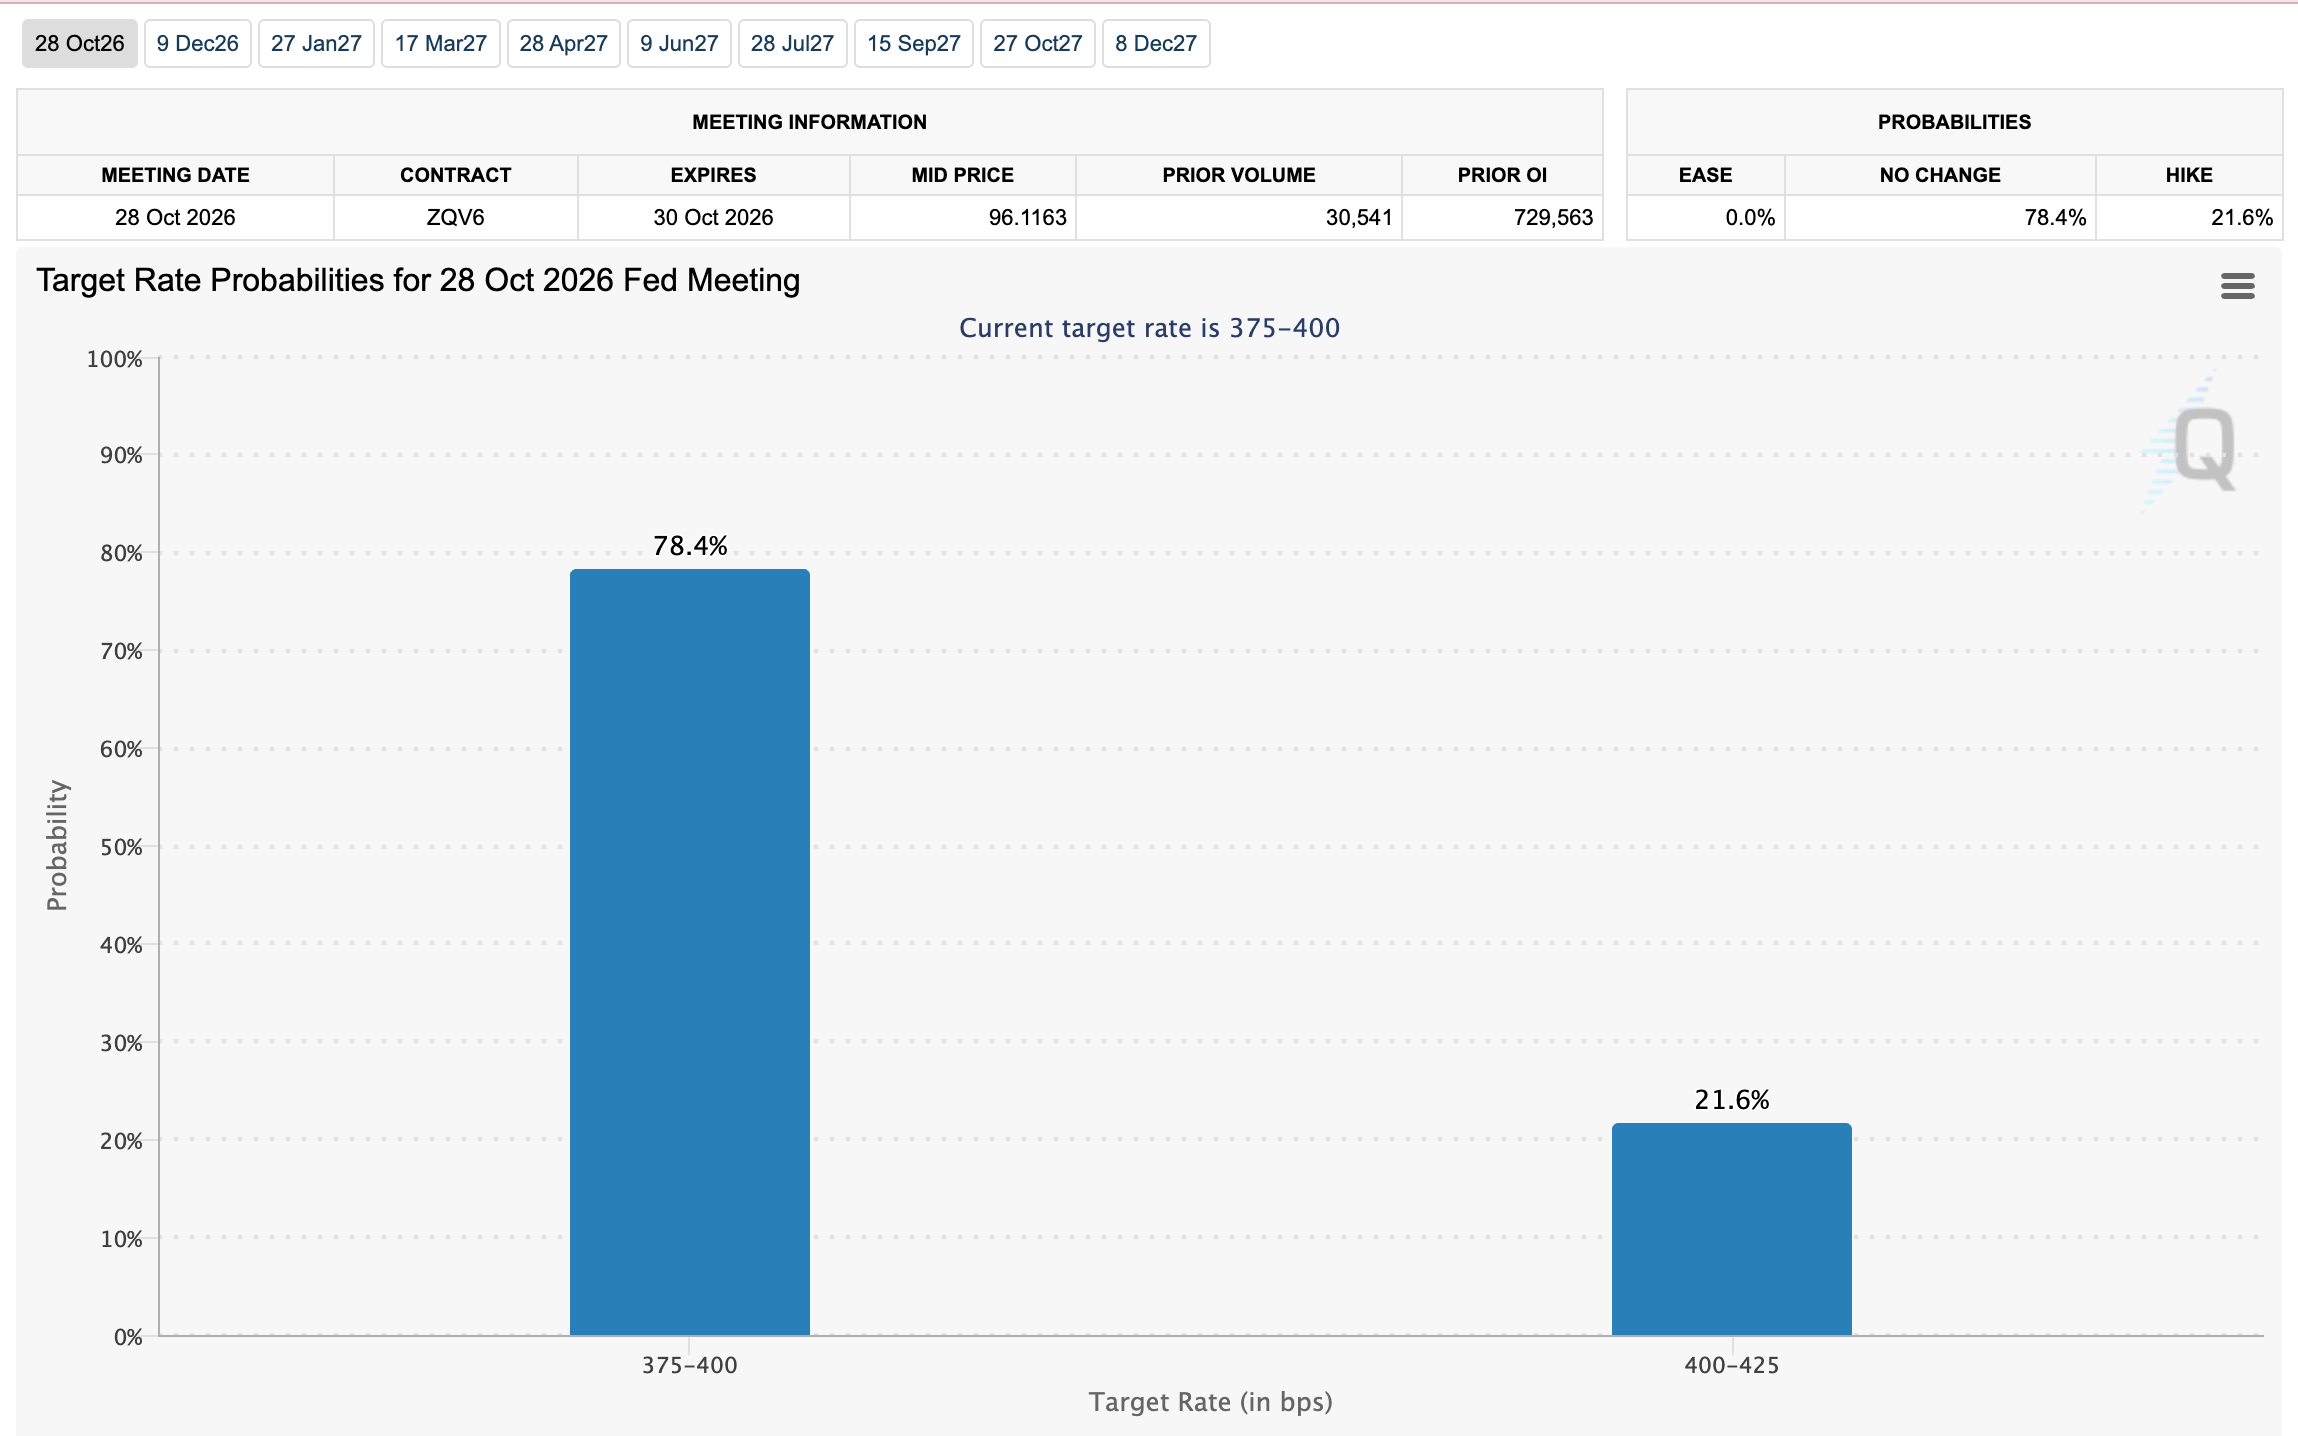
Market participants are currently pricing in 78% odds that the Fed will hold interest rates, with only 22% betting on a rate hike. Softer-than-expected CPI inflation data would back the broader market expectations. However, markets appear to be anticipating at least one more rate hike before year-end.
“A softer inflation reading could support the opposite view by reinforcing expectations that financing conditions may gradually become more accommodative. The market’s response will depend less on the headline CPI figure than on how it reshapes expectations for the cost of capital,” Sakharov added.
Technical analysis: Bitcoin poised for fresh recovery
Bitcoin sits above $83,000, holding a constructive bullish bias as it extends above the 50-day, 100-day and 200-day Exponential Moving Averages (EMAs). The alignment of shorter EMAs above longer ones suggests an ongoing uptrend, although the Parabolic SAR at $86,028 now caps the topside as immediate resistance.
Momentum looks mixed, with the Relative Strength Index (RSI) hovering near a neutral 53 while the Moving Average Convergence Divergence (MACD) remains below zero with a negative reading and pressured histogram, hinting that upside may be slowing rather than reversing.
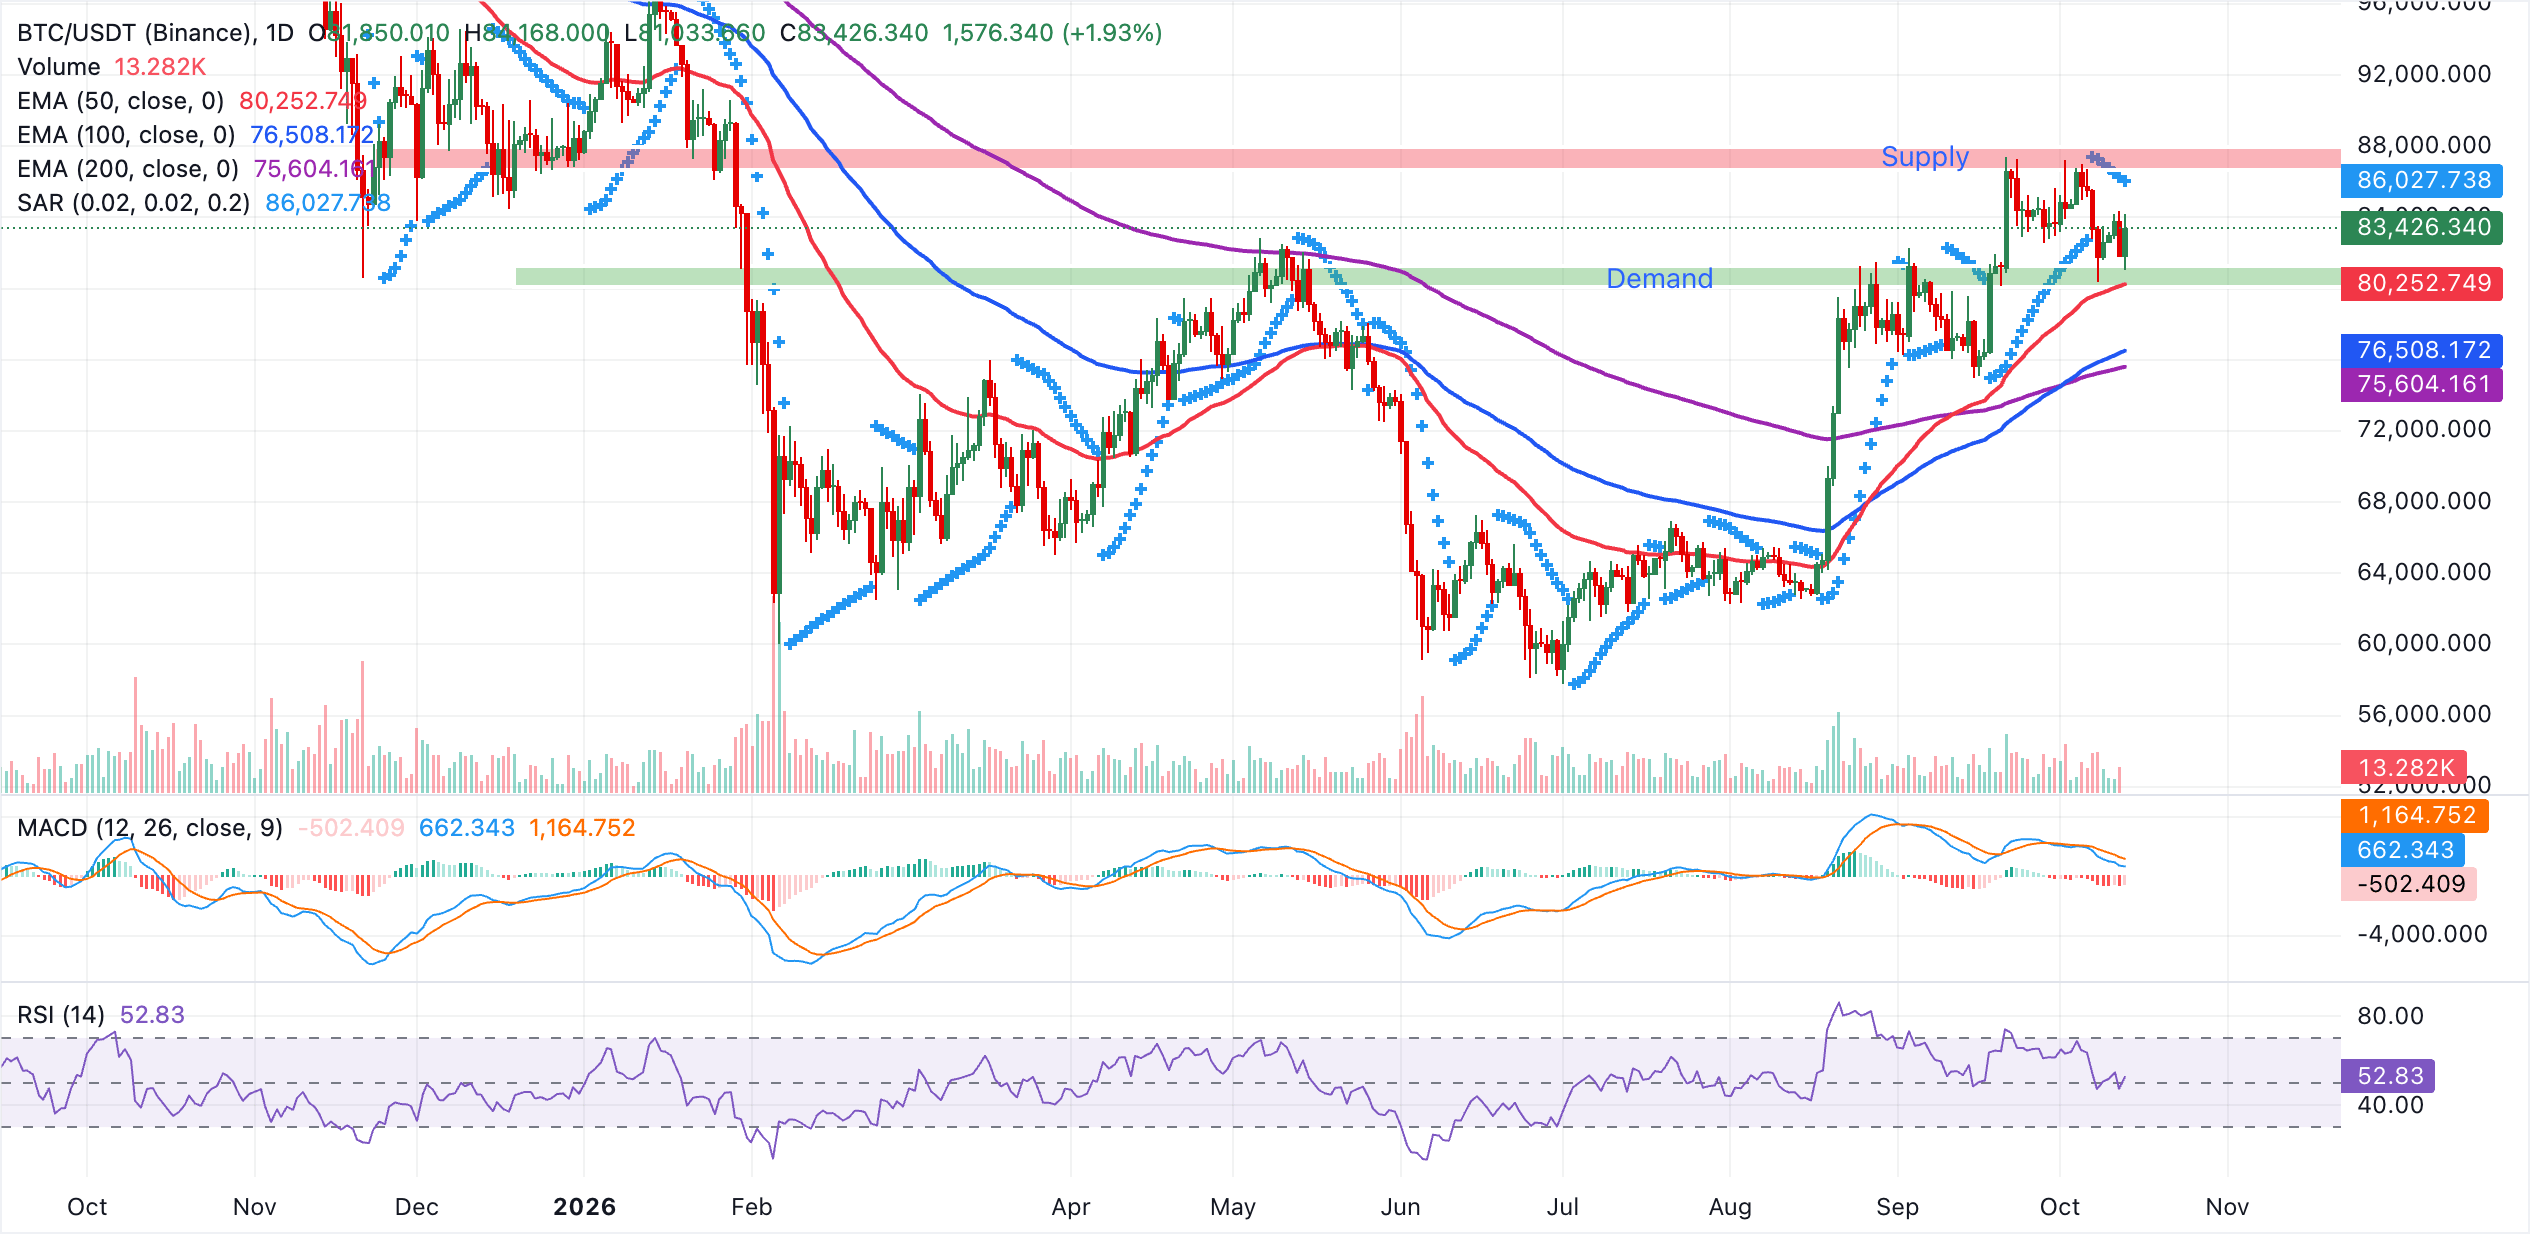
Initial support lies at the 50-day EMA near $80,253, followed by the 100-day EMA at $76,508 and the 200-day EMA at $75,604, forming a layered demand zone that should cushion deeper pullbacks within the broader bullish structure. On the topside, the Parabolic SAR at $86,028 acts as the next resistance to clear. A decisive daily close above this level would likely reopen the path toward fresh highs, while failure to reclaim it could see BTC consolidating above the EMA stack as momentum digests prior gains.
Altcoins technical analysis: Ethereum and XRP signal recovery as support holds
Ethereum steadies above $2,500, as the 50-day, 100-day and 200-day EMAs at $2,502, $2,356 and $2,300, respectively, provide support. While the constructive near-term bias increases buyer confidence, the MACD indicator has slipped into negative territory with a contracting negative histogram, hinting at waning bullish momentum and scope for further consolidation rather than an immediate breakout. The RSI at 45 aligns with this neutral-to-bullish outlook.
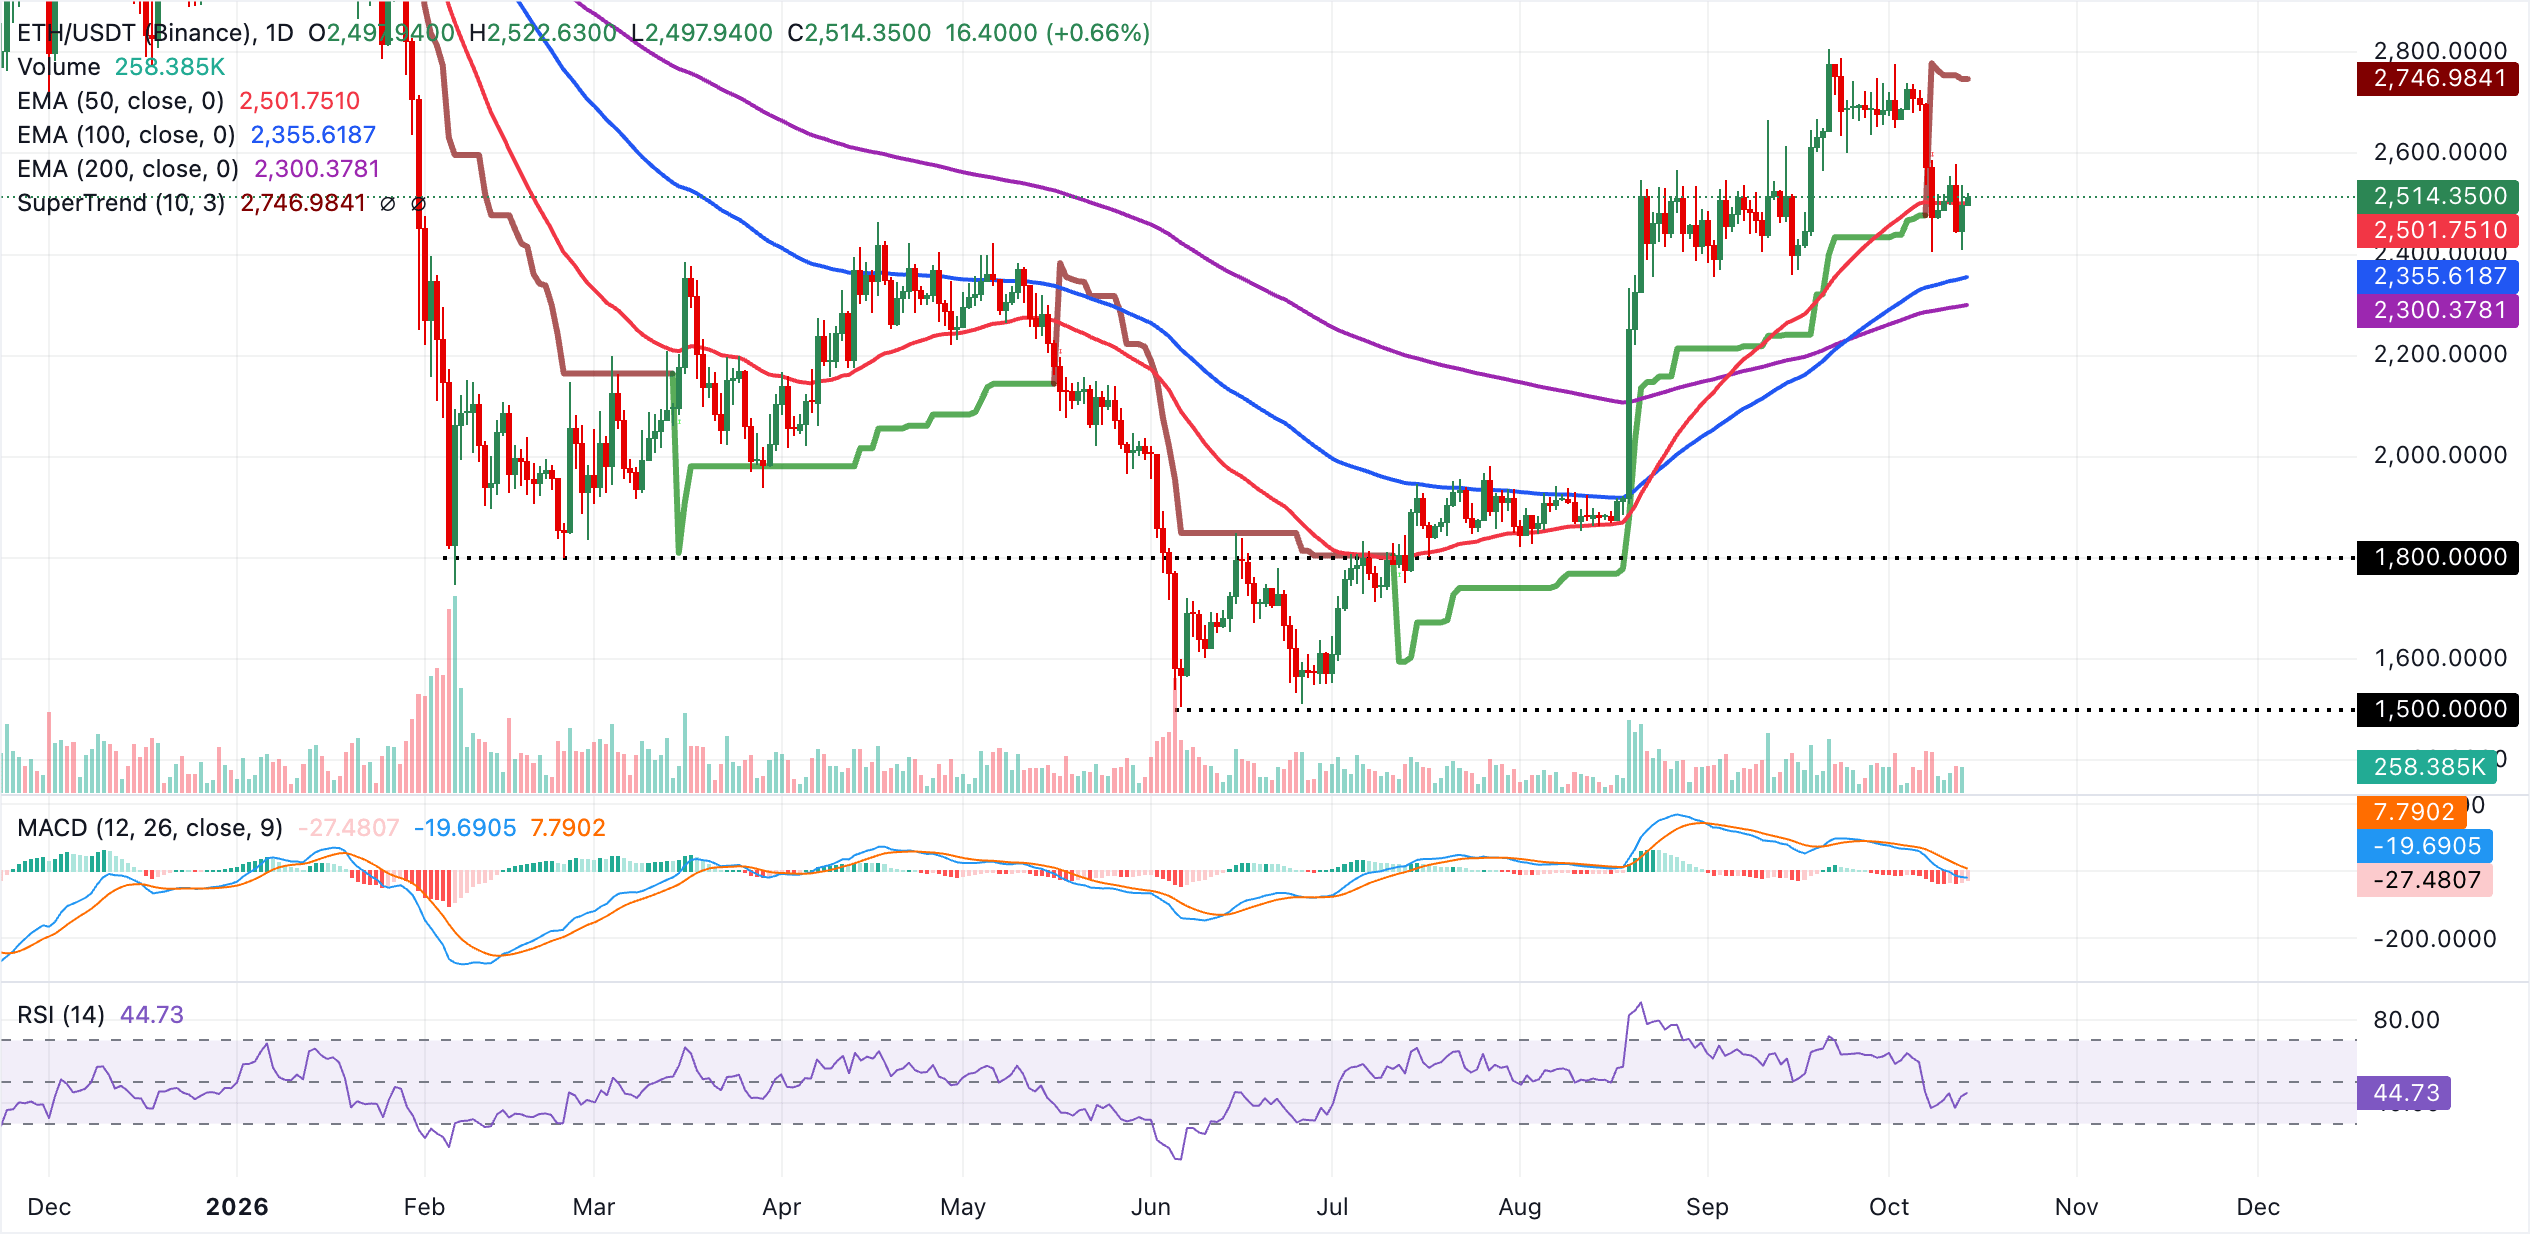
Initial resistance sits at the SuperTrend line near $2,747, capping recent recovery attempts. On the downside, immediate support lies at the 50-day EMA at $2,502, followed by the 100-day EMA near $2,356 and the 200-day EMA at $2,300, where a deeper pullback would be expected to attract fresh buying interest.
XRP, meanwhile, marks the second day of gains, trading at $1.37. Despite the token's stability amid heightened volatility, it maintains a mildly bearish near-term bias as it consolidates just under the 200-day EMA at $1.38 and well below the 50-day EMA near $1.40.
The pair remains supported above the 100-day EMA at $1.34 and the SuperTrend baseline at $1.30, suggesting the broader move is still intact but capped by layered overhead resistance. Momentum is mixed, with the RSI hovering near 43 and MACD slightly negative, hinting that upside attempts could remain fragile while price holds beneath the key short- and long-term EMAs.
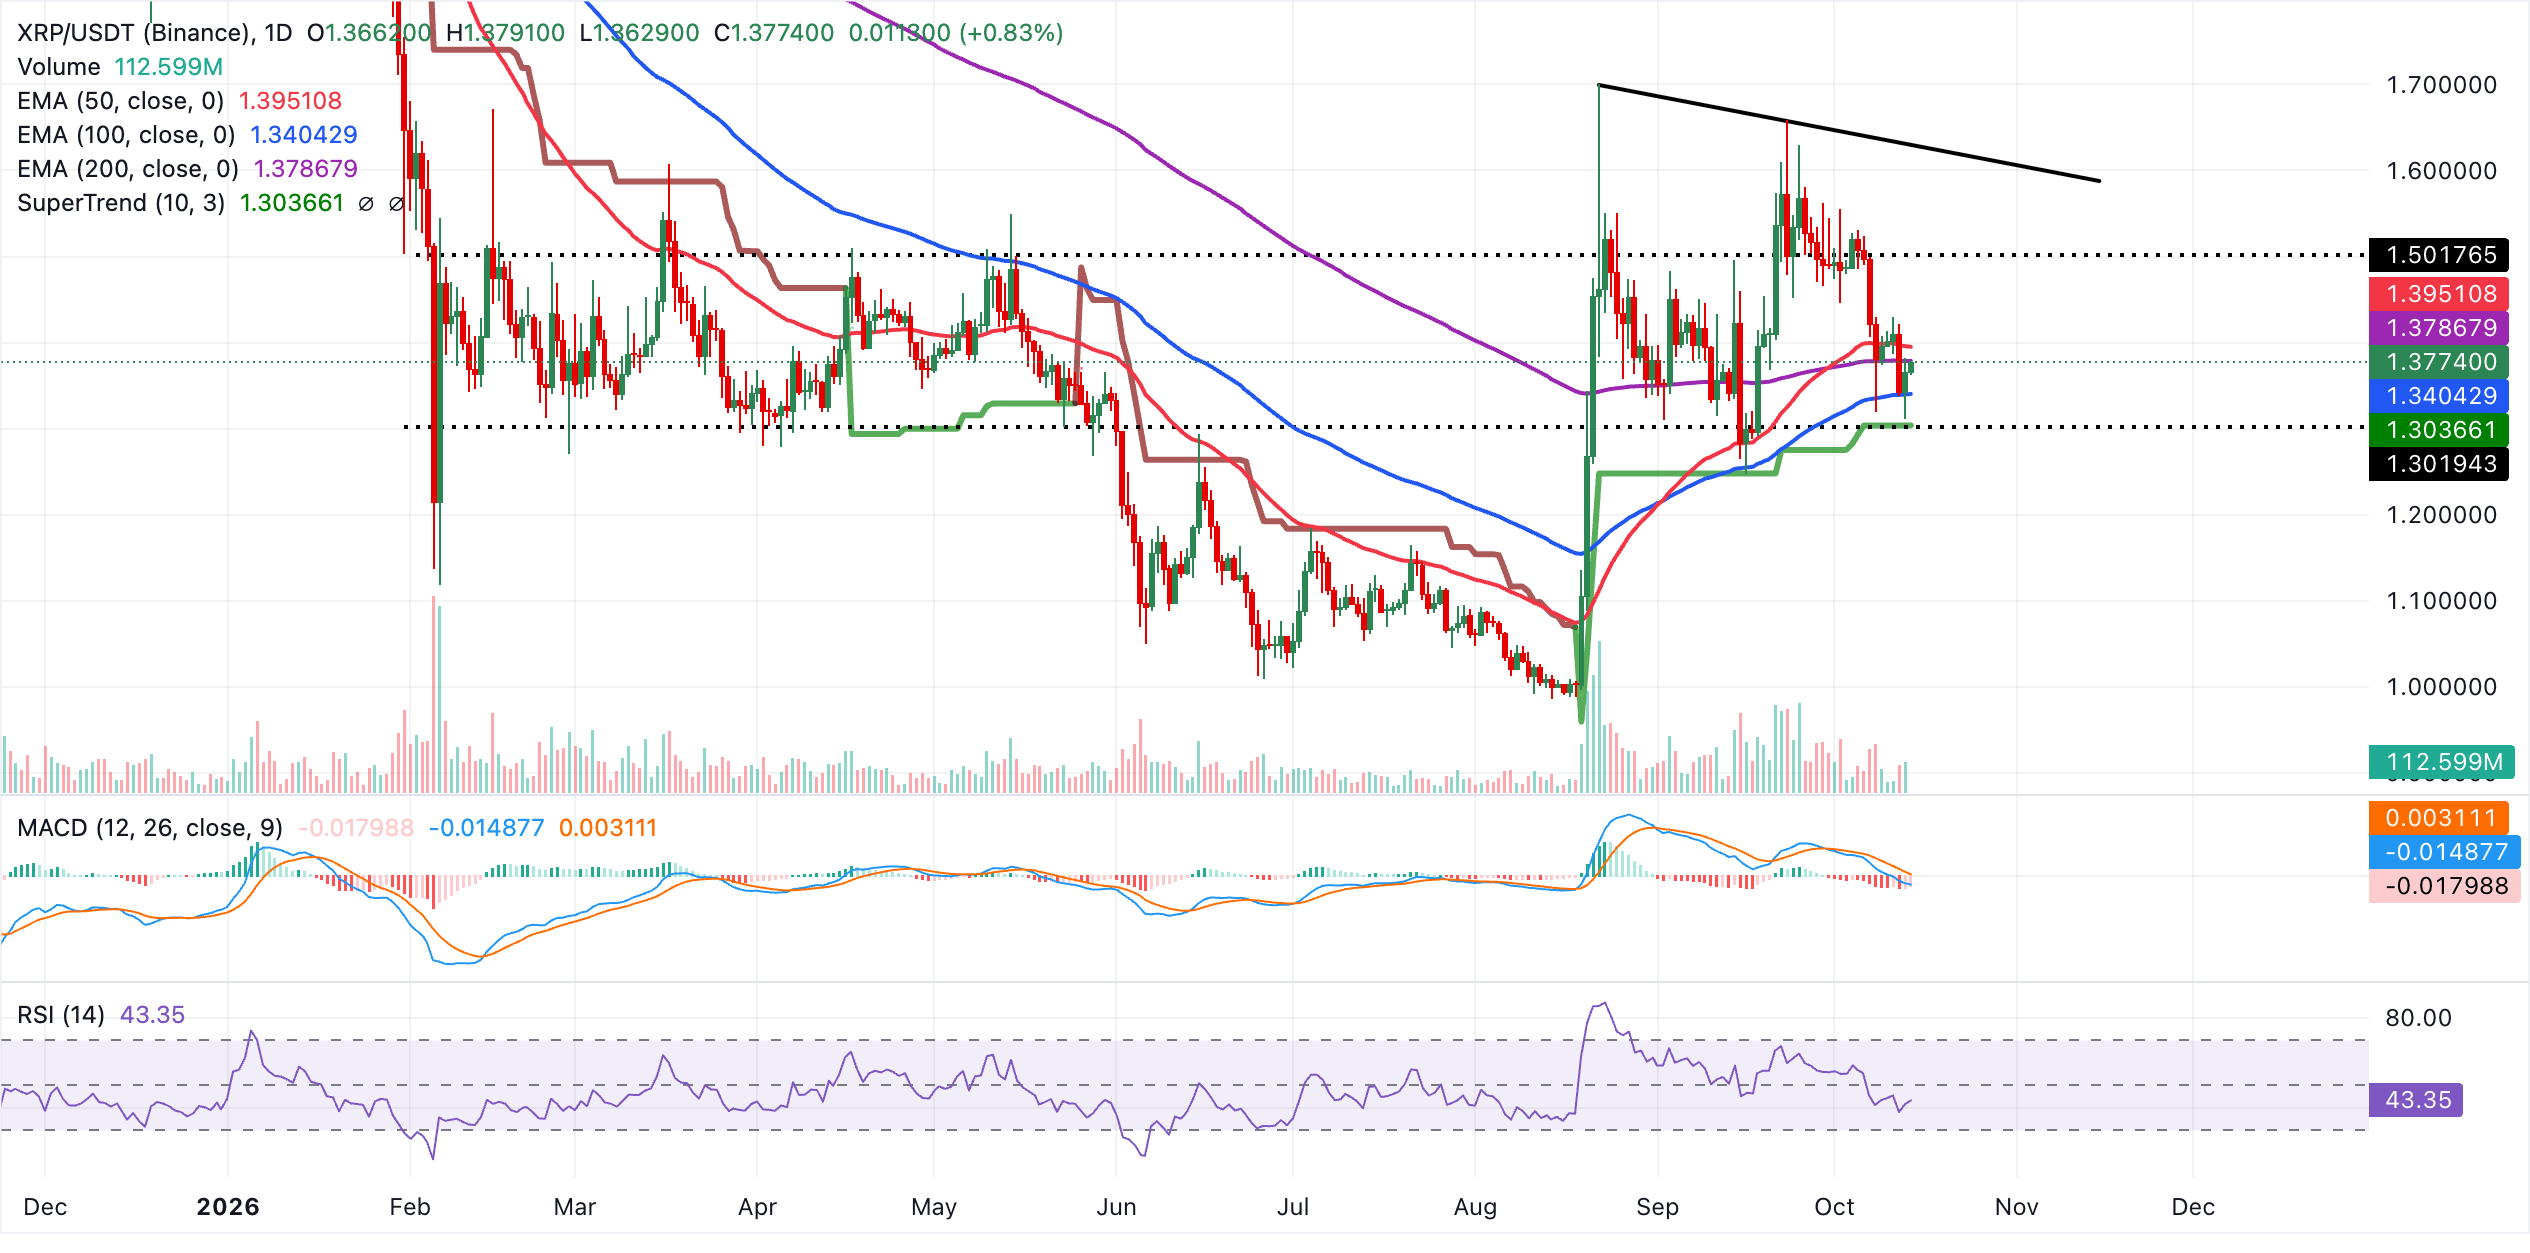
Immediate resistance sits at the 200-day EMA around $1.38, followed by a more decisive barrier at the 50-day EMA near $1.40. A daily close above these levels would open the way toward the descending trendline resistance projected around $1.63. On the downside, initial support is at the 100-day EMA at $1.34, ahead of a stronger floor defined by the SuperTrend line near $1.30, where buyers would be expected to defend the medium-term structure if the current consolidation breaks lower.
(The technical analysis of this story was written with the help of an AI tool. Know more.)
Bitcoin, altcoins, stablecoins FAQs
Bitcoin is the largest cryptocurrency by market capitalization, a virtual currency designed to serve as money. This form of payment cannot be controlled by any one person, group, or entity, which eliminates the need for third-party participation during financial transactions.
Altcoins are any cryptocurrency apart from Bitcoin, but some also regard Ethereum as a non-altcoin because it is from these two cryptocurrencies that forking happens. If this is true, then Litecoin is the first altcoin, forked from the Bitcoin protocol and, therefore, an “improved” version of it.
Stablecoins are cryptocurrencies designed to have a stable price, with their value backed by a reserve of the asset it represents. To achieve this, the value of any one stablecoin is pegged to a commodity or financial instrument, such as the US Dollar (USD), with its supply regulated by an algorithm or demand. The main goal of stablecoins is to provide an on/off-ramp for investors willing to trade and invest in cryptocurrencies. Stablecoins also allow investors to store value since cryptocurrencies, in general, are subject to volatility.
Bitcoin dominance is the ratio of Bitcoin's market capitalization to the total market capitalization of all cryptocurrencies combined. It provides a clear picture of Bitcoin’s interest among investors. A high BTC dominance typically happens before and during a bull run, in which investors resort to investing in relatively stable and high market capitalization cryptocurrency like Bitcoin. A drop in BTC dominance usually means that investors are moving their capital and/or profits to altcoins in a quest for higher returns, which usually triggers an explosion of altcoin rallies.
추천 기사


