

Hyperliquid Price Forecast: HYPE pares gains as ETF outflows cap tentative bullish recovery

출처 Fxstreet
  • Hyperliquid is down 2% on Thursday, trimming gains after a rebound of over 5% the previous day.
  • HYPE ETFs recorded $5 million outflows on Wednesday, down from $9.25 million inflows last week, suggesting easing institutional demand.
  • The technical outlook for HYPE is mixed, as the price retreats after yesterday's 5% rebound. 

Hyperliquid (HYPE) is down 2% at press time on Thursday, trimming its 5% gains from the previous day. Institutional demand is easing, with $5 million in outflows on Wednesday, weighing on near-term investors' sentiment. The technical outlook for HYPE indicates a near-term mixed tone as the price remains capped below $90. 

Muted institutional activity weighs on Hyperliquid

Hyperliquid shows early signs of easing institutional demand. HYPE-focused Exchange Traded Funds (ETFs) recorded $5.03 million in outflows on Wednesday after two consecutive days of zero inflows earlier this week. This outflow suggests a shift in institutional activity from last week's $9.25 million in inflows. In addition, the HYPE ETFs recorded $6.86 million in outflows in September, reinforcing the easing demand from institutional investors.
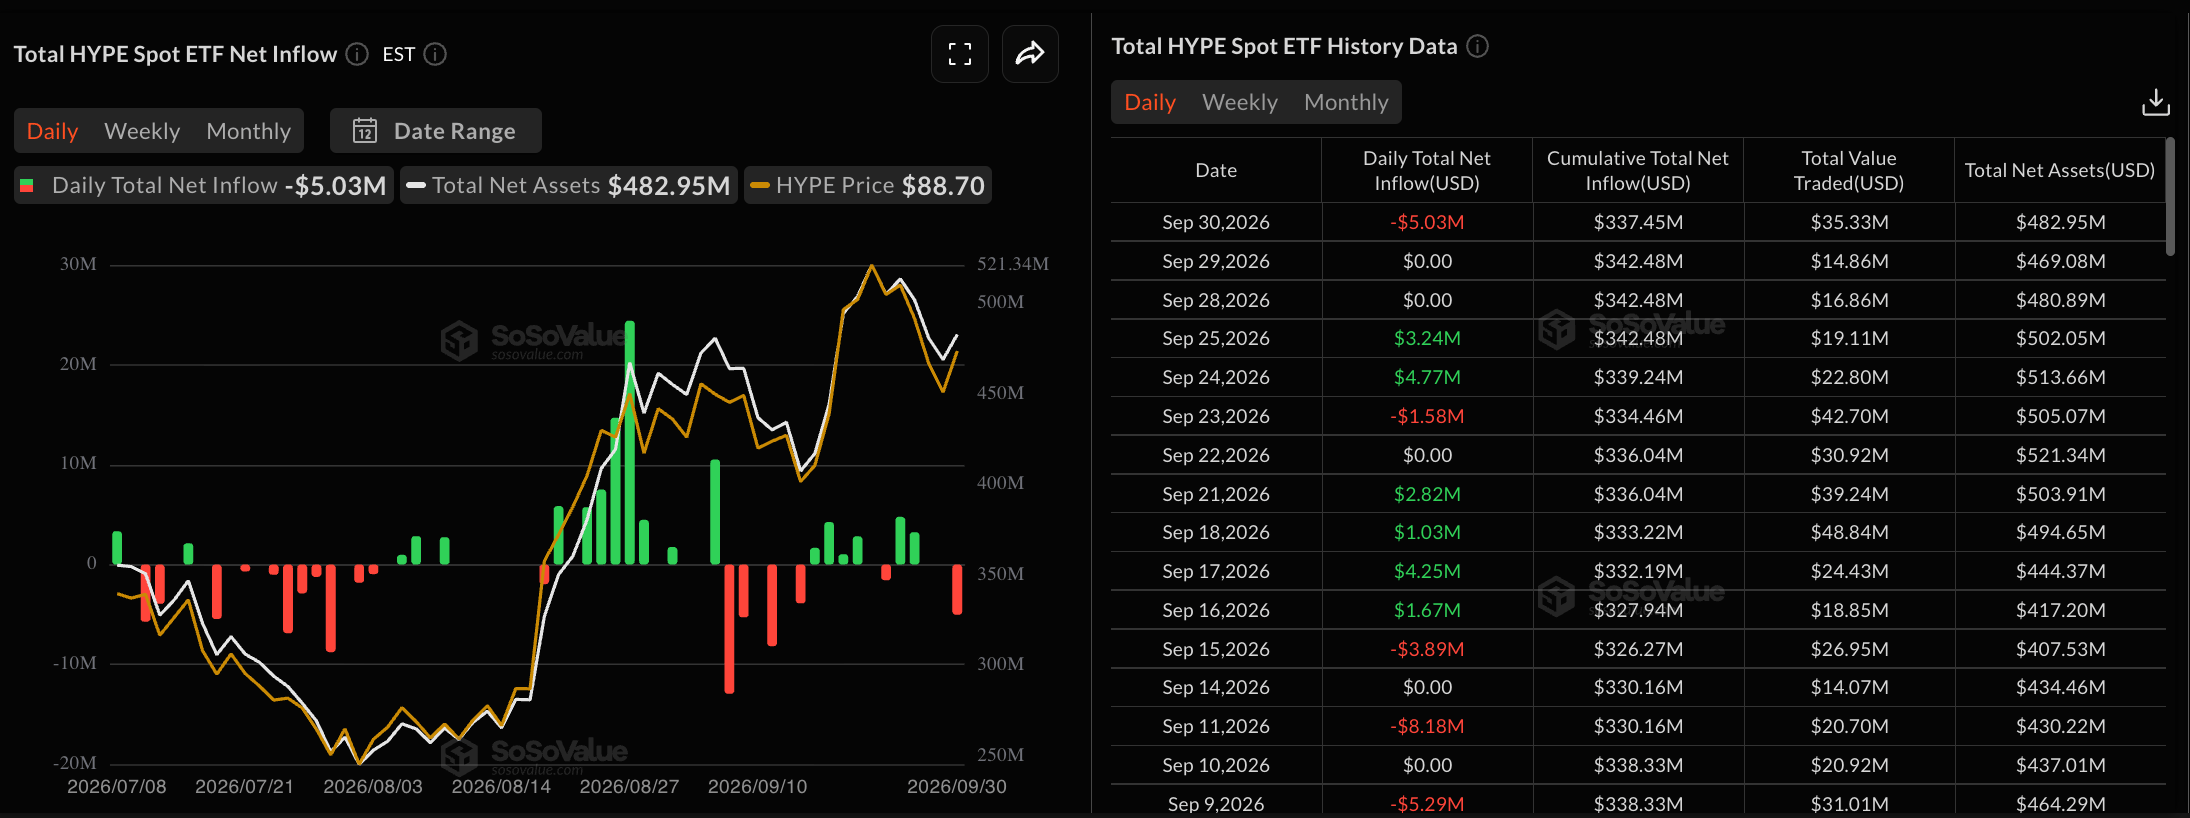
HYPE ETFs data. Source: Sosovalue

Technical outlook: Hyperliquid risks losing the rebound gains

Hyperliquid is trading below $90 at press time on Thursday, paring gains after a 5% rebound the previous day. The exchange token maintains a near-term constructive tone as it tests the 50-period Exponential Moving Average (EMA) on the four-hour chart at $89.60, while maintaining above the 100-period and 200-period EMAs at $88.55 and $84.68, underpinning a broader uptrend.

Momentum on the 4-hour chart remains mixed, with the Relative Strength Index (RSI) retreating back to the midline after a steady recovery, while the Moving Average Convergence Divergence (MACD) maintains an uptrend after crossing above its signal line the previous day.

Looking up, a potential rebound from the 50-period EMA could extend its recovery toward the $98.03 record high. A confirmed breakout above this level could claim the $100 milestone, extending the price-discovery mode.

On the flip side, the 100-period and 200-period EMAs act as nearby support levels at $88.55 and $84.68, respectively.

Chart Analysis HYPE/USD (baha Crypto)
HYPE/USD daily price chart.

(The technical analysis of this story was written with the help of an AI tool. Know more.)

면책 조항: 정보 제공 목적으로만 사용됩니다. 과거 성과가 미래 결과를 보장하지 않습니다.
placeholder
2026년 증시 ‘톱5’ 전망…AI 옥석가리기·배당주 선호·밸류에이션 조정 가능성S&P500의 3년 연속 두 자릿수 상승 이후 2026년에는 AI 옥석가리기, 섹터 로테이션, 배당주 선호, Shiller CAPE 39에 따른 밸류에이션 조정, 양자컴퓨팅 테마 급등 가능성이 핵심 변수로 거론된다.
저자  Mitrade팀
1 월 05 일 월요일
S&P500의 3년 연속 두 자릿수 상승 이후 2026년에는 AI 옥석가리기, 섹터 로테이션, 배당주 선호, Shiller CAPE 39에 따른 밸류에이션 조정, 양자컴퓨팅 테마 급등 가능성이 핵심 변수로 거론된다.
placeholder
Bitcoin(BTCUSD) 종목이 10월5일에 1.08% 상승한 이유를 확인해 보세요Bitcoin (BTCUSD) 종목은 10월5일 21:15(ET)에 1.08% 상승하여, 현재 가격은 $86721.22이고, 최근 7일간 3.84% 상승했습니다.오늘 Bitcoin(BTCUSD) 주가 상승의 요인은 무엇인가요?거시경제 전망의 변화와 지속적인 기관 수요가 디지털 자산 시장 전반을 뒷받침함에 따라 비트코인으로 자금이 유입되었다. 국채 금리 압력
저자  Mitrade팀
10 월 05 일 월요일
Bitcoin (BTCUSD) 종목은 10월5일 21:15(ET)에 1.08% 상승하여, 현재 가격은 $86721.22이고, 최근 7일간 3.84% 상승했습니다.오늘 Bitcoin(BTCUSD) 주가 상승의 요인은 무엇인가요?거시경제 전망의 변화와 지속적인 기관 수요가 디지털 자산 시장 전반을 뒷받침함에 따라 비트코인으로 자금이 유입되었다. 국채 금리 압력
placeholder
Ethereum(ETHUSD) 종목이 10월7일에 갑자기 3.13% 하락한 상황에서 무엇을 주목해야 할까요?Ethereum (ETHUSD) 종목은 10월7일 22:05(ET)에 3.13% 하락하여, 현재 가격은 $2611.59이고, 최근 7일간 2.55% 하락했습니다.오늘 Ethereum(ETHUSD) 주가 하락의 요인은 무엇인가요?이더리움은 주로 지속적인 기관 자금 유출과 미국 이더리움 현물 상장지수펀드(ETF)에서의 순상환 여파로 매도 압력을 받았다. 이들
저자  Mitrade팀
10 월 07 일 수요일
Ethereum (ETHUSD) 종목은 10월7일 22:05(ET)에 3.13% 하락하여, 현재 가격은 $2611.59이고, 최근 7일간 2.55% 하락했습니다.오늘 Ethereum(ETHUSD) 주가 하락의 요인은 무엇인가요?이더리움은 주로 지속적인 기관 자금 유출과 미국 이더리움 현물 상장지수펀드(ETF)에서의 순상환 여파로 매도 압력을 받았다. 이들
placeholder
삼성전자 3분기 이익 8배 가까이 급증해 사상 최고치 기록; SK하이닉스 1% 가까이 상승, 키옥시아 4% 가까이 상승TradingKey - 10월 8일 아시아 거래 세션에서 일본과 한국 증시는 혼조세로 출발했다. 닛케이 225 지수는 0.28% 하락한 69,840.6포인트로 장을 시작한 반면, 한국종합주가지수(코스피)는 0.07% 상승한 6,808.68포인트를 기록했다. 밤사이 미 증시가 조정을 받고 미 국채 금리가 높은 수준을 유지한 여파로 한국과 일본의 기술주는 엇갈
저자  Mitrade팀
10 월 08 일 목요일
TradingKey - 10월 8일 아시아 거래 세션에서 일본과 한국 증시는 혼조세로 출발했다. 닛케이 225 지수는 0.28% 하락한 69,840.6포인트로 장을 시작한 반면, 한국종합주가지수(코스피)는 0.07% 상승한 6,808.68포인트를 기록했다. 밤사이 미 증시가 조정을 받고 미 국채 금리가 높은 수준을 유지한 여파로 한국과 일본의 기술주는 엇갈
placeholder
닛케이 225 지수 장 초반 1% 이상 하락, 소프트뱅크 거의 7% 하락, 키옥시아 4% 이상 하락; 한국 증시 휴장TradingKey - 10월 9일 일본 증시가 장 초반 약세를 보였다. 닛케이 225 지수는 0.57% 하락한 68,648.50포인트로 개장한 후 낙폭을 1.03%로 확대해 68,330.05포인트를 기록했다. 한편 한국 증시는 휴장하여 이날 거래가 이뤄지지 않았다.출처: TradingView일본 기술주는 전반적으로 압박을 받았다. 소프트뱅크그룹이 장 초반
저자  Mitrade팀
10 월 09 일 금요일
TradingKey - 10월 9일 일본 증시가 장 초반 약세를 보였다. 닛케이 225 지수는 0.57% 하락한 68,648.50포인트로 개장한 후 낙폭을 1.03%로 확대해 68,330.05포인트를 기록했다. 한편 한국 증시는 휴장하여 이날 거래가 이뤄지지 않았다.출처: TradingView일본 기술주는 전반적으로 압박을 받았다. 소프트뱅크그룹이 장 초반
goTop
quote