


Ripple Price Forecast: XRP builds breakout momentum despite weakening demand
- XRP climbs above the $1.50 pivotal level, raising the odds of another breakout.
- XRP spot ETF activity remained muted on Tuesday while the futures Open Interest stalled, signaling softening investor interest.
- XRP retains a bullish outlook, with the RSI edging higher above the midline and major moving averages providing support.
Ripple (XRP) is gaining momentum above $1.50 at the time of writing on Wednesday, as the cryptocurrency extends stability following the cooldown from last week’s rally. A daily close above $1.50 would reinforce the neutral-to-bullish stance and increase the chance of recovery and an extended breakout to September highs of $1.66 and August highs of $1.70.
XRP ticks up despite slowing demand
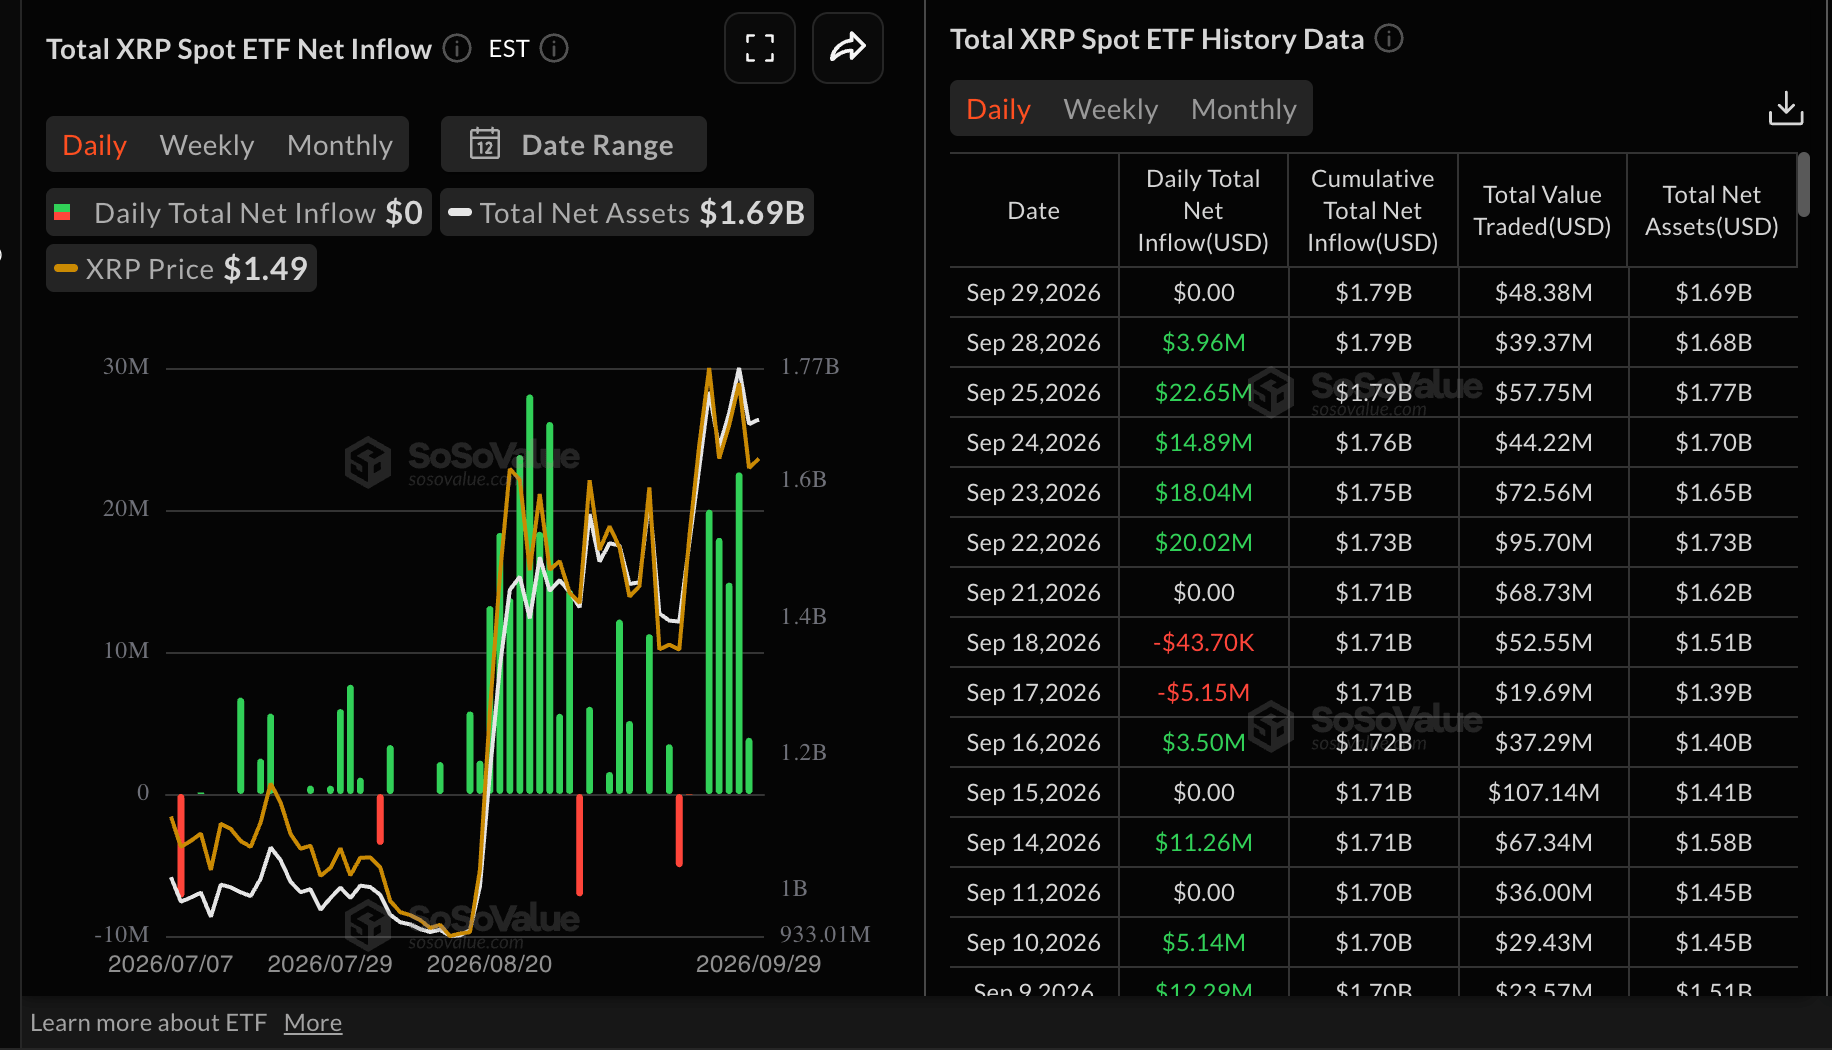
Institutional appetite for XRP spot Exchange-Traded Funds (ETFs) took a back seat amid muted activity on Tuesday. US-listed ETFs recorded no flows, leaving cumulative inflows at $1.79 billion while net assets under management average $1.7 billion. The lack of flows suggests demand may be softening, but institutional investors still view XRP as a fundamentally strong long-term asset.
The derivatives market signals stable demand, with futures Open Interest (OI) at 2.34 billion XRP on Wednesday. Broadly, OI has steadied at this level since Tuesday after falling from 2.46 billion on Monday.
A resumption of the uptrend from mid-September would support the bullish outlook and encourage traders to take on more risk. Still, continued stalling or a decline in the OI would mean that interest in the remittance token is falling and may trigger an extended drawdown.
Technical analysis: XRP ticks up reclaiming $1.50
XRP trades at $1.51, extending its advance well above the major Exponential Moving Averages, which keeps the near‑term bias bullish. Price stands over the 50‑day EMA at $1.37 and the 200‑day EMA at $1.37, while the 100‑day EMA at $1.31 and the SuperTrend line at $1.28 trail as additional underlying demand.
The Relative Strength Index RSI) at 58 sits in positive territory but shy of overbought, and the Moving Average Convergence Divergence (MACD) indicator has flattened just below the zero line, hinting that upside momentum is constructive but may be losing some vigor after the latest rally.
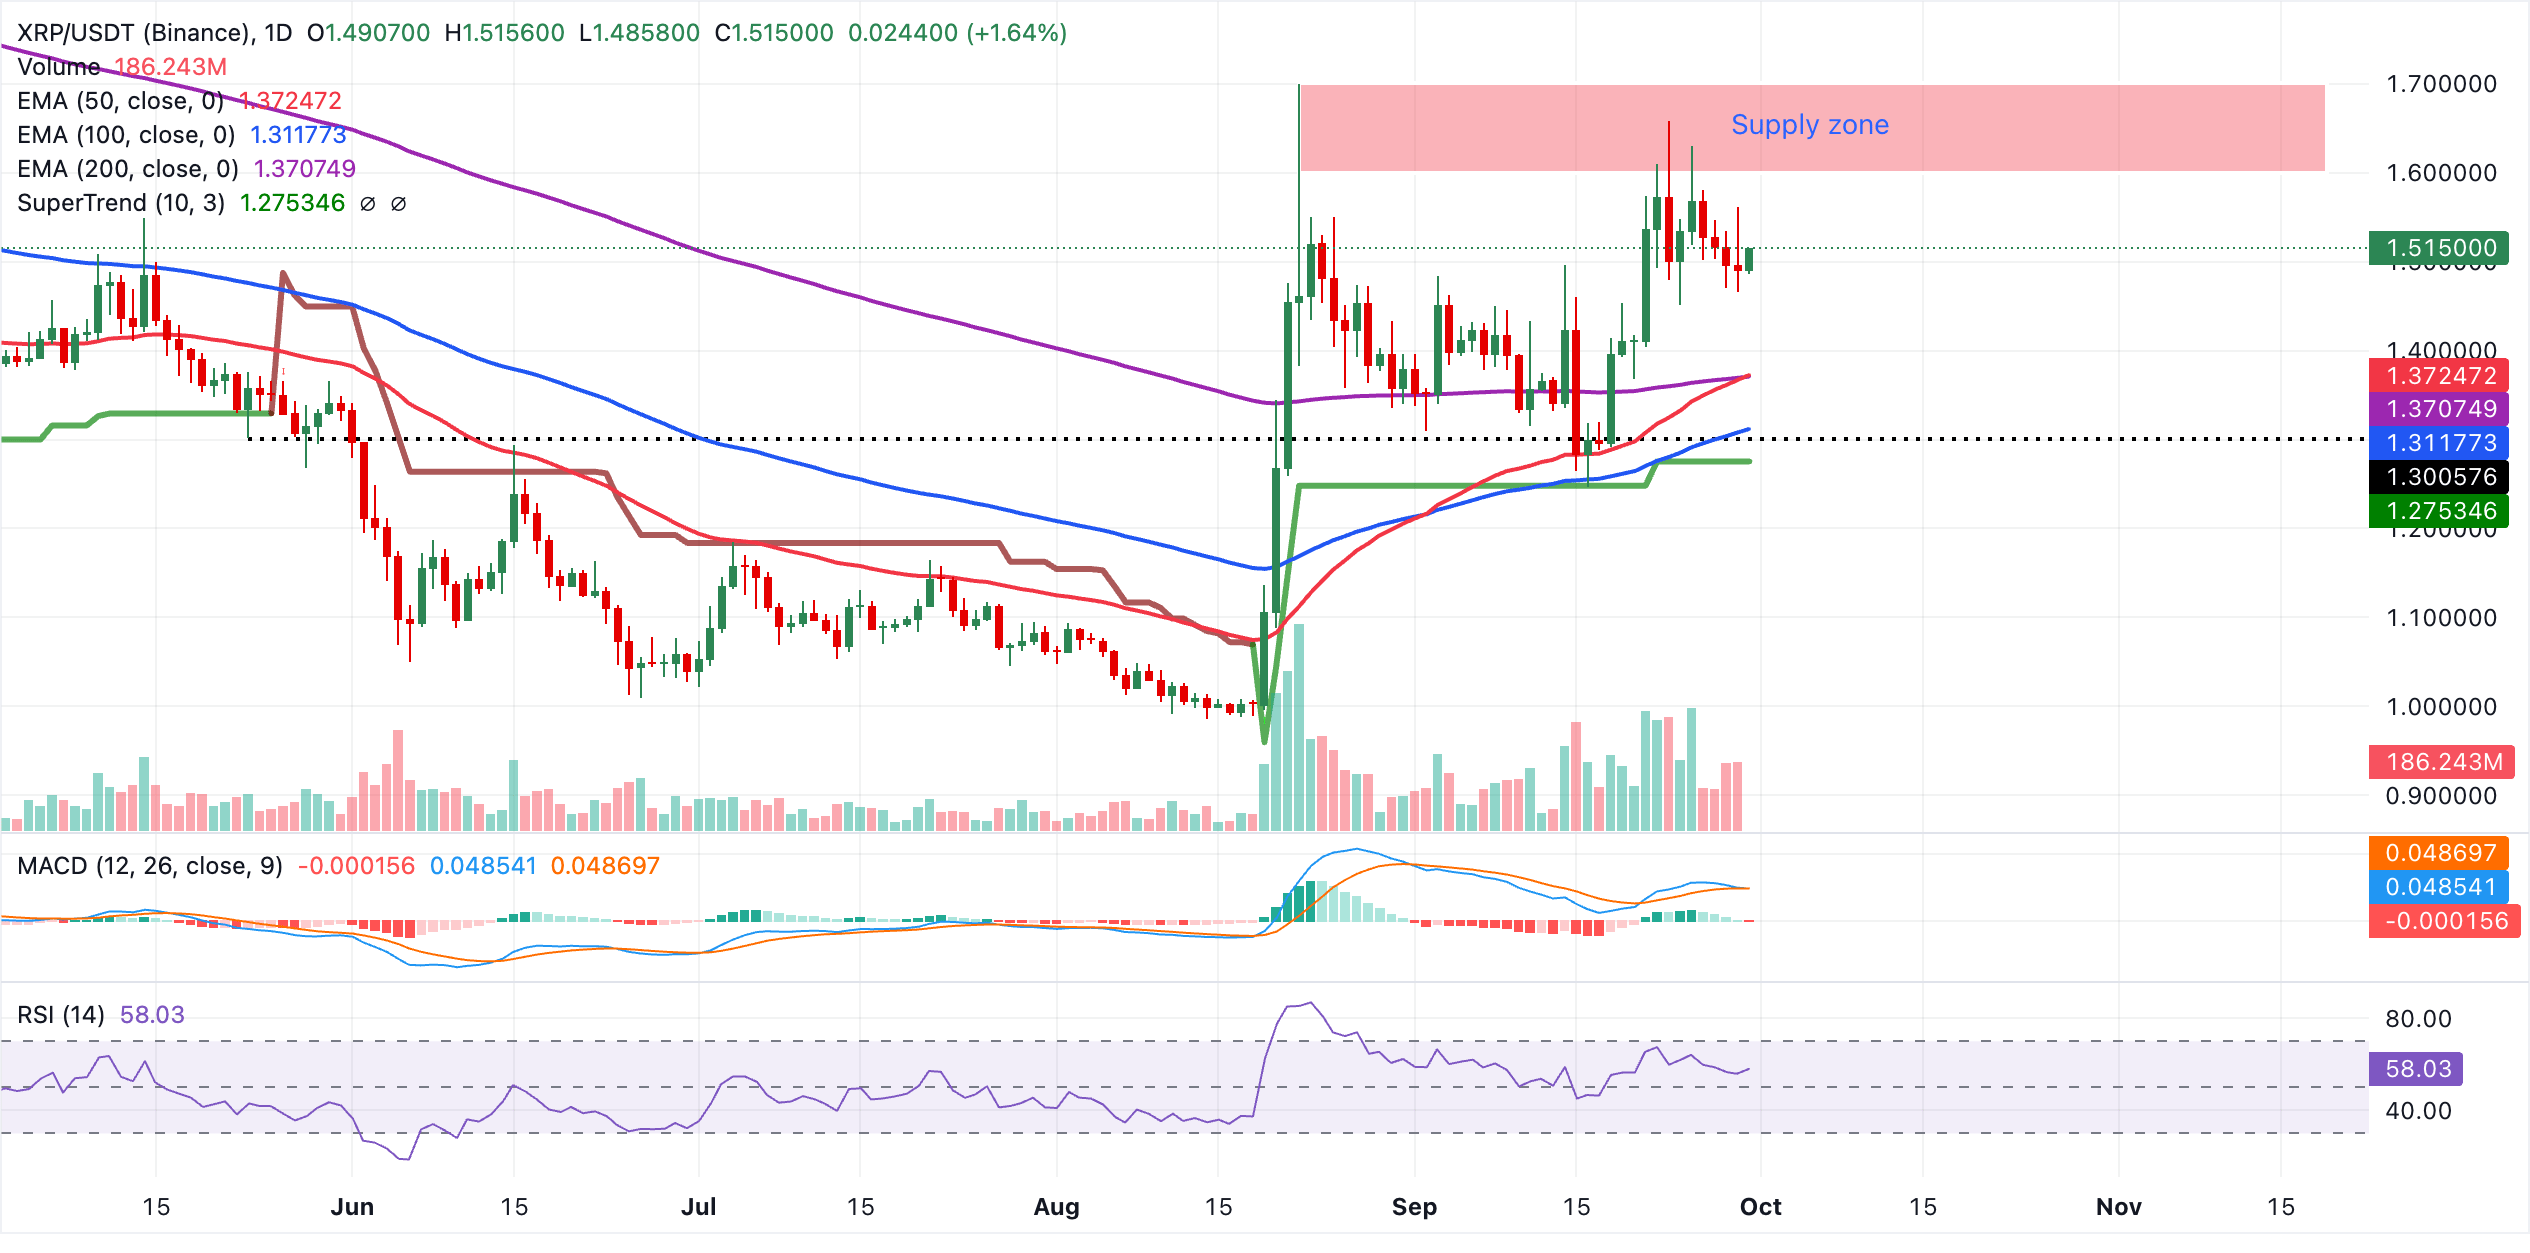
On the downside, initial support is clustered around the 50‑day EMA at $1.37 and the 200‑day EMA at $1.37, where any pullback could find buyers on a first test. Below this area, the 100‑day EMA at $1.31 and the SuperTrend level at $1.28 form a deeper demand zone that would come into focus if corrective pressure extends, while the absence of nearby overhead levels leaves the pair looking for a new resistance reference as the current leg higher matures.
Ripple FAQs
Ripple is a payments company that specializes in cross-border remittance. The company does this by leveraging blockchain technology. RippleNet is a network used for payments transfer created by Ripple Labs Inc. and is open to financial institutions worldwide. The company also leverages the XRP token.
XRP is the native token of the decentralized blockchain XRPLedger. The token is used by Ripple Labs to facilitate transactions on the XRPLedger, helping financial institutions transfer value in a borderless manner. XRP therefore facilitates trustless and instant payments on the XRPLedger chain, helping financial firms save on the cost of transacting worldwide.
XRPLedger is based on a distributed ledger technology and the blockchain using XRP to power transactions. The ledger is different from other blockchains as it has a built-in inflammatory protocol that helps fight spam and distributed denial-of-service (DDOS) attacks. The XRPL is maintained by a peer-to-peer network known as the global XRP Ledger community.
XRP uses the interledger standard. This is a blockchain protocol that aids payments across different networks. For instance, XRP’s blockchain can connect the ledgers of two or more banks. This effectively removes intermediaries and the need for centralization in the system. XRP acts as the native token of the XRPLedger blockchain engineered by Jed McCaleb, Arthur Britto and David Schwartz.
(The technical analysis of this story was written with the help of an AI tool. Know more.)
추천 기사


