


Zcash Price Forecast: ZEC stalls around $1,400 as easing upside momentum risks capitulation
- Zcash hovers around $1,400 on Wednesday after three consecutive days of losses totaling about 15%.
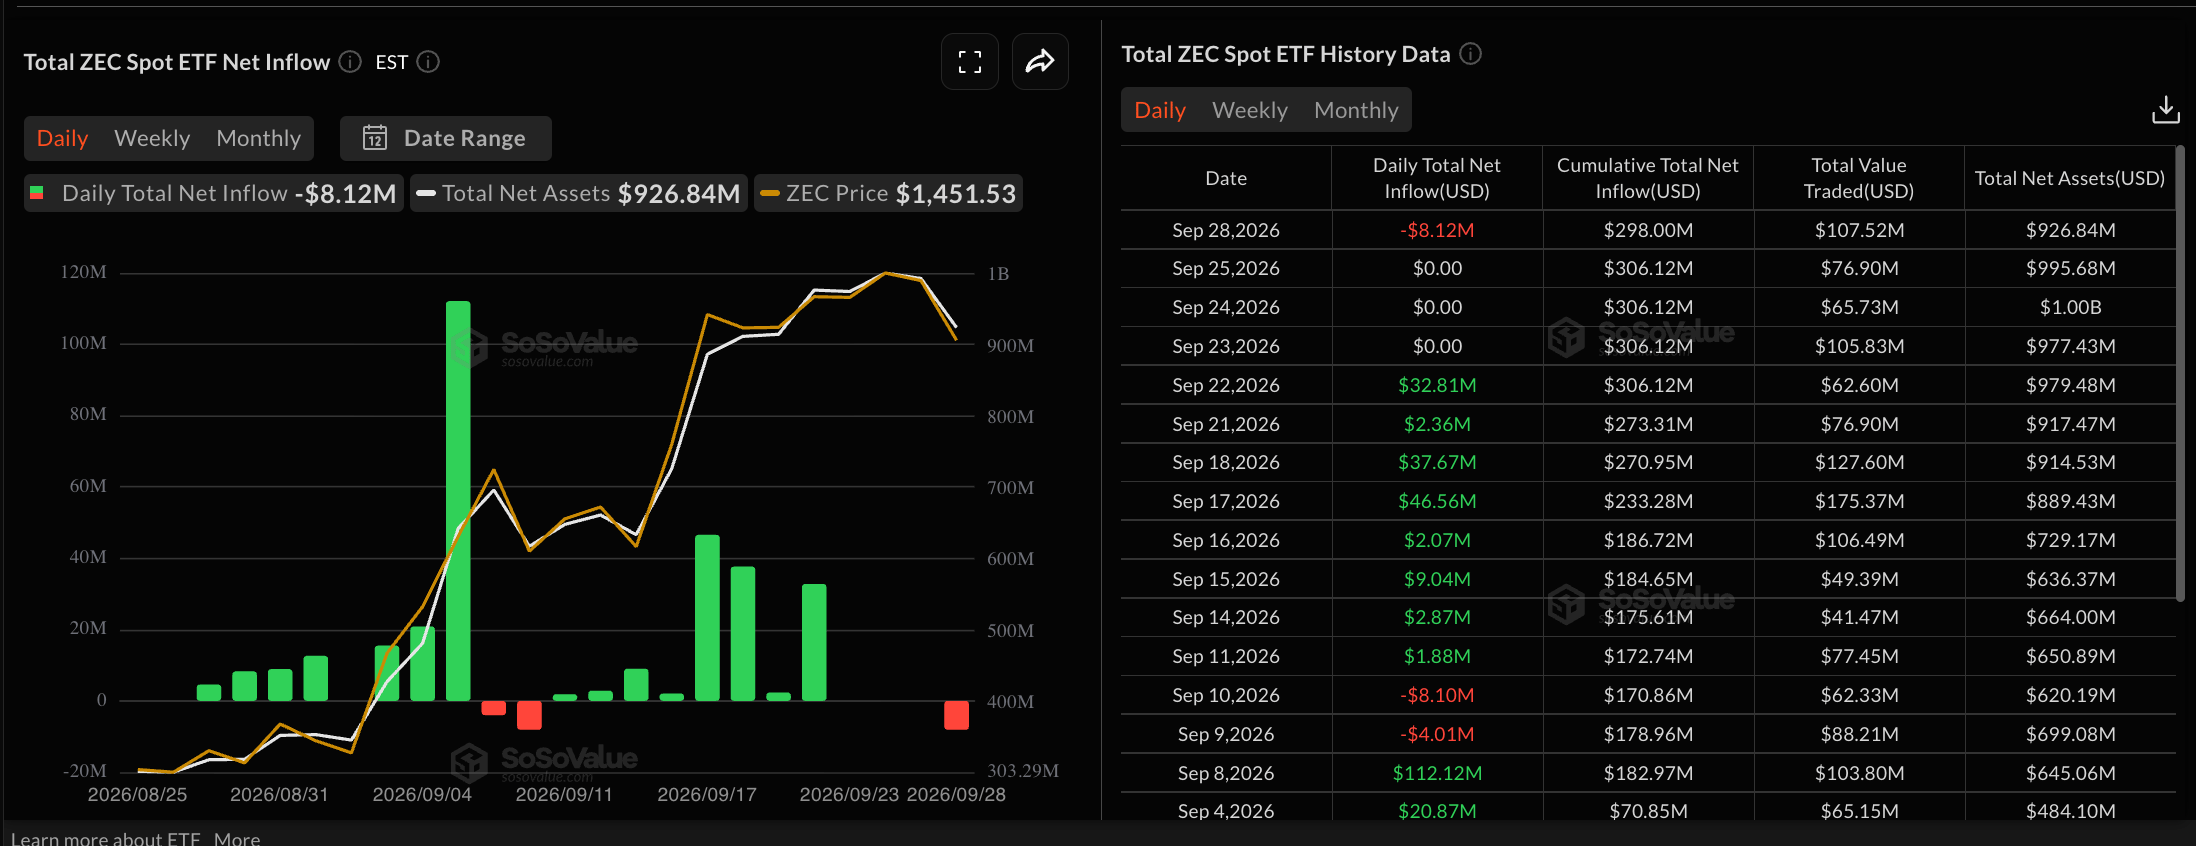
- Grayscale’s ZEC-focused ETFs recorded over $8 million in outflows on Monday, ahead of its 3-for-1 stock split on Wednesday.
- The technical outlook for ZEC indicates a near-term corrective bias, targeting the $1,300 support floor.
Zcash (ZEC) price stalls around $1,400 at press time on Wednesday, holding steady after a 15% decline over the last three consecutive days of losses. Early signs of easing institutional demand, with $8 million in outflows on Monday, back the near-term downside risk in the privacy coin. The technical outlook for ZEC indicates a potential dip toward the $1,300 support floor.
Grayscale’s ZCSH inflows flip negative ahead of stock split
Grayscale’s Zcash Trust Fund Exchange Traded Fund (ETF), ticker ZCSH, announced a 3-for-1 stock split within its first month of trading. This decision is based on the strong bullish undercurrent, with over $250 million in inflows in the first 30 days of trading, totaling $21.83 million in August and $276.17 million so far in September.
However, the ZCSH fund recorded zero inflow on Tuesday after $8.12 million in outflows on Monday, suggesting an early sign of easing institutional demand ahead of the stock split.
Technical outlook: Will Zcash hold above $1,300?
Zcash trades around $1,412 at press time on Wednesday, extending the pullback from Sunday's high of $1,698. The privacy coin maintains a near-term bearish bias after three consecutive days of losses totaling around 15%.
The price hovers below the 50- and 100-period Exponential Moving Averages (EMAs) on the four-hour chart at $1,494 and $1,425, respectively, while only the 200-period EMA at $1,254 underpins the broader structure. The path of least resistance targets a downside to the September 9 high at $1,296, reinforced by the 200-period EMA at $1,254, projecting a potential 10% downside risk.
The Moving Average Convergence Divergence (MACD) remains in negative territory with a bearish profile, and the Relative Strength Index (RSI) around 41 suggests subdued demand, reinforcing the risk of further downside.
On the topside, initial resistance aligns with the 100-period EMA at $1,425 ahead of a stronger barrier at the 50-period EMA near $1,494, where sellers could reassert control if the pair attempts a corrective bounce. A confirmed breakout above the overhead average lines could target the September 23 high at $1,679, which capped gains on Sunday.
(The technical analysis of this story was written with the help of an AI tool. Know more.)
추천 기사


