


Gold can’t catch a PCE break as long US yields keep climbing
- US Core PCE undershoots forecasts, shifting October odds toward Fed hold.
- The 30-year yield surges above 5.64%, weighing heavily on Bullion.
- Strong GDP and ADP data reinforce US economic resilience.
Gold prices (XAU/USD) retreated on Wednesday, down 0.6%, after US inflation data came in above the Federal Reserve’s (Fed) 2% goal but below estimates, prompting investors to price in a less hawkish central bank than expected. The XAU/USD trades at $4,155 at the time of writing.
XAU/USD slips despite softer inflation as Treasury yields overpower Fed repricing
The Fed’s preferred inflation gauge, the core Personal Consumption Expenditures (PCE) Price Index, was unchanged from July’s print at 3.0% annually in August, below forecasts of 3.3%. The headline print was 3.4% for the same period, unchanged from July’s and beneath forecasts for a rise to 3.7%.
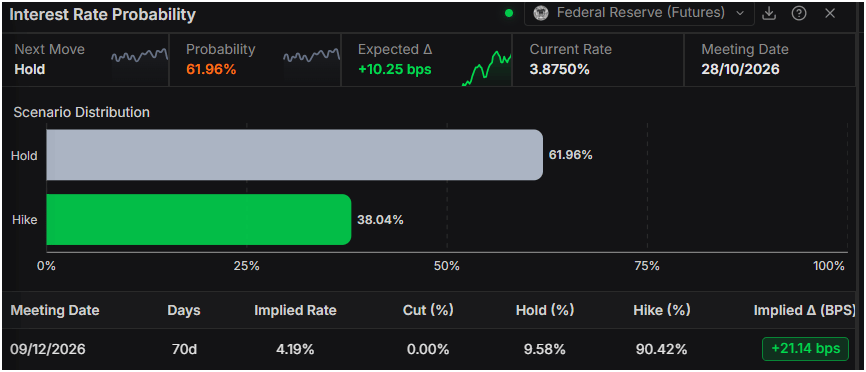
The data triggered a reaction by money markets, with traders making a U-turn and now expecting the Fed to hold rates at the October meeting, with odds standing near 62%, according to Prime Terminal.
Ahead of the inflation release, ADP's jobs data showed that private companies added 90K workers, exceeding estimates of 70K and confirming Fed Chair Kevin Warsh's comments that the labour market is consistent with full employment.
Given the backdrop, the Greenback's mixed reaction is evident in the US Dollar Index (DXY). The DXY, which measures the performance of the US Dollar against six currencies, fell to a low of 101.02 before reclaiming the 101.30 area and turned positive on the day.
US Treasury yields are also rising sharply with the US 30-year bond yield soaring 8 basis points to 5.647%. The US 10-year benchmark note yields 5.302%, rising nearly 7 basis points.
Other data revealed that the US economy grew 2.2% in Q2 2026 (final reading), exceeding forecasts of 1.5% growth and reaffirming its resilience. Meanwhile, the trade deficit widened in August, based on data from the US Commerce Department.
Traders’ attention turns to further Fed speakers and jobless claims ahead of the release of September’s Nonfarm Payrolls data on Friday.
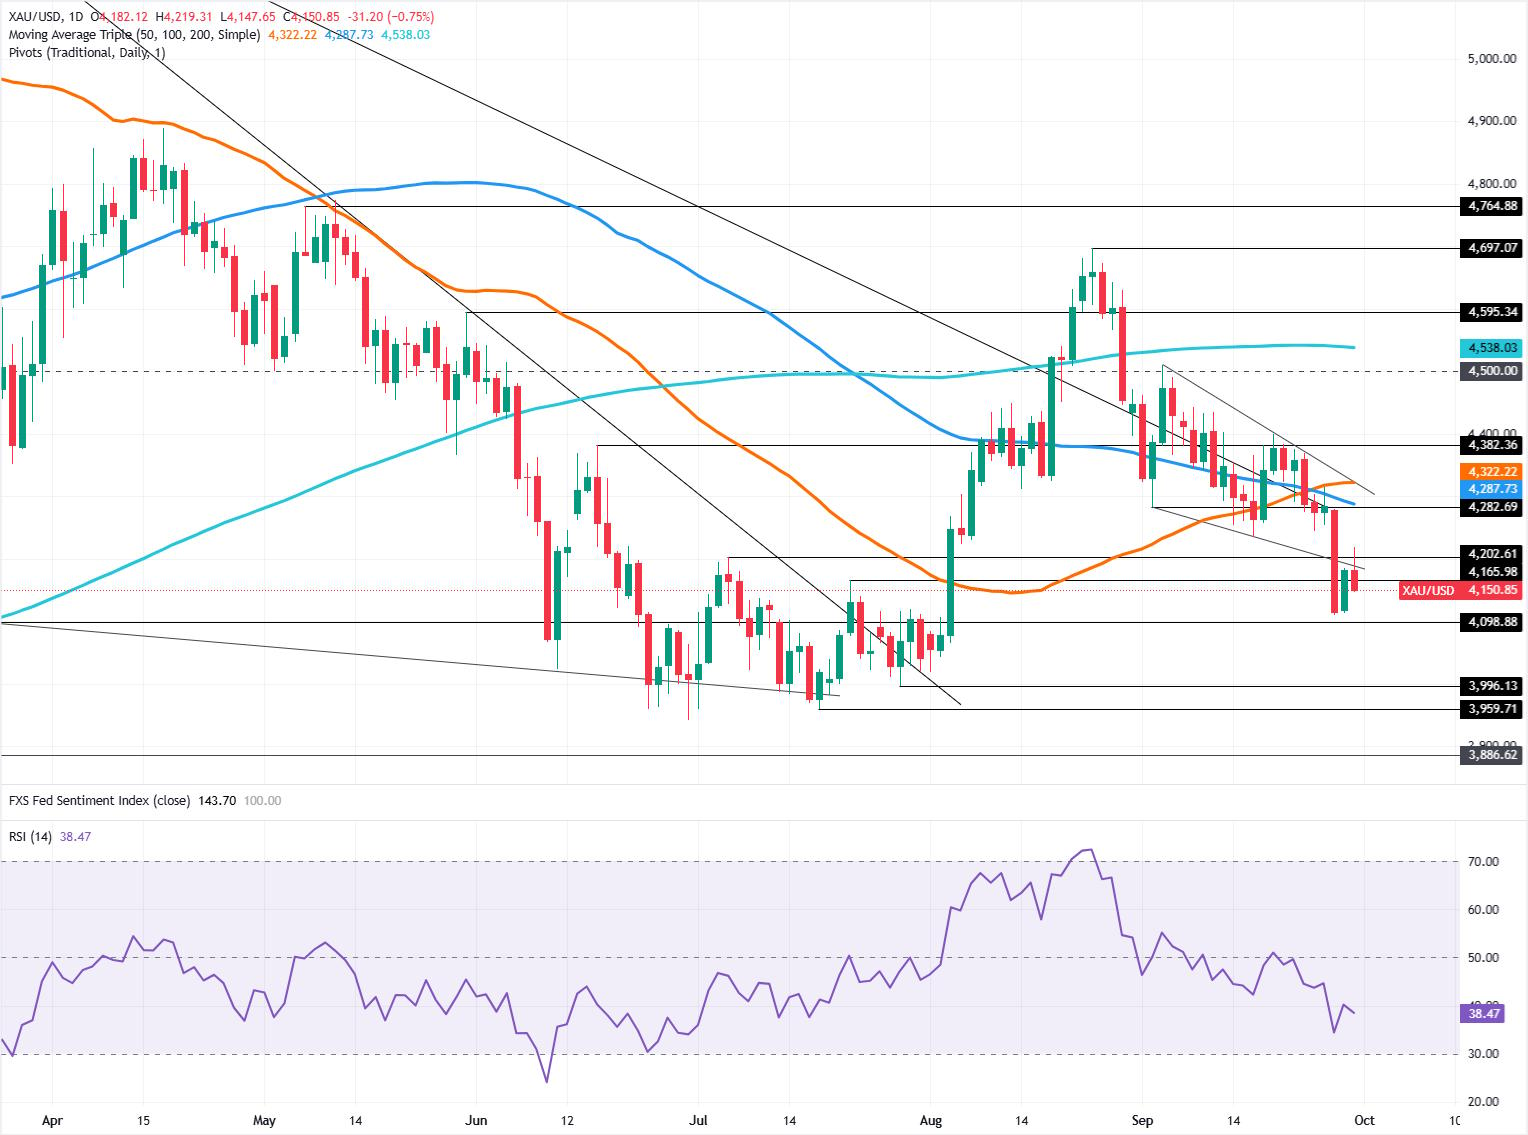
XAU/USD technical analysis: Gold retreats below $4,150
Gold’s daily chart shows that the downtrend remains intact as the non-yielding metal has failed to reclaim the bottom trendline of a "bullish wedge." Although momentum has turned moderately bullish, the Relative Strength Index (RSI) remains bearish, suggesting sellers are in control. Therefore, the path of least resistance is downward.
The first support for XAU/USD is the $4,100 mark. Below, the next support is the July 29 swing low of $3,996, followed by the July 17 low at $3,959. Once those levels are hurdled, the next area of interest is the year-to-date (YTD) low at $3,941.
For a bullish reversal, Gold must reclaim the 100-day Simple Moving Average (SMA) at $4,287.
Gold FAQs
Gold has played a key role in human’s history as it has been widely used as a store of value and medium of exchange. Currently, apart from its shine and usage for jewelry, the precious metal is widely seen as a safe-haven asset, meaning that it is considered a good investment during turbulent times. Gold is also widely seen as a hedge against inflation and against depreciating currencies as it doesn’t rely on any specific issuer or government.
Central banks are the biggest Gold holders. In their aim to support their currencies in turbulent times, central banks tend to diversify their reserves and buy Gold to improve the perceived strength of the economy and the currency. High Gold reserves can be a source of trust for a country’s solvency. Central banks added 1,136 tonnes of Gold worth around $70 billion to their reserves in 2022, according to data from the World Gold Council. This is the highest yearly purchase since records began. Central banks from emerging economies such as China, India and Turkey are quickly increasing their Gold reserves.
Gold has an inverse correlation with the US Dollar and US Treasuries, which are both major reserve and safe-haven assets. When the Dollar depreciates, Gold tends to rise, enabling investors and central banks to diversify their assets in turbulent times. Gold is also inversely correlated with risk assets. A rally in the stock market tends to weaken Gold price, while sell-offs in riskier markets tend to favor the precious metal.
The price can move due to a wide range of factors. Geopolitical instability or fears of a deep recession can quickly make Gold price escalate due to its safe-haven status. As a yield-less asset, Gold tends to rise with lower interest rates, while higher cost of money usually weighs down on the yellow metal. Still, most moves depend on how the US Dollar (USD) behaves as the asset is priced in dollars (XAU/USD). A strong Dollar tends to keep the price of Gold controlled, whereas a weaker Dollar is likely to push Gold prices up.
추천 기사


