


Crypto Overview: Bitcoin holds at $78,000 amid US PCE surprise – SPX6900, VeChain rally
- Bitcoin hovers around $78,000 on Thursday, sustaining the 23% gains from last week.
- US July PCE inflation hits 3.7%, above expectations of 3.6%, nearly double the Fed’s target of 2%.
- SPX6900 and VeChain recorded double-digit gains over the last 24 hours, emerging as top performers.
The broader cryptocurrency market maintains a constructive tone, with Bitcoin (BTC) sustaining gains above $78,000 on Thursday. The US July Personal Consumption Expenditures (PCE) Price Index inflation came in higher than expected on Wednesday, suggesting that inflation remains elevated. SPX6900 (SPX) and VeChain (VET) recorded double-digit gains over the last 24 hours, emerging as top performers.
US July PCE data hits 3.7%
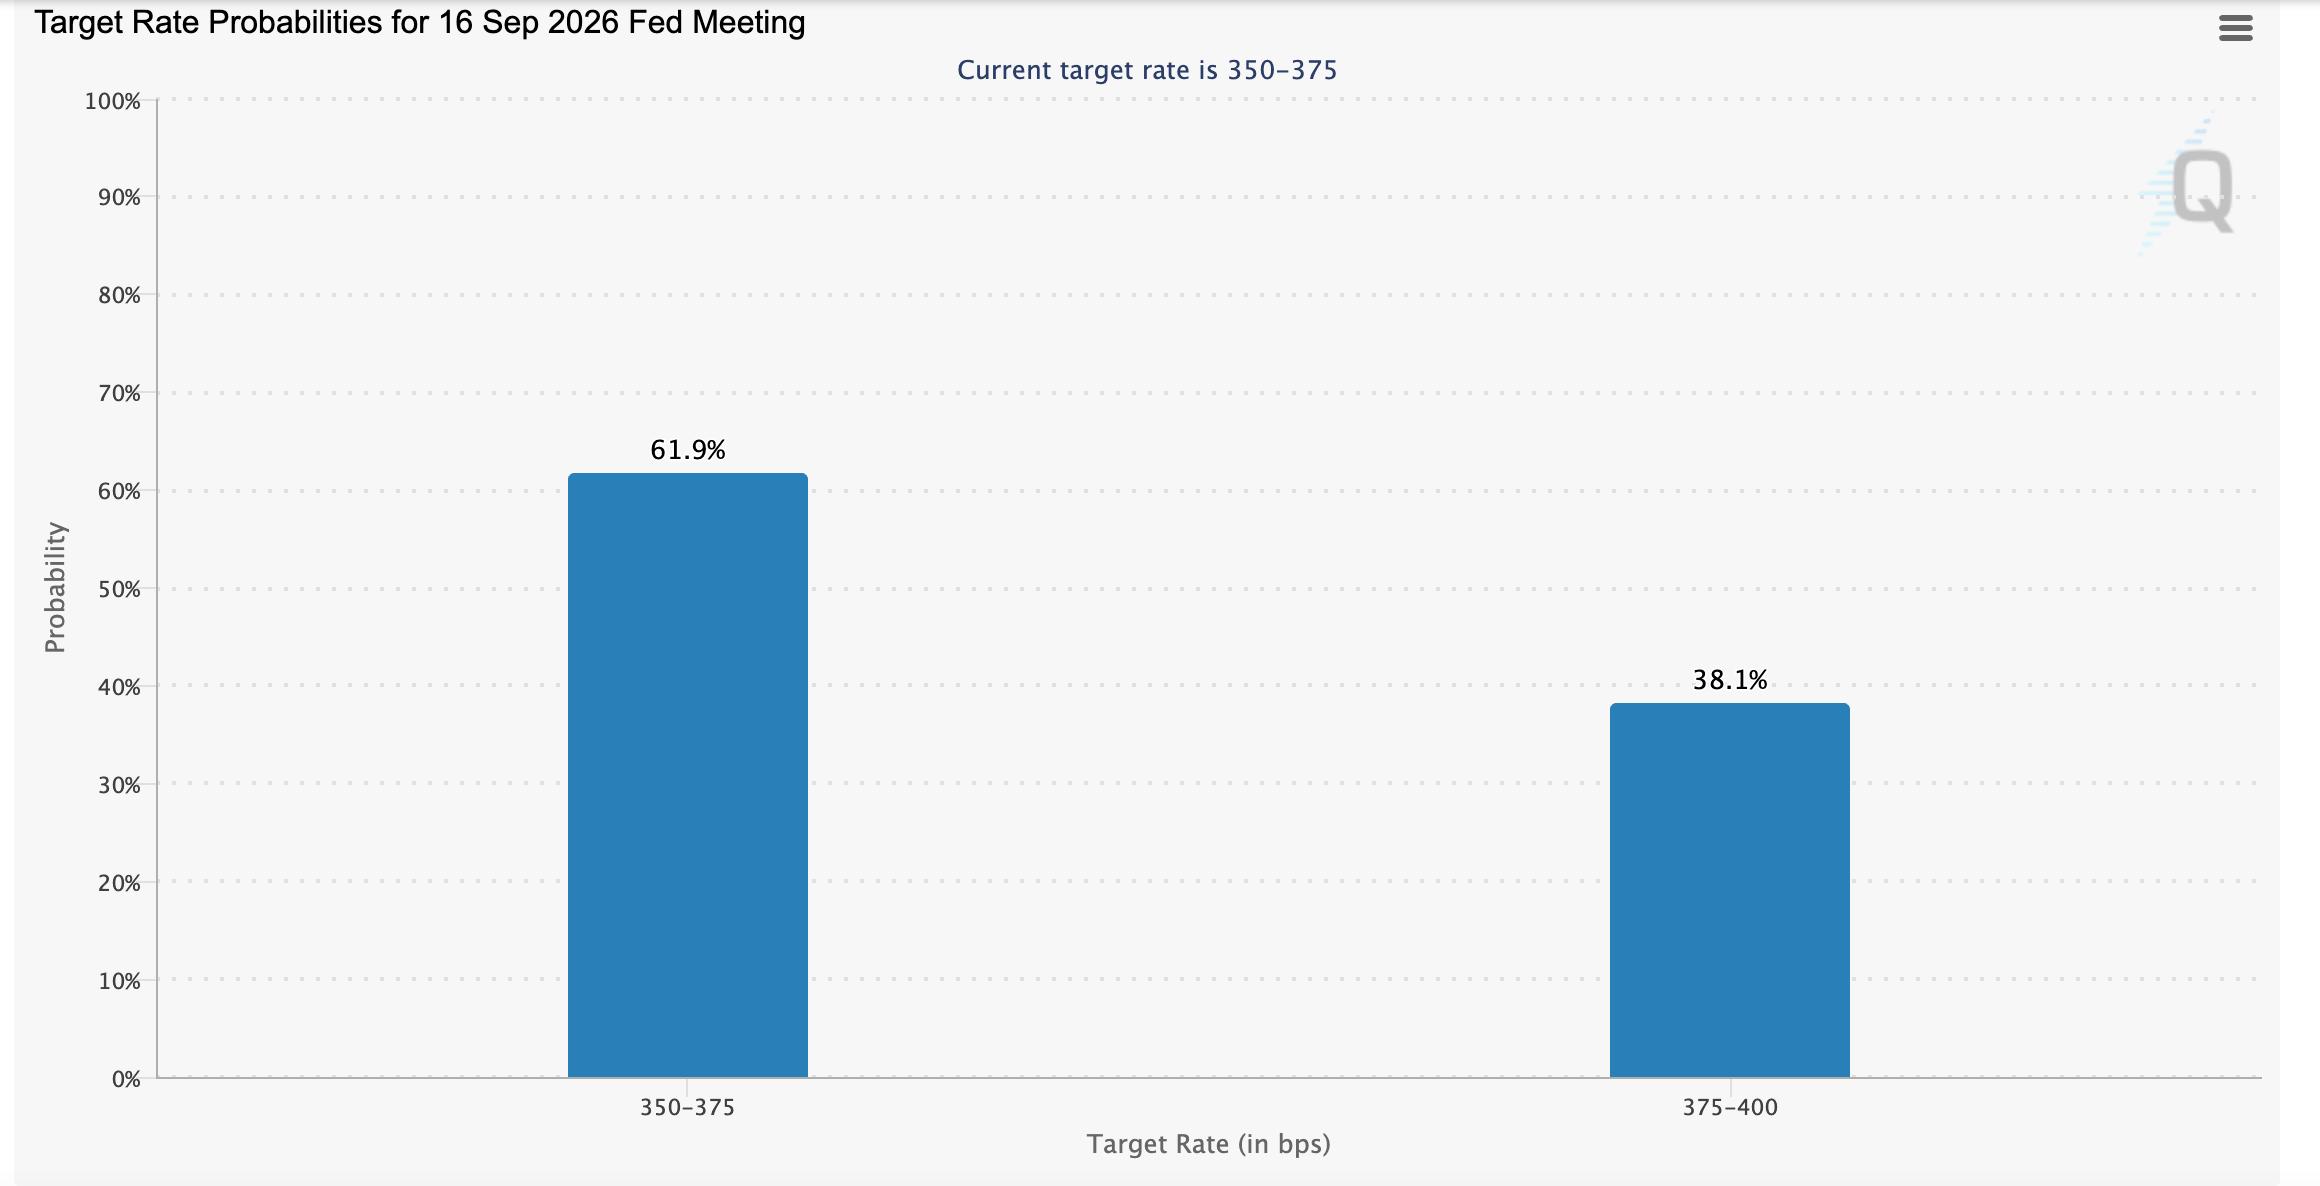
US July Personal Consumption Expenditures (PCE) Price Index inflation was released at 3.7% on Wednesday, higher than the market’s expectation of 3.6%. This suggests elevated inflation, but expectations for a September rate hike continue to fade, with markets pricing in a 38% probability of a 25-basis-point move in the next review cycle, down 55% from a month prior, according to CME FedWatch Tool data.
Scarce assets like Gold and Bitcoin struggle to advance their rally above the key levels of $4,700 and $80,000, as previously reported by FXStreet.
Bitcoin’s recovery struggles to surpass $80,000
Bitcoin trades around $78,700 at press time on Thursday, maintaining a bullish near-term bias as price holds well above both the 50-day Exponential Moving Average (EMA) at $68,195 and the 200-day EMA at $72,859.
The pair is consolidating just above the 78.6% Fibonacci retracement at $77,489, measured from $82,850 to $57,800, suggesting strong underlying demand ahead of the cycle-high resistance at $82,850.
Momentum remains firm, with the Moving Average Convergence Divergence (MACD) staying in positive territory and the Relative Strength Index (RSI) hovering in overbought conditions near 78, hinting that the advance is stretched.
Looking up, a sustained push higher would bring the key resistance at the 100% Fibonacci retracement at $82,850 into focus, where profit-taking could slow the current bullish leg. Beyond this zone, the 127.2% Fibonacci extension level at $91,374 could serve as the next bullish target.
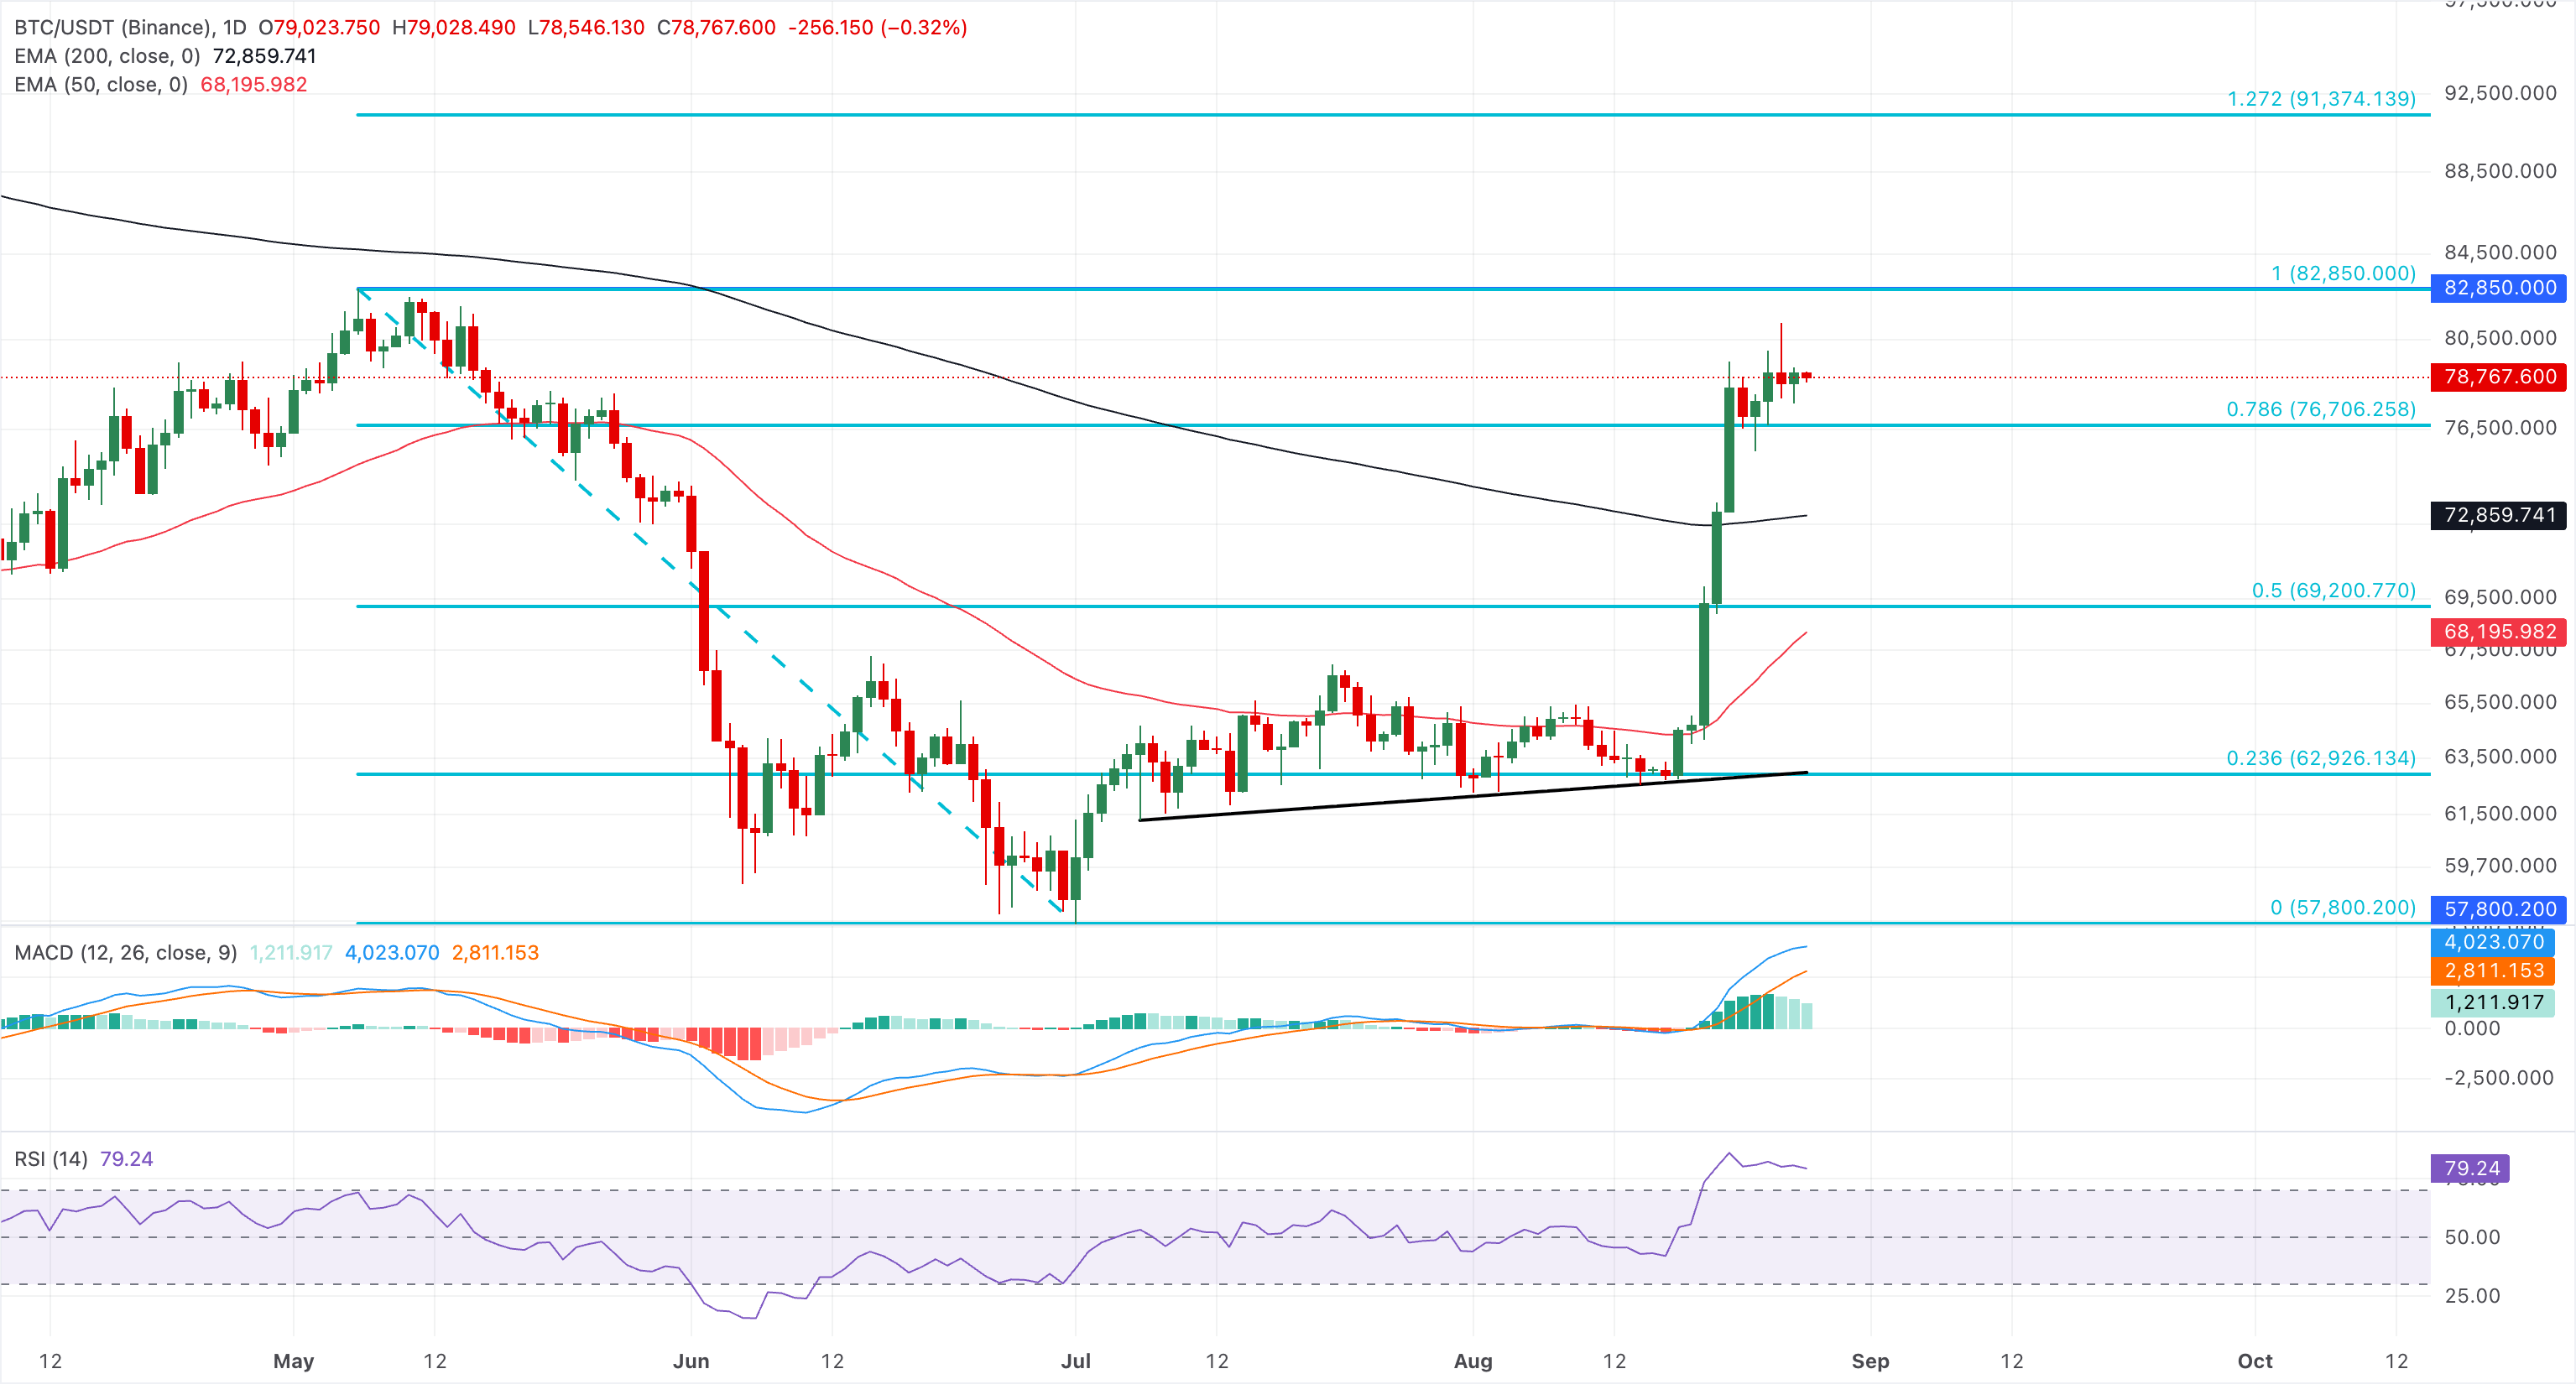
On the flip side, initial support is seen at the 78.6% Fibonacci retracement at $77,489, followed by a broader demand cluster around the 200-day EMA at $72,859. Deeper pullbacks would expose the 50% retracement at $70,325 and the 50-day EMA at $69,200.
SPX and VET rally risks capitulation
SPX6900 trades at $0.6167, extending a strong bullish phase after reclaiming territory well above both the 50-day and 200-day EMAs at $0.3822 and $0.4066. This configuration suggests a firmly supportive trend backdrop.
Momentum appears stretched, with the RSI holding deep in overbought territory near 85, and the MACD average lines maintaining a positive slope, hinting at robust but potentially overextended upside pressure.
SPX must surpass the 50% retracement level of $0.7097 to extend its rally toward the $1.00 psychological threshold. The 78.6% Fibonacci retracement near $1.3835 marks a progressively higher target if buyers stay in control.
Looking down, the 200-day EMA at $0.4066 and the 50-day EMA at $0.3822 form a key support cluster, reinforced by the 23.6% Fibonacci retracement level at $0.3832.
VeChain trades near $0.0064 on Thursday, holding a constructive near-term bullish bias. At the time of writing, VET edges 2% lower on the day, following an 18% rise the previous day.
VeChain remains capped below the 200-day EMA at $0.00702 and holds well above the 50-day EMA at $0.00507. From a technical perspective, the 78.6% Fibonacci retracement of the $0.00812-$0.00425 downswing, at $0.00707, aligns with the 200-day EMA resistance, where a confirmed breakout could extend the rally toward $0.00812.
Momentum remains strong, with the RSI hovering in overbought territory near 75 and the MACD turning positive, suggesting that upside pressure persists.
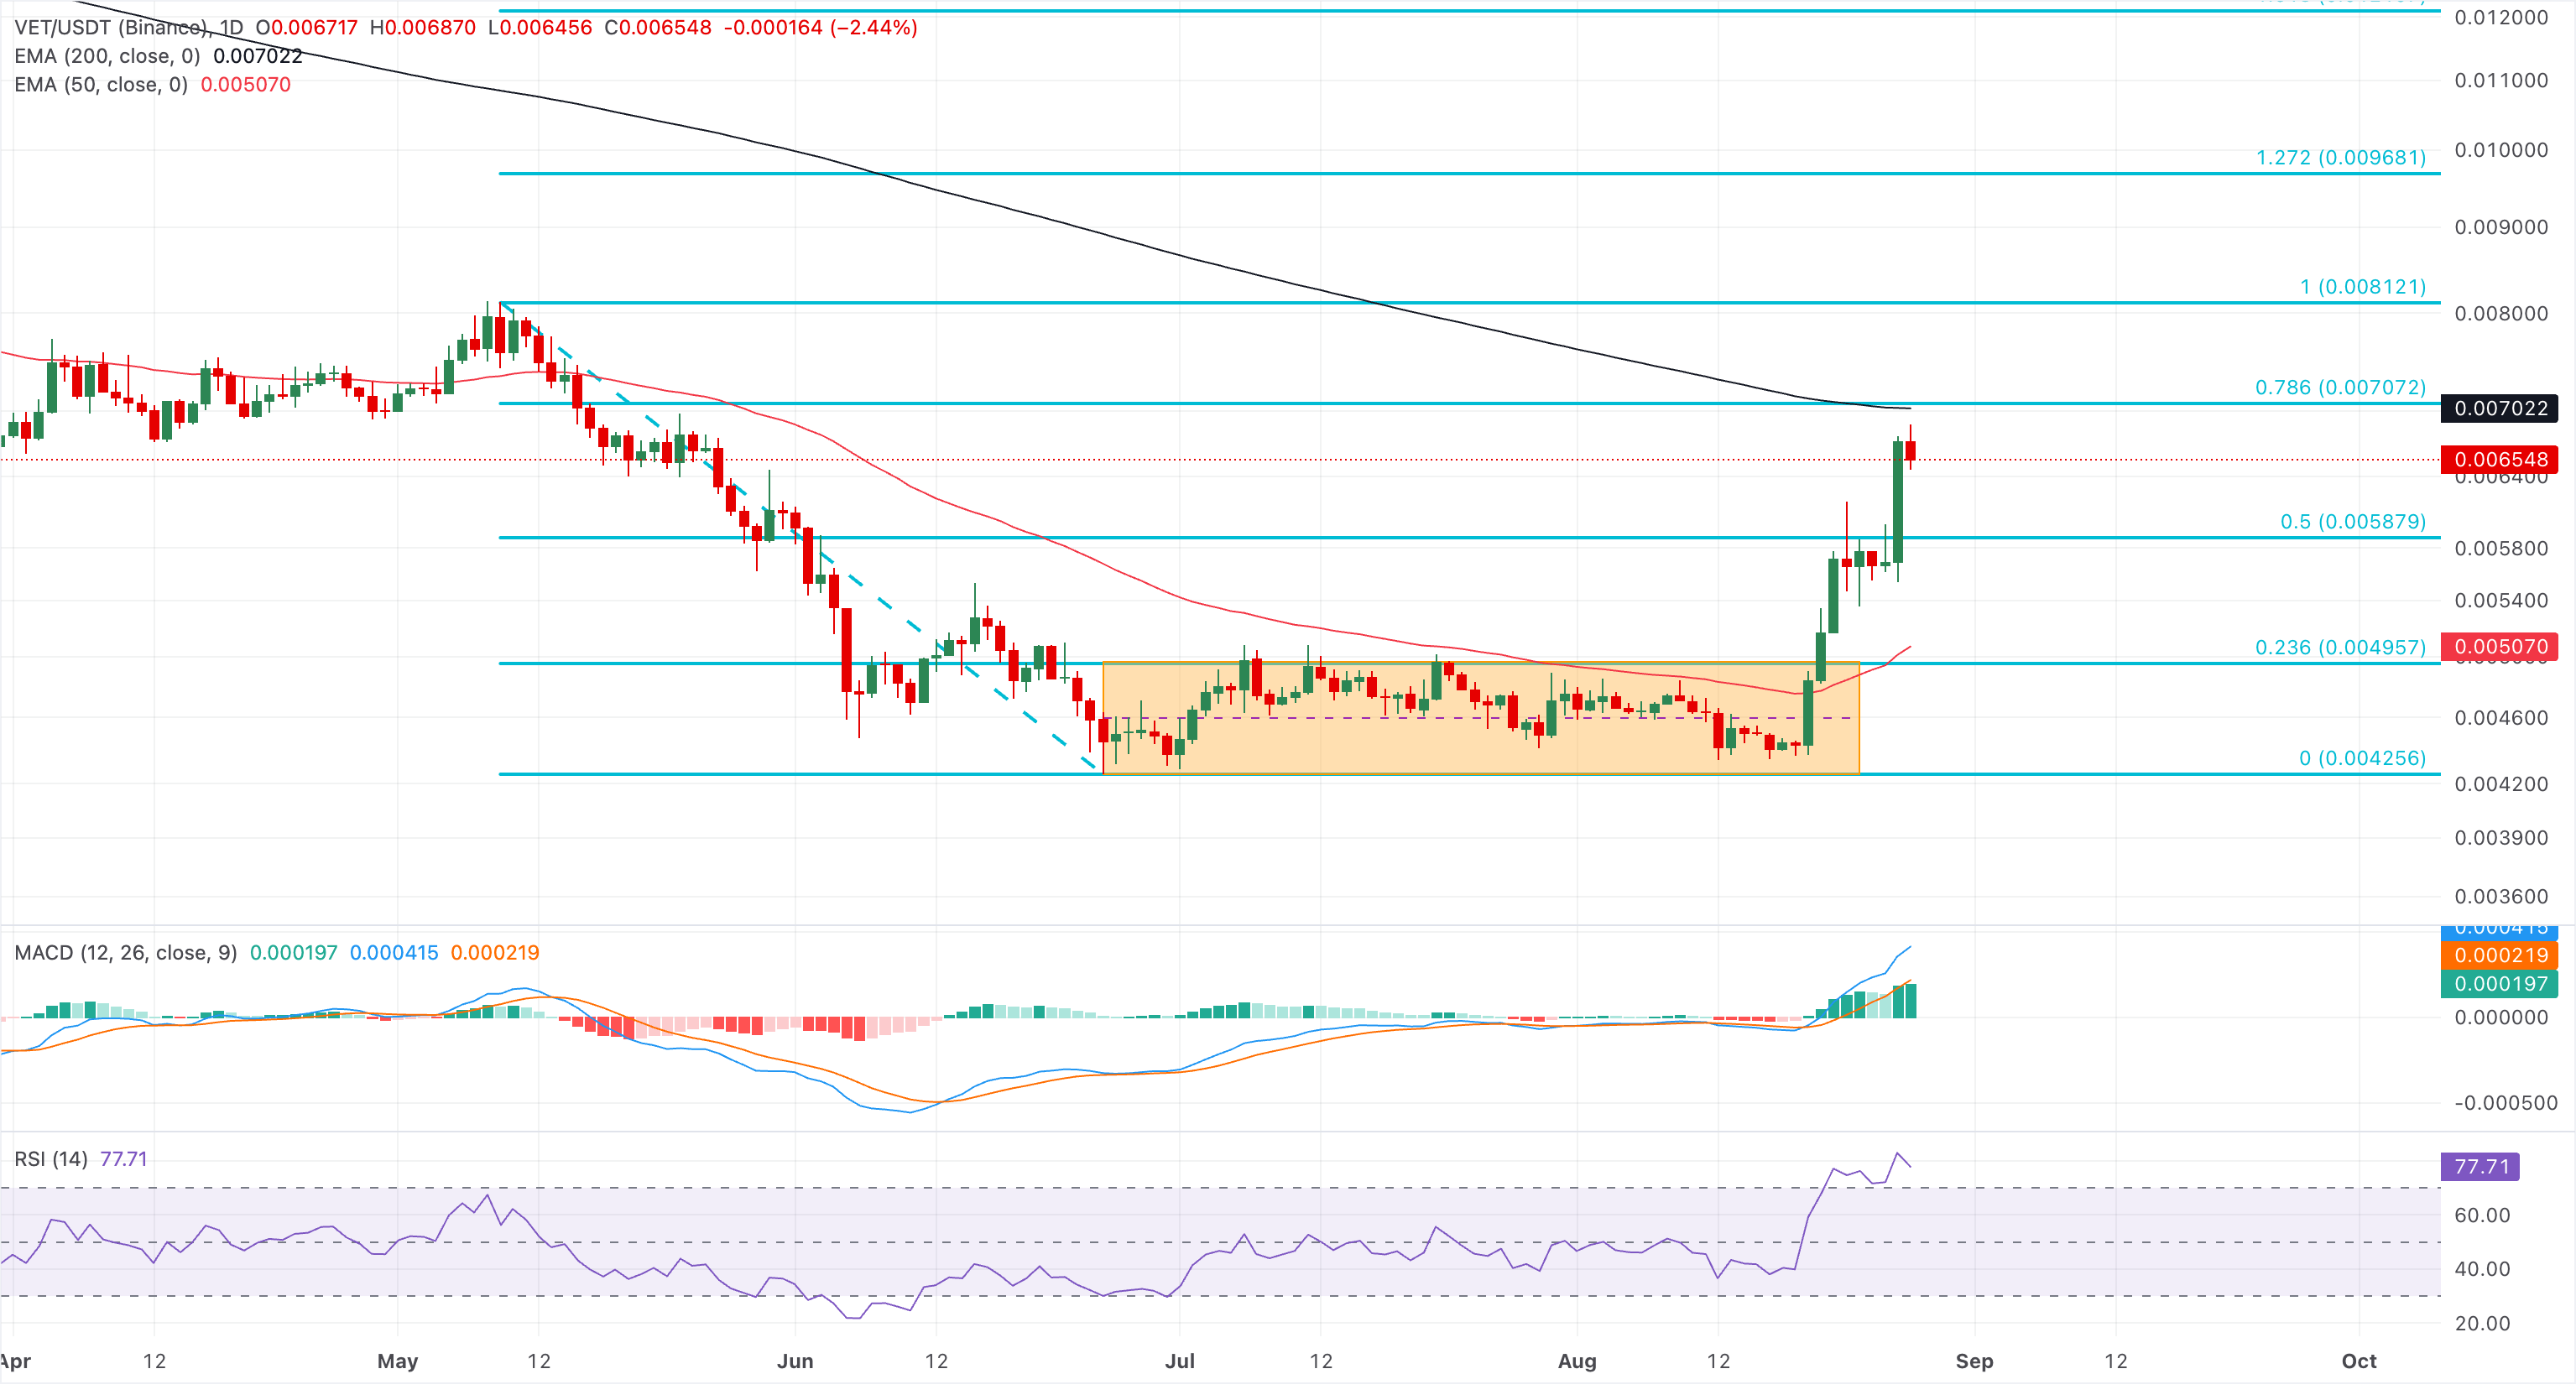
On the downside, initial support is seen at the 50% retracement at $0.00587, with deeper demand clustered around the 50-day EMA at $0.00507 and the 23.6% Fibonacci retracement level at $0.00495.
(The technical analysis of this story was written with the help of an AI tool. Know more.)
추천 기사


