


Bitcoin vs Gold Price Prediction: Rally cools as US PCE inflation holds steady
- Bitcoin slides and holds $78,000 as profit-taking and declining retail interest weigh.
- Gold retests short-term support at $4,600 amid a capped upside.
- US core PCE remains unchanged at 3.3% annually in July as expected.
Bitcoin (BTC) is edging lower, trading slightly above $78,000 on Wednesday. This correction comes after last week’s rally and the subsequent rejection around $81,000. The decline reflects cooling sentiment amid overheated market conditions and increased profit-taking.
Gold (XAU/USD) is also retracing, testing support at $4,600 as investors weigh the implications of recent United States (US) inflation data.
Bitcoin and Gold react to US PCE inflation data
Annual US inflation, as measured by the Personal Consumption Expenditures (PCE) Price Index, held steady at 3.7% YoY in July, according to data released Wednesday by the Bureau of Economic Analysis (BEA).
The figure exceeded market expectations of 3.6%. Meanwhile, the core PCE Price Index, which strips out volatile food and energy components, remained unchanged at 3.3%, in line with forecasts.
On a monthly basis, both headline and core PCE rose 0.2%. Additional data showed Personal Income rose 0.4% MoM, outpacing the market consensus of 0.3%, while Personal Spending advanced 0.2%.
Investors evaluate the US PCE data to gain insight into the Federal Reserve’s (Fed) monetary policy. Market attention now turns to Friday’s Jackson Hole central bankers’ symposium, where Fed Chairman Kevin Warsh is anticipated to offer a fresh perspective on the Fed’s near-term policy outlook, even as he continues to maintain a cautious stance on forward guidance.
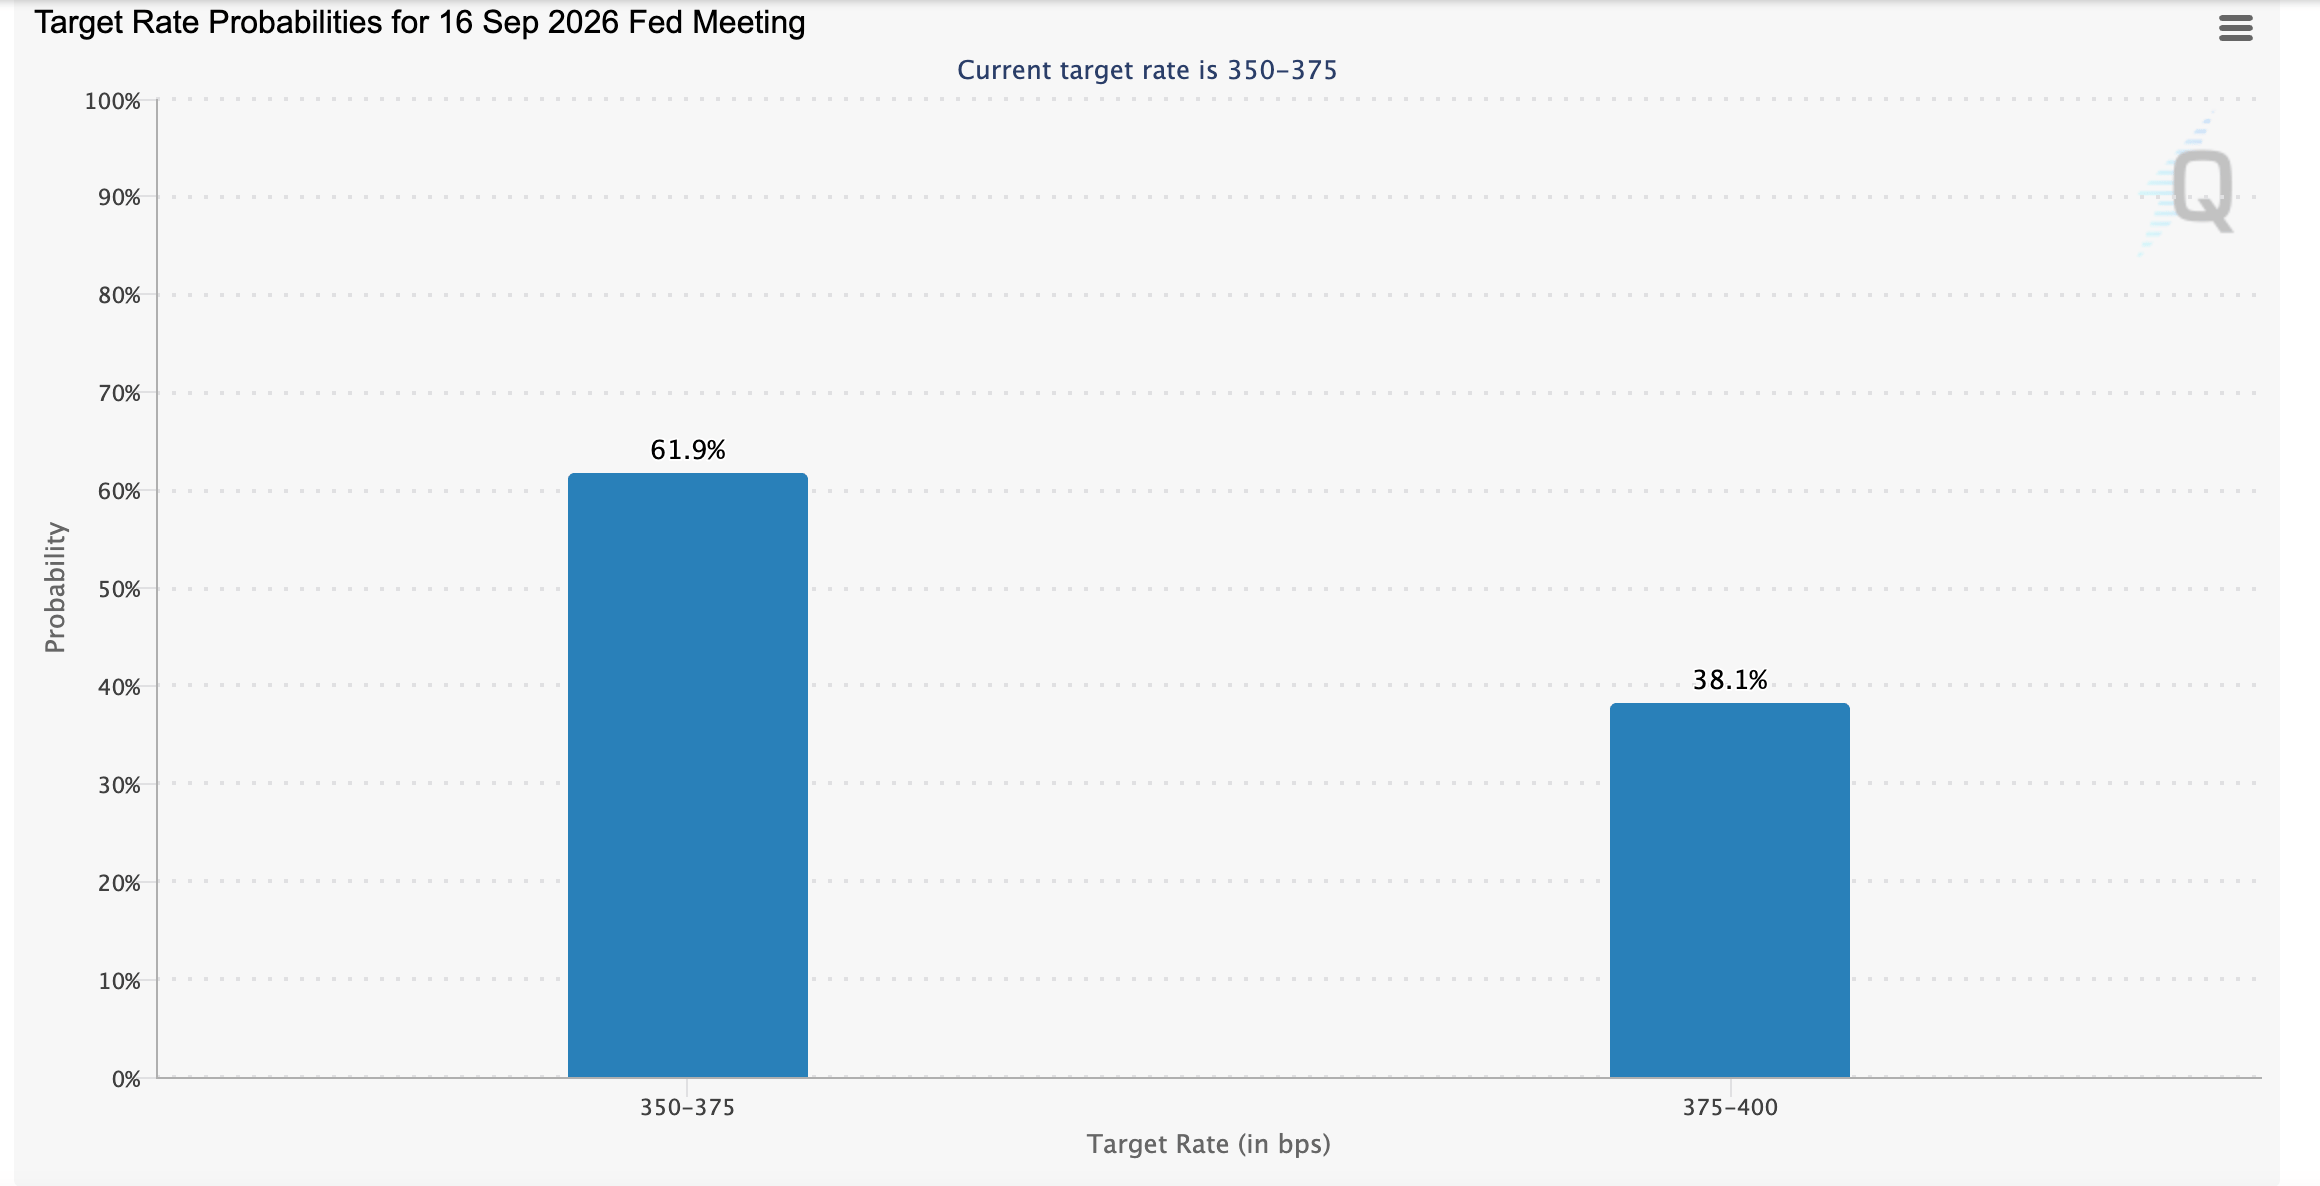
Rate hike expectations for September continue to fade, with futures markets now assigning just a 38% probability of a 25 basis-point move in the next review cycle, down sharply from 55% a month prior, according to CME FedWatch Tool data.
As for Bitcoin, retail demand fell to roughly 703,000 BTC on Wednesday, down from about 712,000 BTC the day before. This follows a gradual rise to 762,000 BTC on August 18, undermining retail participation.
Bitcoin's rejection at $81,000 and drop below $80,000 are likely weighing on the outlook as long positions are forcibly unwound. Downside risks could increase if it trades persistently below the critical $80,000 level.
Technical analysis: Bitcoin trims gains as headwinds intensify
Bitcoin trades marginally above $78,000, extending its correction after the rejection around $81,000. Still, the Crypto King maintains a bullish near-term bias as price holds well above the 50-day, 100-day and 200-day Moving Average Exponentials (EMAs).
The break and sustained advance above the descending resistance trendline, with a break price near $68,125, reinforces the constructive structure. At the same time, the Moving Average Convergence Divergence (MACD) remains firmly positive and the Relative Strength Index (RSI) hovers in overbought territory at 78, hinting at strong but stretched upside momentum.
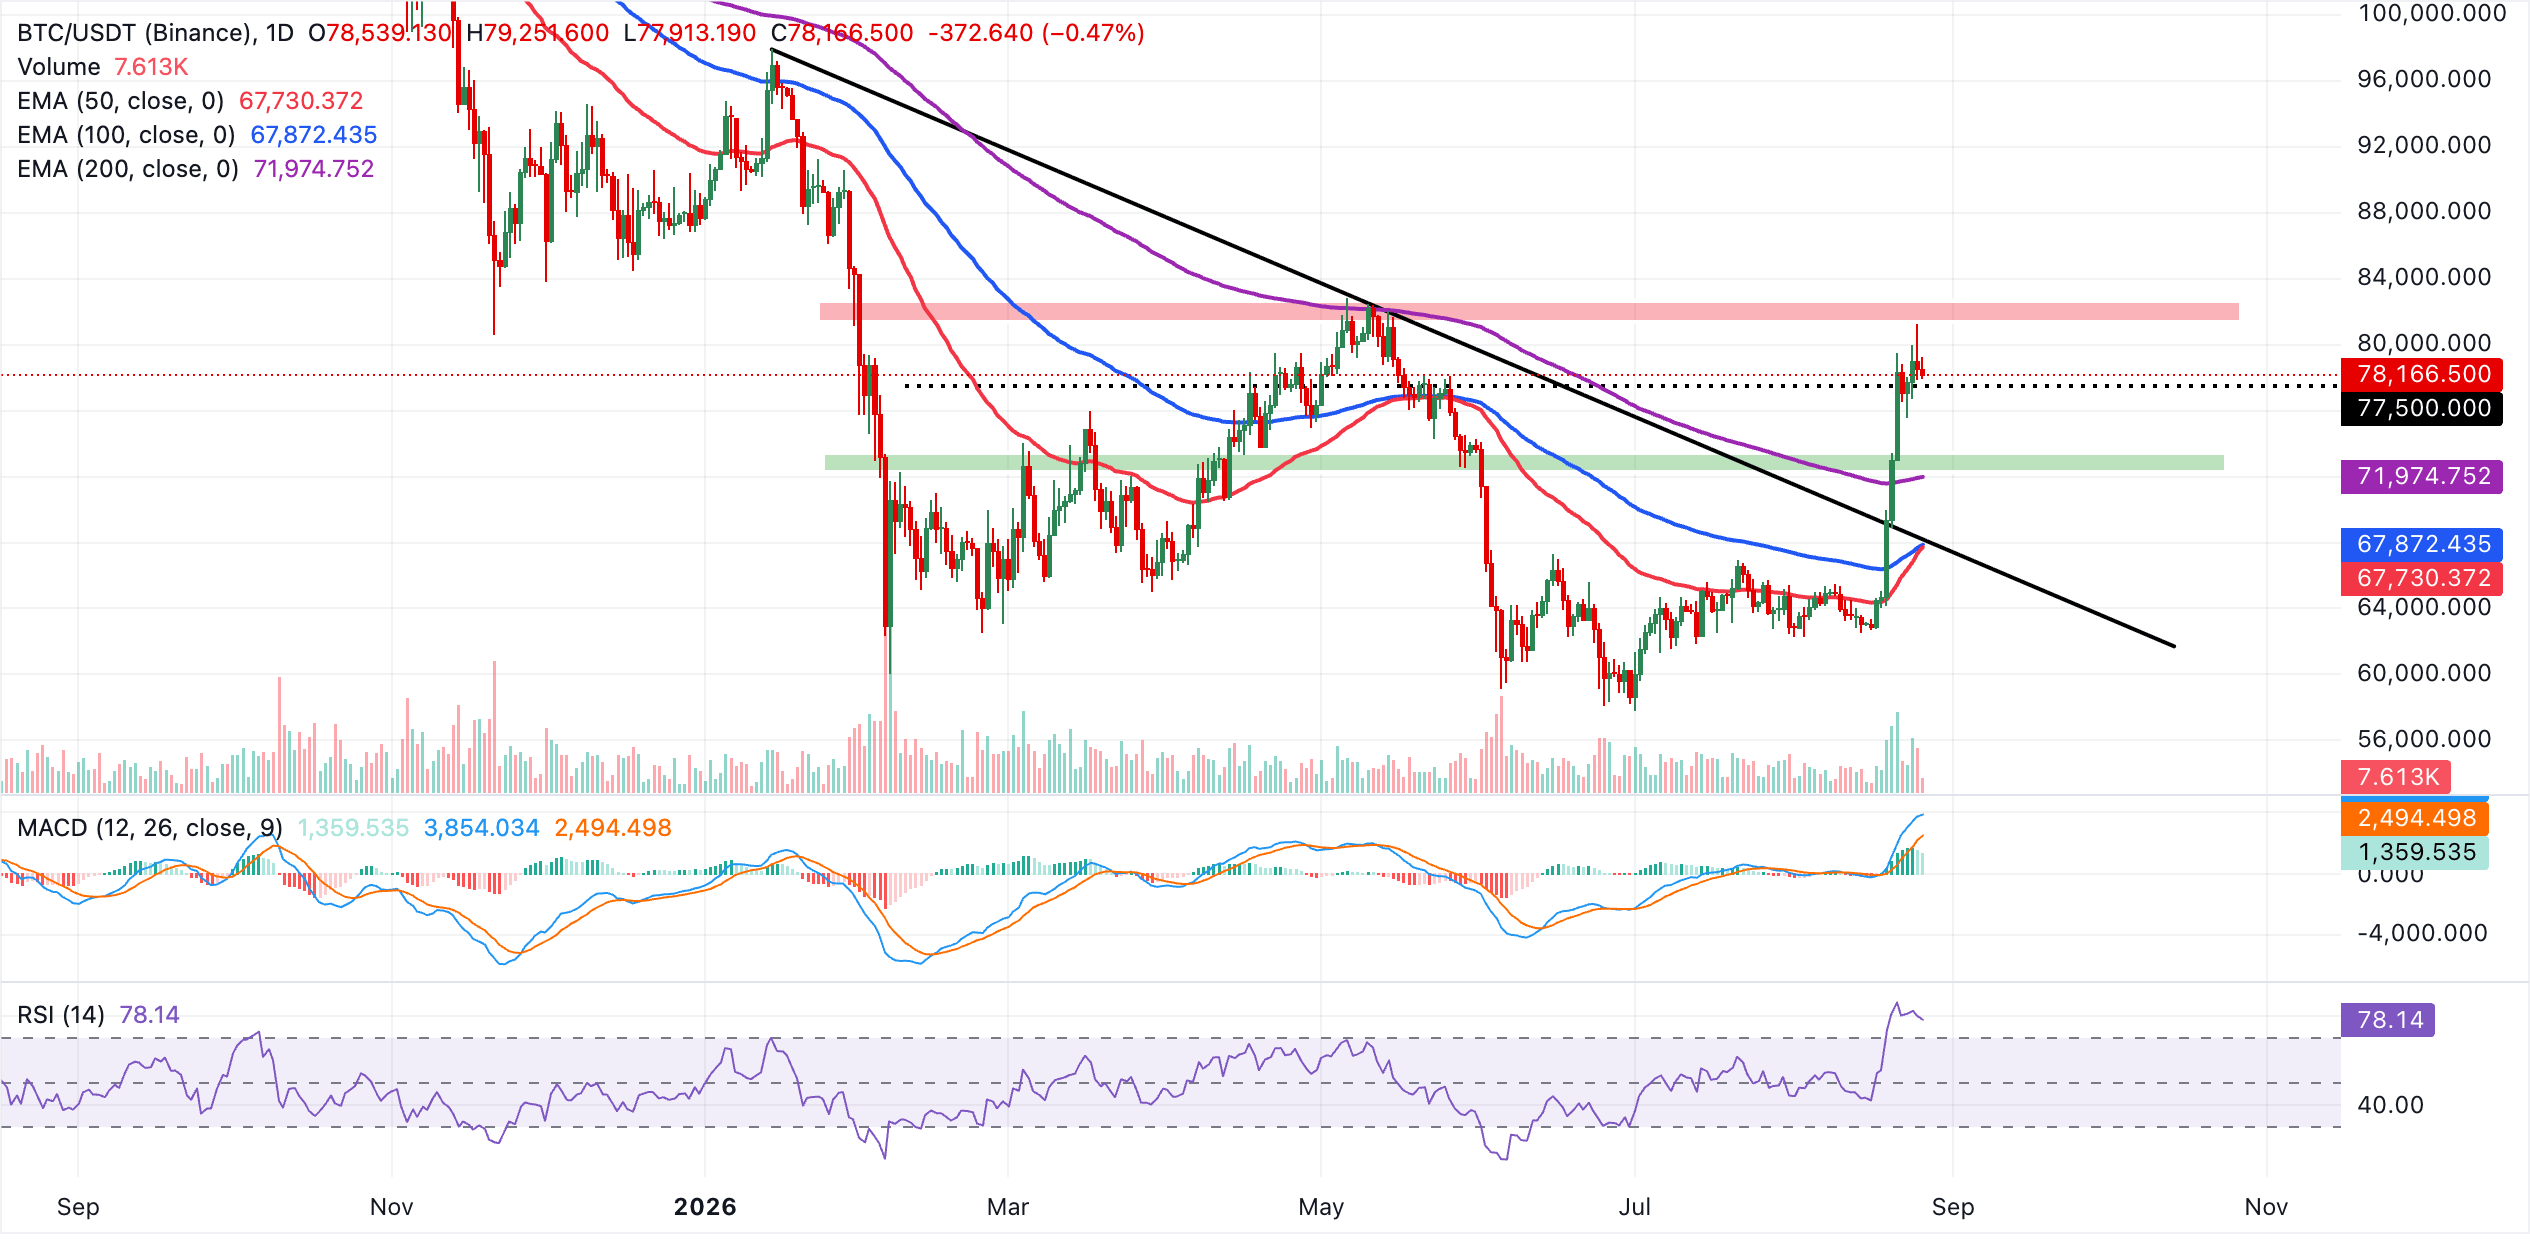
Initial support appears around the $71,975 area, where the 200-day EMA now underpins the broader uptrend, ahead of a dense demand cluster between roughly $68,100 and $67,700 defined by the reclaimed trendline break level, the 100-day EMA and the 50-day EMA.
As long as BTC holds above this stacked support zone, pullbacks would likely be treated as corrective within the prevailing advance, while any decisive daily close below $68,000 would weaken the bullish structure and open room for a deeper retracement.
Gold technical outlook: XAU stalls as higher support holds
XAU/USD trades at $4,628, extending its advance well above the main moving averages in the last few days, hinting at a firmly supported bullish backdrop, while the RSI has eased from overbought levels at 69, suggesting strong but slightly cooling upside momentum.
The MACD indicator remains in positive territory with a still-elevated histogram, reinforcing the idea that buyers retain control as long as price holds above the reclaimed EMA floor.
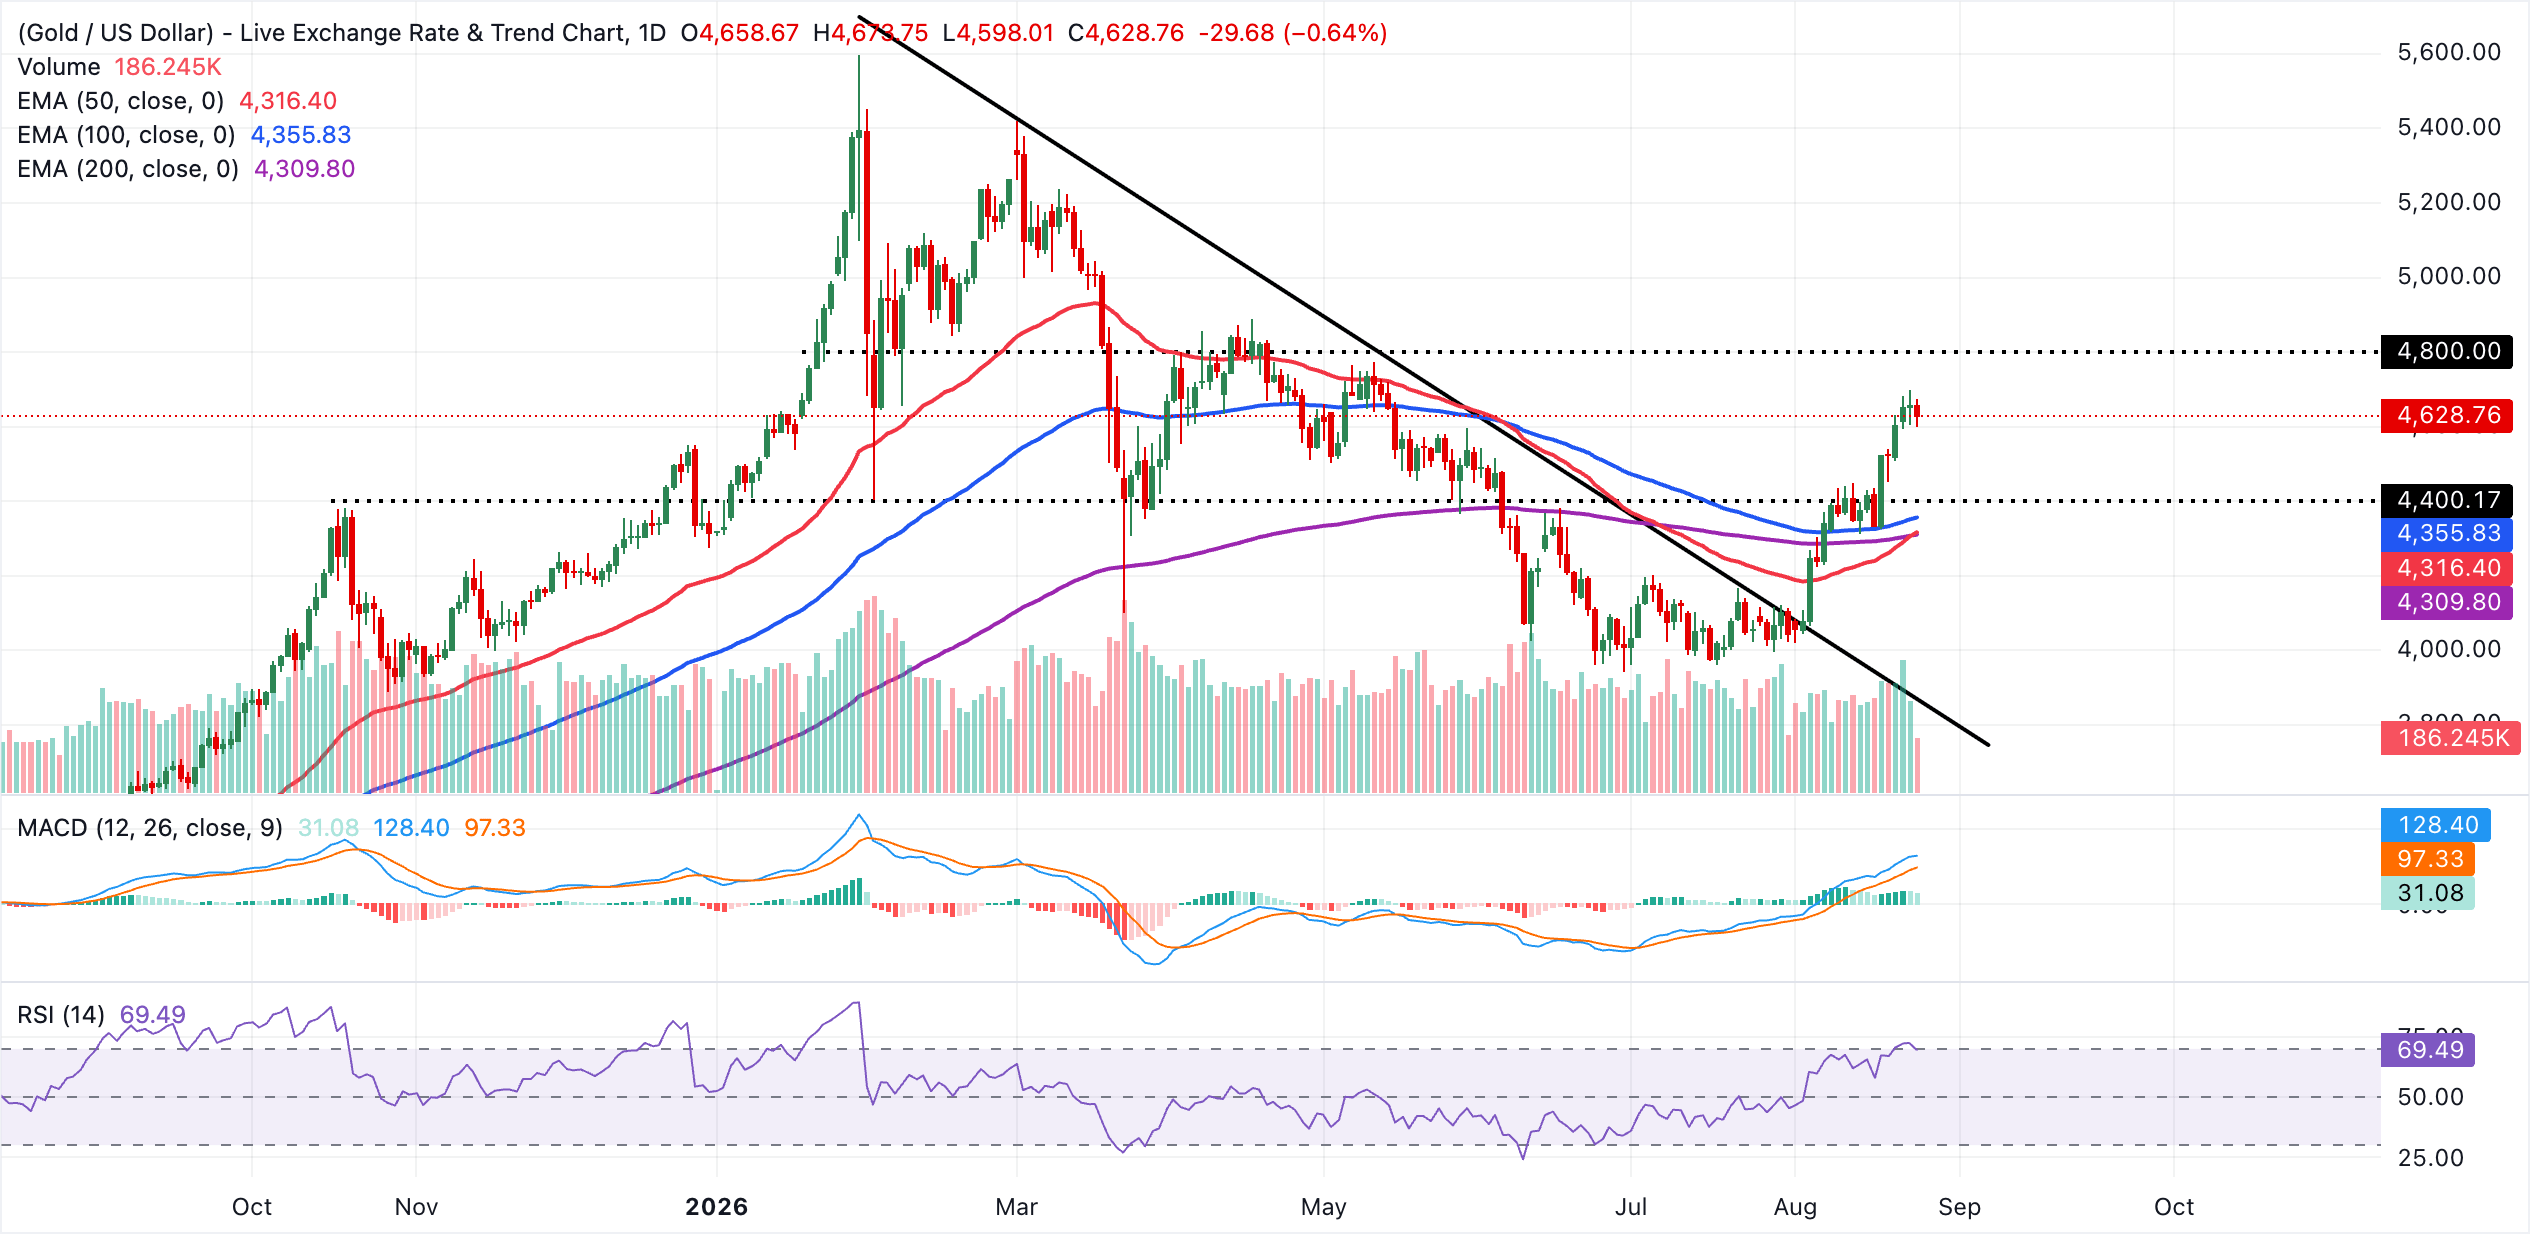
Initial support lies at the 100-day EMA near $4,356, with further underlying demand expected at the 50-day EMA at $4,316 and the longer-term 200-day EMA around $4,310, forming a dense cluster that could attract dip-buying if a corrective pullback unfolds.
On the topside, the key focus remains on psychological levels, including the August peak of $4,697 and the round figure at $4,800. A sustained daily close above the first higher pivot at $4,697 would open the door to a fresh leg up, while failure to clear it decisively would signal consolidation or a modest pause within the broader bullish trend.
(The technical analysis of this story was written with the help of an AI tool. Know more.)
Bitcoin, altcoins, stablecoins FAQs
Bitcoin is the largest cryptocurrency by market capitalization, a virtual currency designed to serve as money. This form of payment cannot be controlled by any one person, group, or entity, which eliminates the need for third-party participation during financial transactions.
Altcoins are any cryptocurrency apart from Bitcoin, but some also regard Ethereum as a non-altcoin because it is from these two cryptocurrencies that forking happens. If this is true, then Litecoin is the first altcoin, forked from the Bitcoin protocol and, therefore, an “improved” version of it.
Stablecoins are cryptocurrencies designed to have a stable price, with their value backed by a reserve of the asset it represents. To achieve this, the value of any one stablecoin is pegged to a commodity or financial instrument, such as the US Dollar (USD), with its supply regulated by an algorithm or demand. The main goal of stablecoins is to provide an on/off-ramp for investors willing to trade and invest in cryptocurrencies. Stablecoins also allow investors to store value since cryptocurrencies, in general, are subject to volatility.
Bitcoin dominance is the ratio of Bitcoin's market capitalization to the total market capitalization of all cryptocurrencies combined. It provides a clear picture of Bitcoin’s interest among investors. A high BTC dominance typically happens before and during a bull run, in which investors resort to investing in relatively stable and high market capitalization cryptocurrency like Bitcoin. A drop in BTC dominance usually means that investors are moving their capital and/or profits to altcoins in a quest for higher returns, which usually triggers an explosion of altcoin rallies.
추천 기사


