


Dow Jones Industrial Average ignores a revision made of inflation
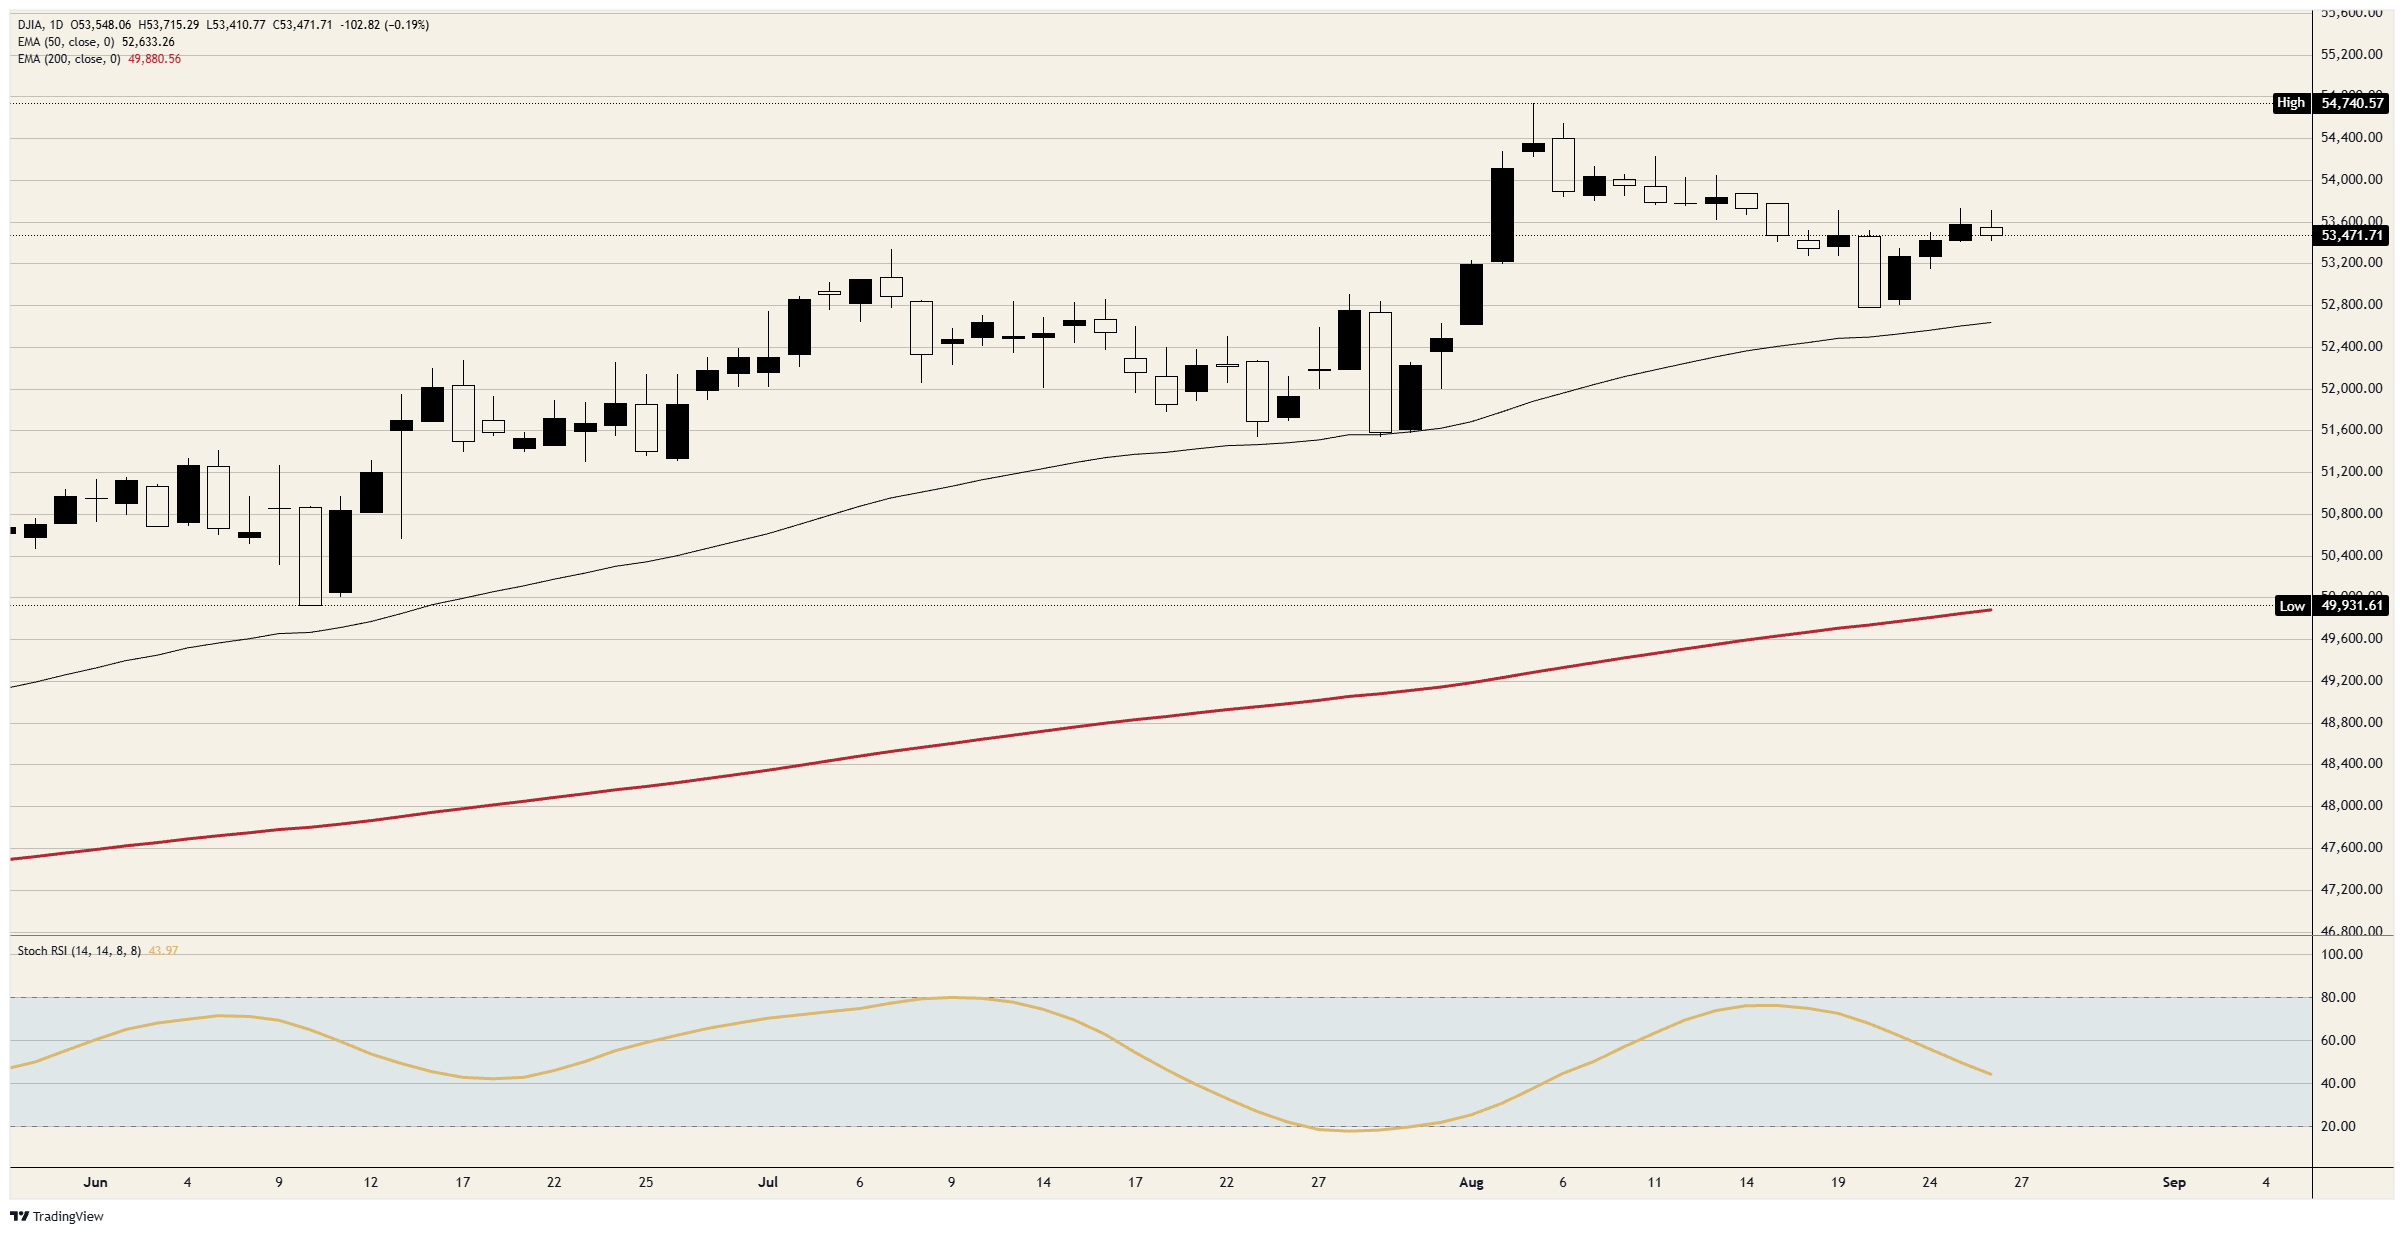
- DJIA holds just beneath 53,500, roughly 2.3% under the August record.
- Every second-quarter price line revised up, real growth left at 1.5%.
- July real consumer spending flat: nominal 0.2% against PCE prices 0.2%.
The Dow Jones Industrial Average trades a shade beneath 53,500 and roughly 100 points lower on the session, after a 12:30 GMT data drop the wires filed as uneventful. July core Personal Consumption Expenditures (PCE) prices rose 0.2% on the month and 3.3% over the year, both in line with consensus, and that is the figure rate expectations key off. The revisions to the second quarter printed at the same minute on the same page, and none of those were in line.
The quarter got dearer without getting bigger
The second estimate of second-quarter Gross Domestic Product (GDP) left real output exactly where the advance reading put it at the end of July, at an annualised 1.5%. Every price measure attached to that output moved higher. The GDP price index went to 6.4% from 6.3%, quarterly headline PCE prices to 5.3% from 5.1%, and quarterly core PCE prices to 3.7% from 3.4%, with all three above a consensus that expected no revision at all.
The reading is not ambiguous, because the statisticians found no additional output in the quarter and found that the output already counted cost more than first estimated. The whole revision landed in the deflator. A 0.3pp upward move in quarterly core prices is a bigger number than the monthly core print the market spent the morning parsing, and it drew no coverage whatsoever.
This is the second time in a month that the quarterly price data carried the surprise while the monthly data carried the headlines. The advance estimate on July 30 put the GDP price index at 6.3% against a 3.6% consensus, easily the largest miss on that release page, and the tape traded the in-line monthly core instead. The same figure has now been revised higher and drawn the same shrug.
Income arrived and the spending did not
The household side of the release is where the price revision stops being an accounting curiosity. Personal income rose 0.4% in July against a 0.3% consensus, personal spending rose 0.2% in line, and the monthly PCE price index also rose 0.2%. Nominal spending grew by precisely the amount prices grew, which leaves real consumer spending flat on the month.
Income beating spending by two tenths, with prices absorbing all of the spending that did occur, means households banked the difference rather than consuming it. That is not the behaviour of a consumer comfortable about the second half, and it follows a preliminary August sentiment reading that gave back two months of improvement in a single print.
Durable goods orders looked strong at 1.1% against a 0.7% consensus until the transportation line comes out, at which point the reading drops to 0.4% and misses. The cleaner capital-spending gauge is worse, with nondefense capital goods orders excluding aircraft slowing to 0.2% in July from 1.2% in June.
Business investment strength was the evidence the Fed chair reached for at the July press conference when defending the current stance, and a full percentage point of deceleration in the core orders book is the first crack in it. Prices revised up, real spending flat and capital orders slowing is a stagflationary combination, and the market has priced it as benign.
Two events the index has not seen yet
None of that is what the index is actually trading, because the two events that decide this week both sit off the economic calendar. Nvidia (NVDA) reports after the bell with consensus at $2.09 a share on revenue near $92.28 billion, and the number will be read as a verdict on the artificial intelligence capital cycle rather than as one component's quarter. As a card-carrying member of the Dow Jones Industrial Average, .
Friday brings Fed Chair Warsh's first keynote at the annual Jackson Hole symposium. The published theme is financial innovation and payments, which constrains the academic papers rather than the keynote, and desks have spent the week arguing over whether a chair who has stripped forward guidance from the statement, skipped the July projections, and floated fewer meetings per year will use twenty minutes in August to say anything about September.
The long end has been the market's actual decision-maker for a month and offers no comfort into either event. The thirty-year rate printed its highest in nearly two decades last week and sat at 5.23% on the Federal Reserve constant maturity series on Monday, easing only marginally from there. An index within roughly 2.3% of a record while thirty-year money costs more than at any point since before the financial crisis is the same unresolved trade it has been all month.
Levels and bias
Resistance: The session high in the 53,700 area is the first line and it has already turned the tape back once today. Above it the 53,800 cap that has held since mid-August is the level that matters, with the early-August ledge near 54,100 and the record just short of 54,750 beyond that.
Support: The session low just above 53,400 is the immediate floor, with the 53,200 area beneath it as the first real shelf. Below those the 53,000 handle opens and the 52,800 area that marked last week's low becomes the objective a genuine failure carries, with the 50-day Exponential Moving Average (EMA) near 52,600 underneath.
Bias: Bearish while the 53,800 area caps, because four sessions bought back roughly 600 points off last week's low and the fifth has stalled beneath the 53,700 area with the daily Stochastic Relative Strength Index (Stoch RSI) near 44 and turning down out of the upper band. That is a recovery losing its author rather than a base being built. Objectives are the 53,200 area then the 53,000 handle, and invalidation comes on a daily close above 53,800.
Dow Jones daily chart
Dow Jones FAQs
The Dow Jones Industrial Average, one of the oldest stock market indices in the world, is compiled of the 30 most traded stocks in the US. The index is price-weighted rather than weighted by capitalization. It is calculated by summing the prices of the constituent stocks and dividing them by a factor, currently 0.152. The index was founded by Charles Dow, who also founded the Wall Street Journal. In later years it has been criticized for not being broadly representative enough because it only tracks 30 conglomerates, unlike broader indices such as the S&P 500.
Many different factors drive the Dow Jones Industrial Average (DJIA). The aggregate performance of the component companies revealed in quarterly company earnings reports is the main one. US and global macroeconomic data also contributes as it impacts on investor sentiment. The level of interest rates, set by the Federal Reserve (Fed), also influences the DJIA as it affects the cost of credit, on which many corporations are heavily reliant. Therefore, inflation can be a major driver as well as other metrics which impact the Fed decisions.
Dow Theory is a method for identifying the primary trend of the stock market developed by Charles Dow. A key step is to compare the direction of the Dow Jones Industrial Average (DJIA) and the Dow Jones Transportation Average (DJTA) and only follow trends where both are moving in the same direction. Volume is a confirmatory criteria. The theory uses elements of peak and trough analysis. Dow’s theory posits three trend phases: accumulation, when smart money starts buying or selling; public participation, when the wider public joins in; and distribution, when the smart money exits.
There are a number of ways to trade the DJIA. One is to use ETFs which allow investors to trade the DJIA as a single security, rather than having to buy shares in all 30 constituent companies. A leading example is the SPDR Dow Jones Industrial Average ETF (DIA). DJIA futures contracts enable traders to speculate on the future value of the index and Options provide the right, but not the obligation, to buy or sell the index at a predetermined price in the future. Mutual funds enable investors to buy a share of a diversified portfolio of DJIA stocks thus providing exposure to the overall index.
추천 기사


