


Bitcoin Price Forecast: BTC retreats as ETF outflows, US‑Iran stalemate revive inflation worries
- Bitcoin trades below $64,000 on Tuesday after falling 1.44% the previous day.
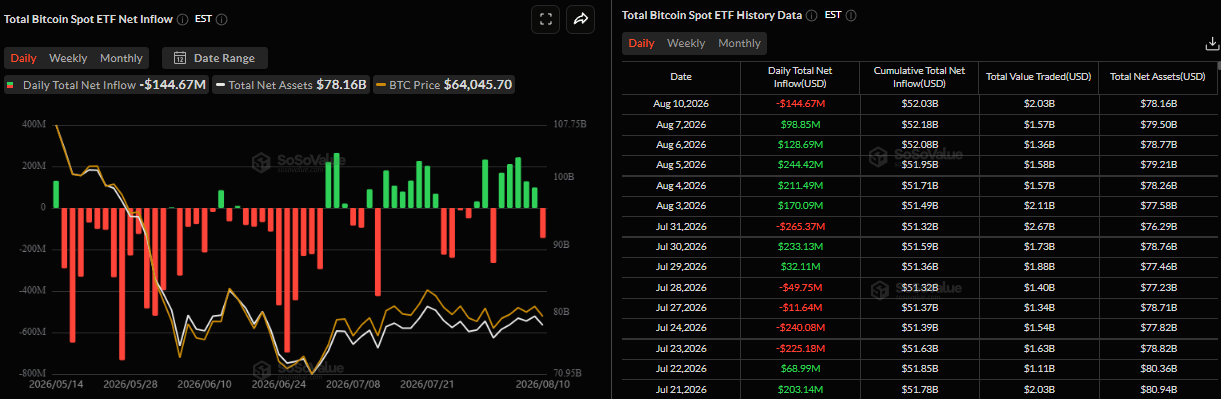
- US-listed spot ETF recorded an outflow of $144.67 million on Monday, snapping a five-day inflow streak.
- Rising Oil prices amid the US-Iran stalemate are reviving inflation concerns, dampening risk appetite.
Bitcoin (BTC) struggles below $64,000 at the time of writing on Tuesday as rising Oil prices and uncertainty surrounding the US-Iran stalemate weigh on risk sentiment. Weakening institutional demand supports the pullback, as spot BTC Exchange-Traded Funds (ETFs) recorded outflows at the start of the week on Monday, adding near-term pressure on the Crypto King and keeping investors cautious.
US-Iran deadlock raises inflation risks
US President Donald Trump responded with his own demands on Monday to Iran's conditions for a peace deal, calling for Iran to pay compensation for those killed in wars, attacks and protests, in a rhetorical escalation likely to complicate efforts to reopen the crucial waterway, reported Reuters.
The US-Iran negotiations reaching an impasse over a potential peace deal and the reopening of the Strait of Hormuz have heightened geopolitical uncertainty, pushing Oil prices higher, while pressuring risky assets such as BTC.
These higher Oil prices could reignite inflationary pressures and push the Federal Reserve (Fed) toward a more hawkish stance.
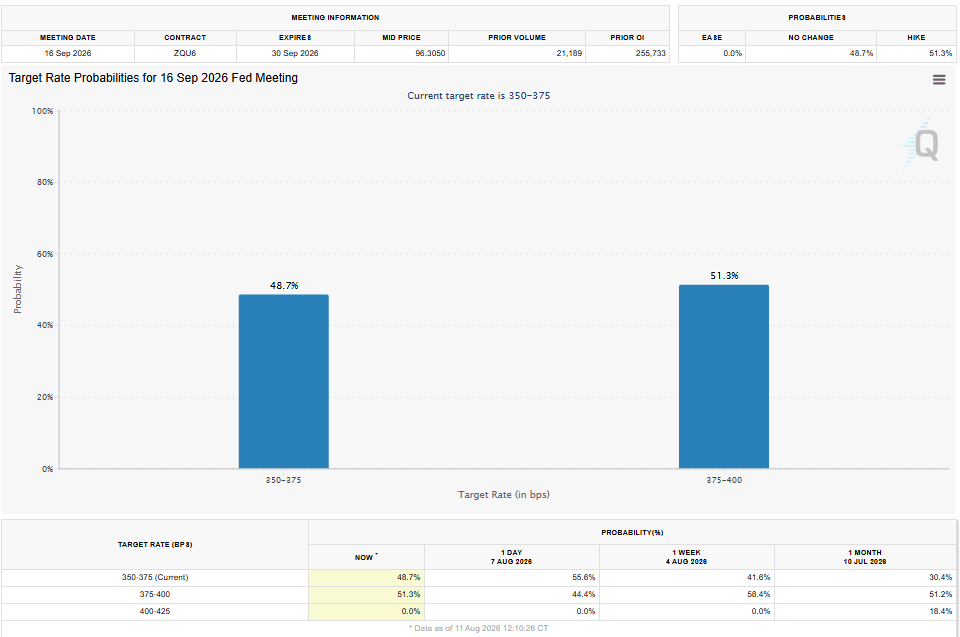
According to the CME FedWatch Tool, market participants are currently pricing in a 51.3% probability of a 25 basis point (bps) Fed rate hike in September, up from 44.1% on Friday.
ETF outflows resume as investor sentiment weakens
Institutional demand started the week on a negative note. SoSoValue data shows that Bitcoin spot EFTs recorded an outflow of $144.67 million on Monday, snapping a five-day inflow streak. If these outflows continue and intensify throughout the week, BTC could see further price correction.
Bitcoin technical outlook: Momentum indicators show early bearish signs
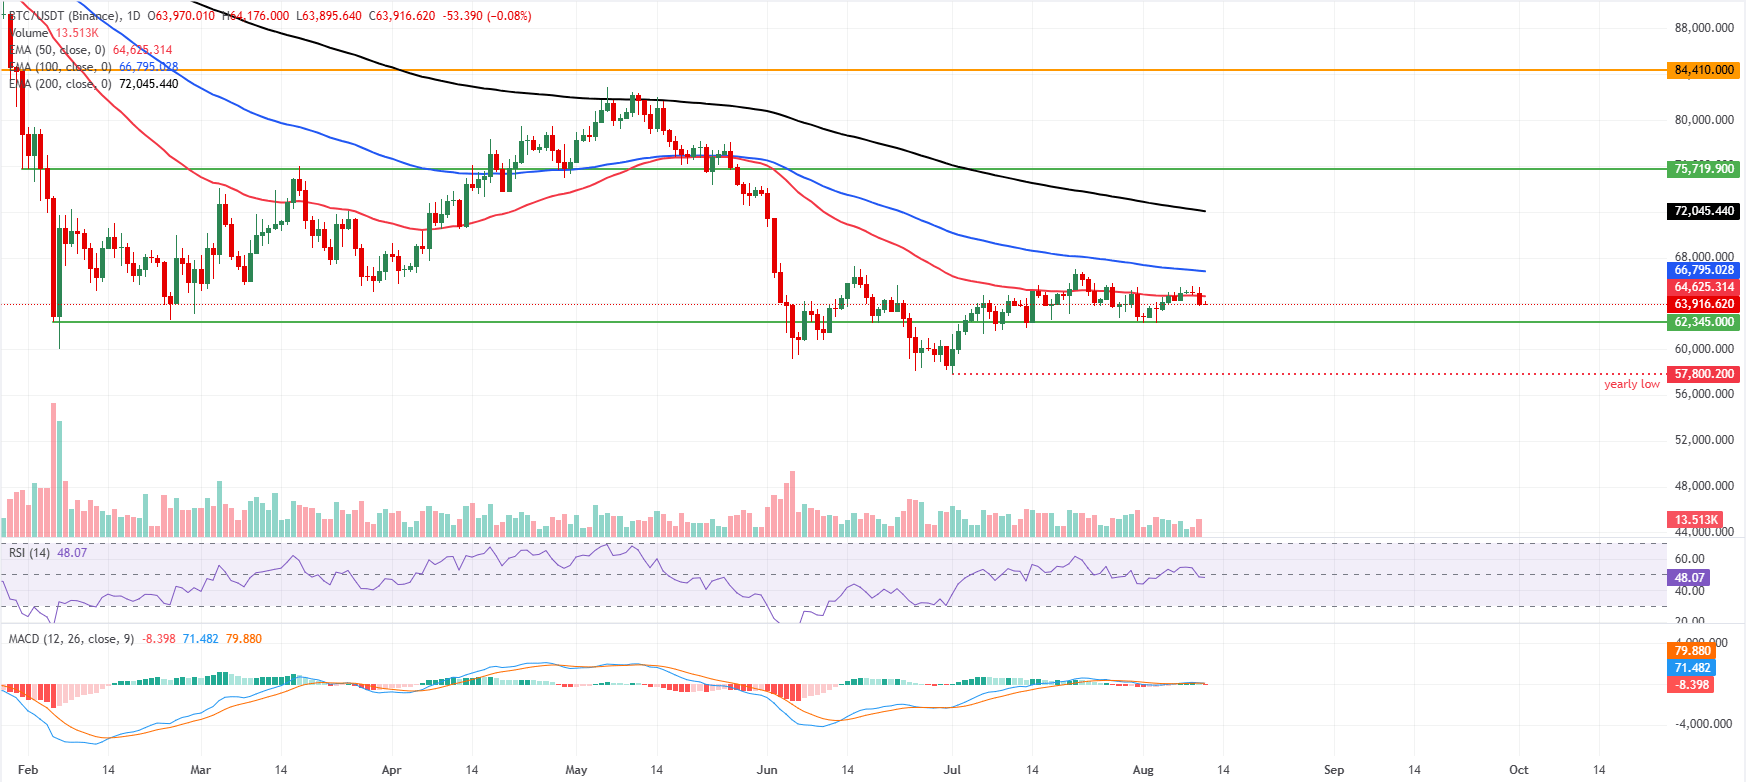
Bitcoin price trades at $63,916 at the time of writing on Tuesday, after slipping 1.44% in the previous day, and retaining a bearish near-term bias as it holds beneath a dense pack of Exponential Moving Averages (EMAs). The 50-day EMA at $64,625 is the first cap overhead, followed by the 100-day EMA at $66,795 and the 200-day EMA at $72,045, all reinforcing a topside-heavy structure.
Momentum is lackluster on the daily chart, with the Relative Strength Index (RSI) hovering near a neutral 48 and the Moving Average Convergence Divergence (MACD) line slightly below zero and close to its signal, hinting at a weak, directionless push rather than a decisive reversal.
On the topside, immediate resistance is located at the 50-day EMA around $64,625, ahead of the 100-day EMA near $66,795 and the more medium-term barrier at the 200-day EMA around $72,045. A more distant structural ceiling emerges at the horizontal level of $75,719.
On the downside, immediate support is at the horizontal level of $62,345. A daily close below this latter area would trigger deeper correction toward the yearly low of $57,800 set on July 1.
(The technical analysis of this story was written with the help of an AI tool. Know more.)
Bitcoin, altcoins, stablecoins FAQs
Bitcoin is the largest cryptocurrency by market capitalization, a virtual currency designed to serve as money. This form of payment cannot be controlled by any one person, group, or entity, which eliminates the need for third-party participation during financial transactions.
Altcoins are any cryptocurrency apart from Bitcoin, but some also regard Ethereum as a non-altcoin because it is from these two cryptocurrencies that forking happens. If this is true, then Litecoin is the first altcoin, forked from the Bitcoin protocol and, therefore, an “improved” version of it.
Stablecoins are cryptocurrencies designed to have a stable price, with their value backed by a reserve of the asset it represents. To achieve this, the value of any one stablecoin is pegged to a commodity or financial instrument, such as the US Dollar (USD), with its supply regulated by an algorithm or demand. The main goal of stablecoins is to provide an on/off-ramp for investors willing to trade and invest in cryptocurrencies. Stablecoins also allow investors to store value since cryptocurrencies, in general, are subject to volatility.
Bitcoin dominance is the ratio of Bitcoin's market capitalization to the total market capitalization of all cryptocurrencies combined. It provides a clear picture of Bitcoin’s interest among investors. A high BTC dominance typically happens before and during a bull run, in which investors resort to investing in relatively stable and high market capitalization cryptocurrency like Bitcoin. A drop in BTC dominance usually means that investors are moving their capital and/or profits to altcoins in a quest for higher returns, which usually triggers an explosion of altcoin rallies.
추천 기사


