


Strategy sells another 1,690 BTC to fund STRC stock buybacks as Bitcoin holds steady
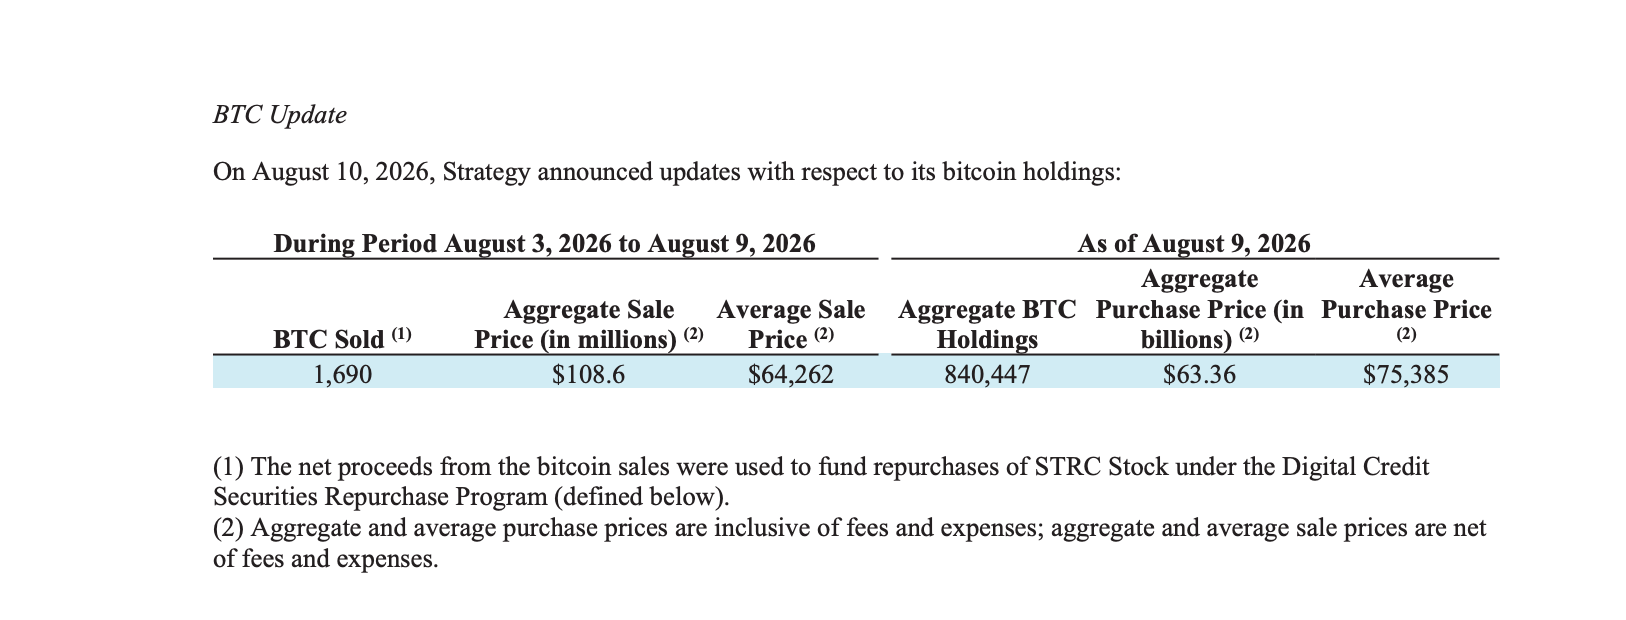
- Strategy has sold another 1,690 BTC valued at roughly $109 million to buy back STRC shares.
- The company also sold MSTR shares valued at $653 million, increasing US Dollar reserves to $4.65 billion.
- Strategy now holds 840,447 BTC acquired at an average cost of $75,385.
Strategy (MSTR) reported on Monday the sale of Bitcoin (BTC) worth roughly $109 million between August 3 and August 9, raising money for its STRC stock buybacks.
Strategy extends Bitcoin selling spree as prices stabilize
Strategy has announced that it sold 1,690 BTC worth approximately $109 million at an average sale price of $64,262. Proceeds from the BTC sales were strategically allocated to repurchase STRC stock as part of the Digital Credit Securities Repurchase Program.
The company also executed the sale of 6.59 million MSTR shares, generating $653.1 million in proceeds, of which $650 million was strategically used to boost its US Dollar (USD) reserves to $4.65 billion. This figure reflects expected cash proceeds from shares sold through Strategy’s at-the-market (ATM) program that were pending settlement as of the reporting date.
Strategy now holds 840,447 BTC, acquired at a total cost of $63.36 billion, with an average purchase price of $75,385 per Bitcoin. Despite the Bitcoin selling spree, Strategy still holds the crown as the largest corporate holder of Bitcoin.
Technical analysis: Bitcoin upholds a neutral-to-bullish bias
Bitcoin trades at $64,976, holding a neutral-to-slightly bullish tone as it sits above the 50-day Exponential Moving Average (EMA) near $64,694 while remaining capped well below the 100-day and 200-day EMAs at $66,879 and $72,364 respectively. This configuration suggests price is attempting to stabilize within an intermediate-range recovery, with the modestly positive Moving Average Convergence Divergence (MACD) histogram and a Relative Strength Index (RSI) around 55 hinting at a mild bullish bias rather than a decisive trend resumption.
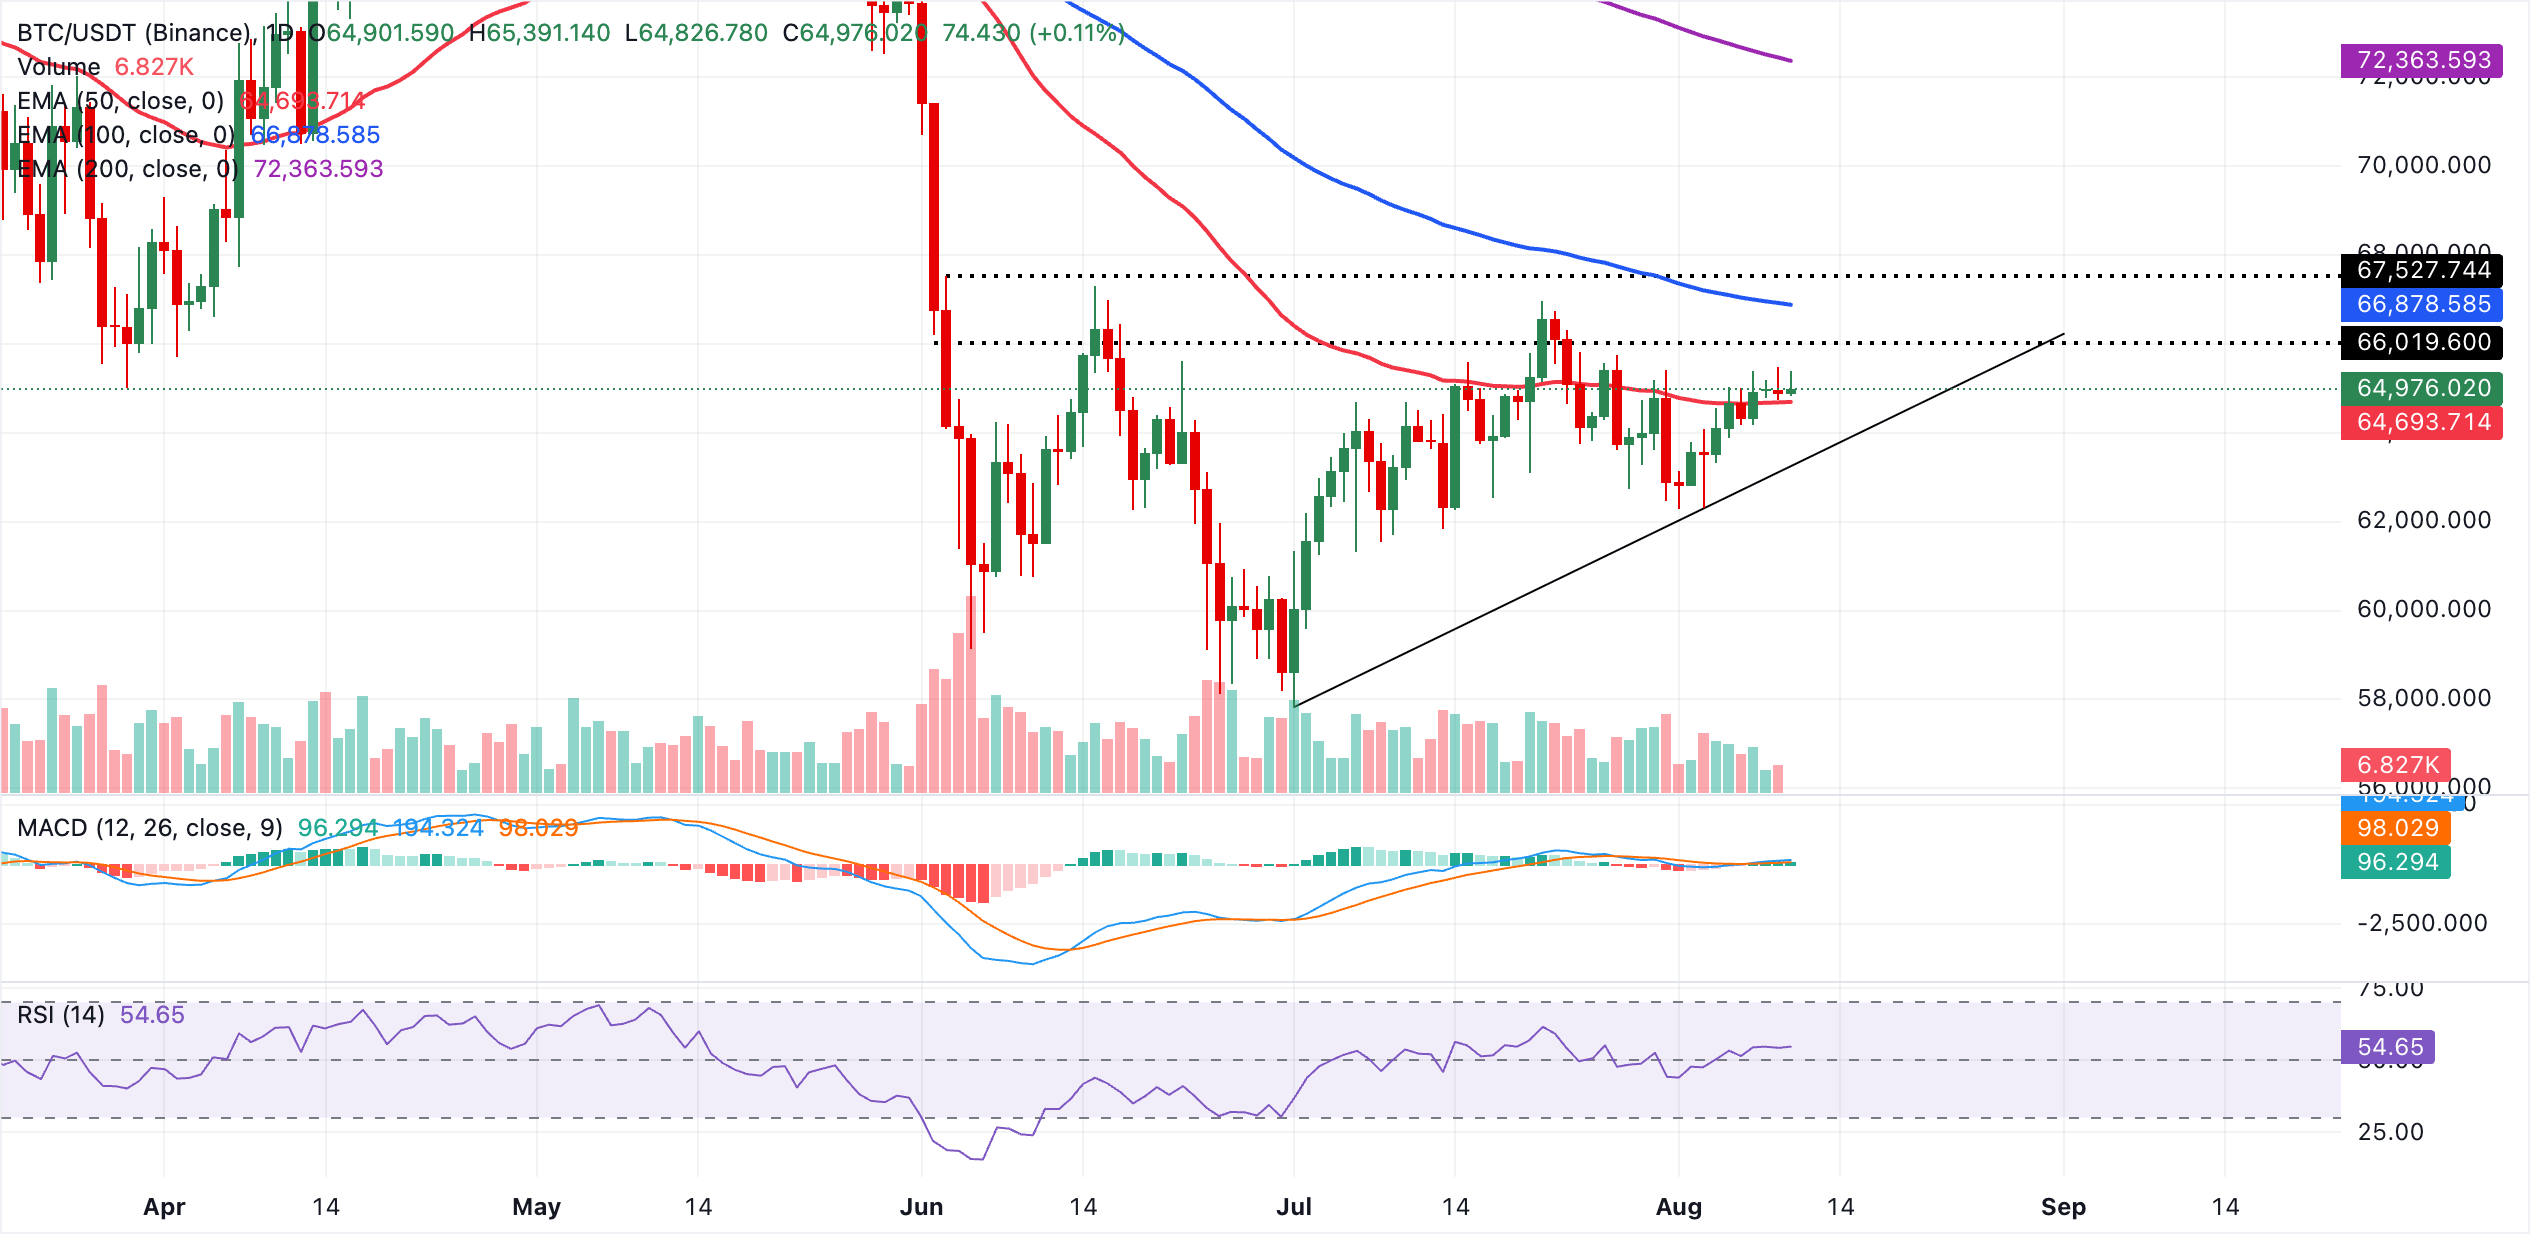
On the topside, initial resistance emerges at the 100-day EMA around $66,879, with a subsequent barrier at the 200-day EMA near $72,364, where any rejection would reinforce the broader capping structure. On the downside, immediate support lies at the 50-day EMA around $64,694, followed by the rising trendline support clustered near $63,318. A daily close below this latter level would expose a deeper correction within the broader consolidation phase.
(The technical analysis of this story was written with the help of an AI tool. Know more.)
Bitcoin, altcoins, stablecoins FAQs
Bitcoin is the largest cryptocurrency by market capitalization, a virtual currency designed to serve as money. This form of payment cannot be controlled by any one person, group, or entity, which eliminates the need for third-party participation during financial transactions.
Altcoins are any cryptocurrency apart from Bitcoin, but some also regard Ethereum as a non-altcoin because it is from these two cryptocurrencies that forking happens. If this is true, then Litecoin is the first altcoin, forked from the Bitcoin protocol and, therefore, an “improved” version of it.
Stablecoins are cryptocurrencies designed to have a stable price, with their value backed by a reserve of the asset it represents. To achieve this, the value of any one stablecoin is pegged to a commodity or financial instrument, such as the US Dollar (USD), with its supply regulated by an algorithm or demand. The main goal of stablecoins is to provide an on/off-ramp for investors willing to trade and invest in cryptocurrencies. Stablecoins also allow investors to store value since cryptocurrencies, in general, are subject to volatility.
Bitcoin dominance is the ratio of Bitcoin's market capitalization to the total market capitalization of all cryptocurrencies combined. It provides a clear picture of Bitcoin’s interest among investors. A high BTC dominance typically happens before and during a bull run, in which investors resort to investing in relatively stable and high market capitalization cryptocurrency like Bitcoin. A drop in BTC dominance usually means that investors are moving their capital and/or profits to altcoins in a quest for higher returns, which usually triggers an explosion of altcoin rallies.
추천 기사


