


Bitcoin vs. Gold: BTC corrects as XAU holds firm ahead of Fed rate decision
- The broader crypto market reflects cooling interest as investors assess the upcoming Fed rate decision.
- Bitcoin extends declines for a third consecutive day, weighed down by persistent geopolitical tensions.
- Gold holds steady above the critical $4,000 level, signaling potential exposure to safe-haven assets amid growing macro uncertainty.
The cryptocurrency market is broadly pulling back this Friday following an early-week surge that pushed Bitcoin (BTC) near the $67,000 mark. BTC has since retreated below $65,000, as escalating tension and hostilities between the United States and Iran fuel investor caution.
Meanwhile, Gold (XAU) remains resilient above the key $4,000 level, with bulls eyeing a short-term technical breakout that could shift market sentiment from bearish to neutral, and potentially toward a more bullish trajectory.
Geopolitical tensions and macro uncertainty weigh on markets
The United States (US) extended military air strikes on Iran for a 13th consecutive night, with Iranian media reporting explosions in multiple cities, including Khorramabad, Jask, Ahvaz and Bandar Abbas.
Meanwhile, Iran has on Friday reported fresh strikes on US military installations in Bahrain, Jordan and Kuwait. According to a CNN report, explosions were also heard close to a military base hosting US forces in Erbil, Iraq.
US President Donald Trump stated he is weighing a “massive attack” on Iran and will soon determine whether to resume large-scale military operations. Iranian Foreign Minister Abbas Araghchi described the US action as “mindless aggression,” warning that Washington will now face a steeper price to secure an end to the conflict.
Market participants are currently pricing in a 64% chance that the Federal Reserve (Fed) will leave interest rates unchanged in the 3.50%-3.75% range in the next review cycle on July 29.
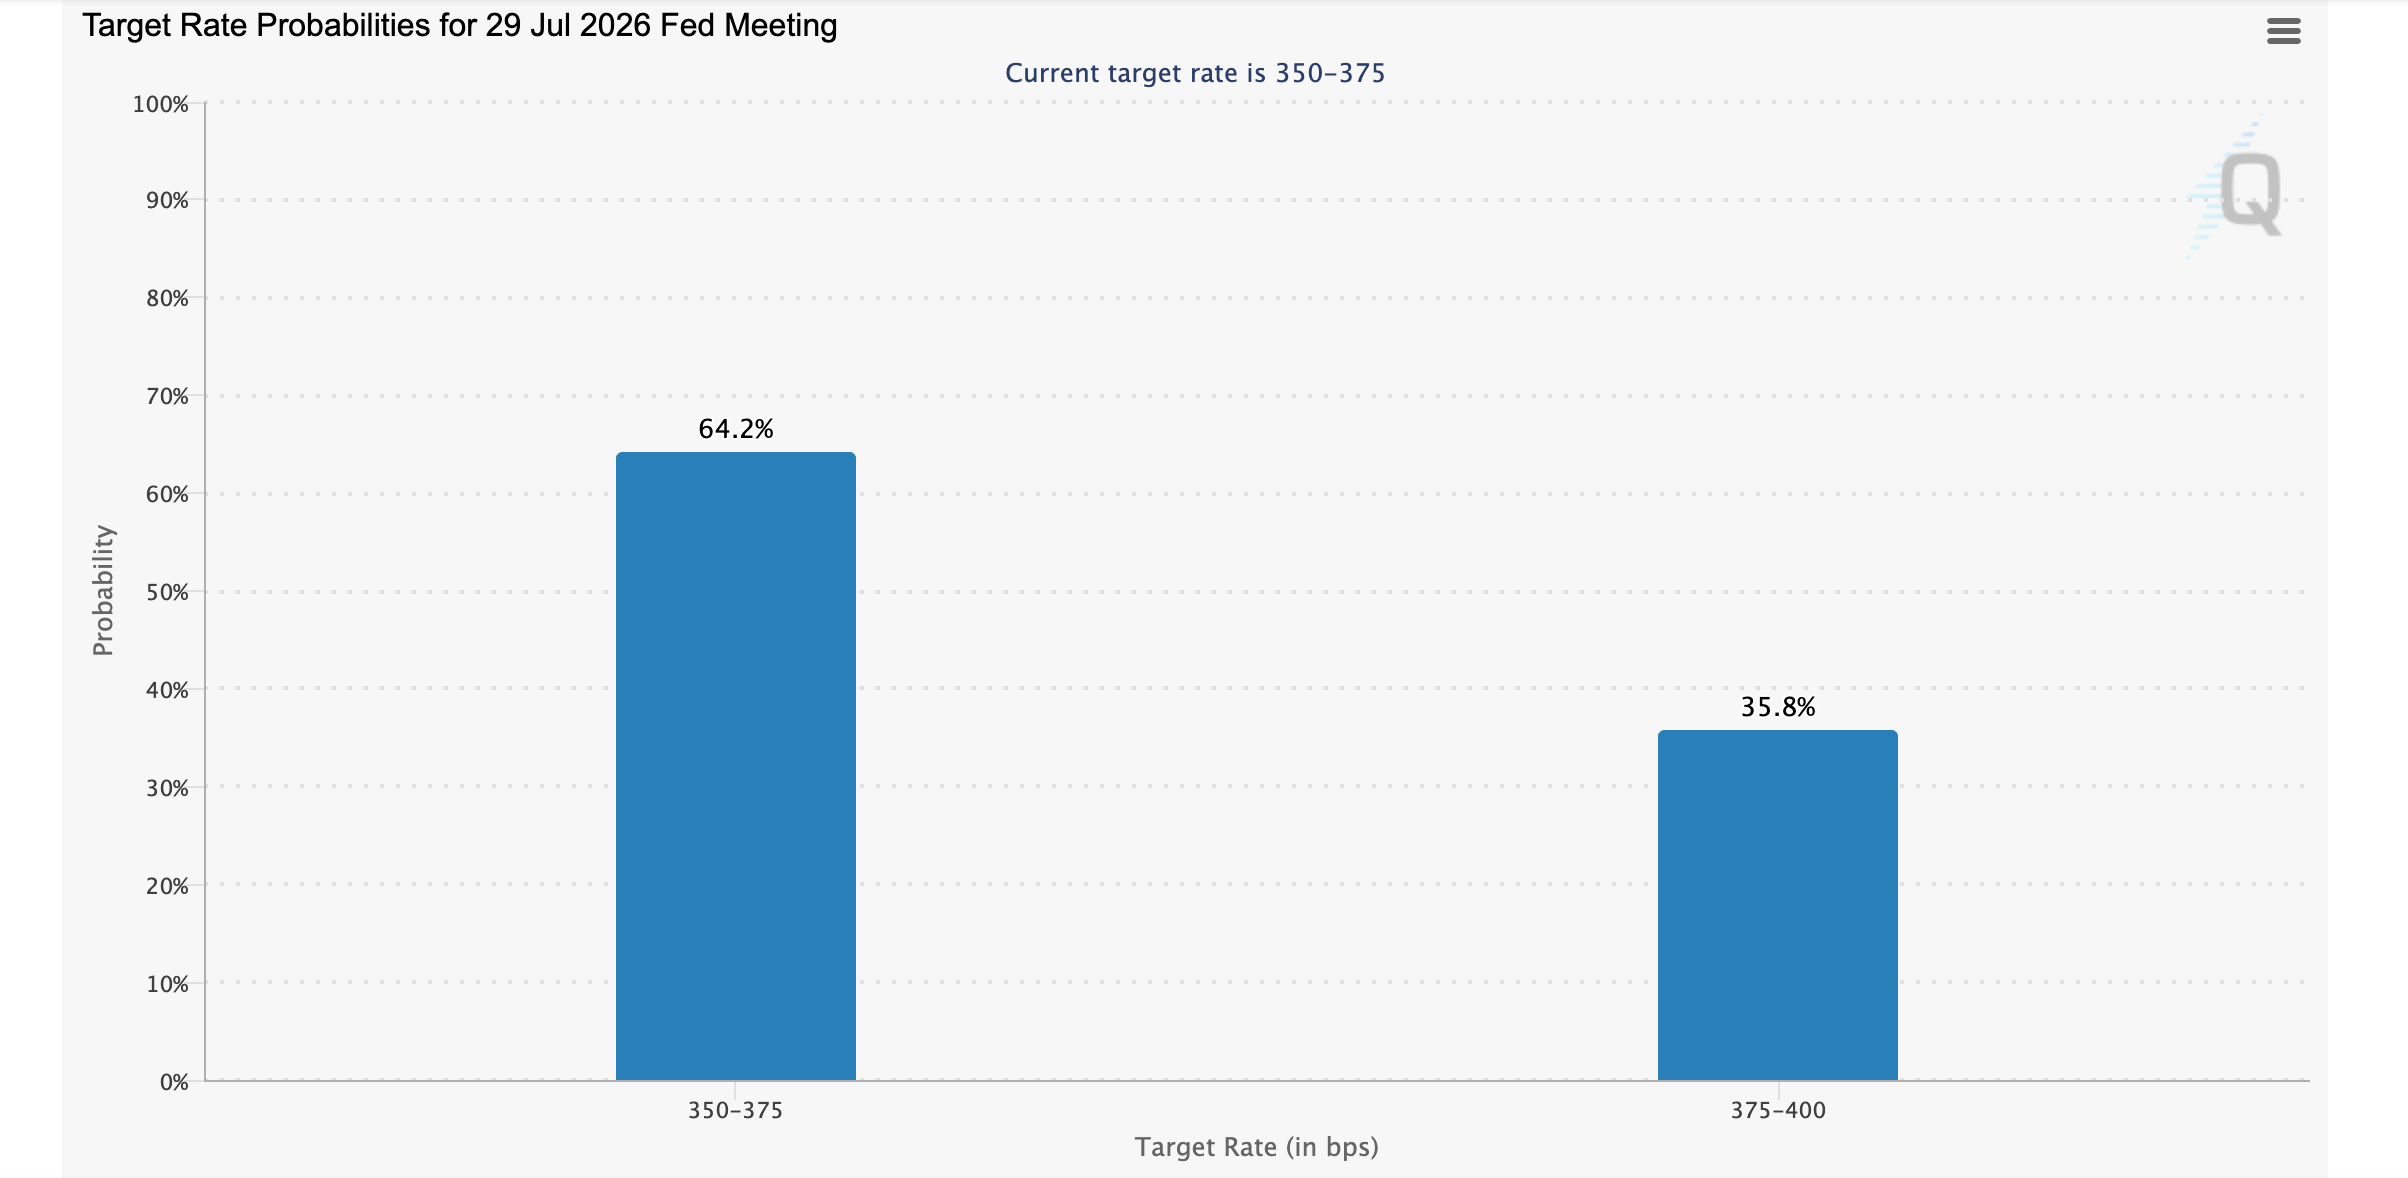
Although inflation in the world’s largest economy eased in June, according to the Consumer Price Index (CPI) report released earlier this month, the war in the Middle East has seen Oil prices rally. The West Texas Intermediate (WTI) Crude hovers around $87, down from the weekly high at $92 on Thursday.
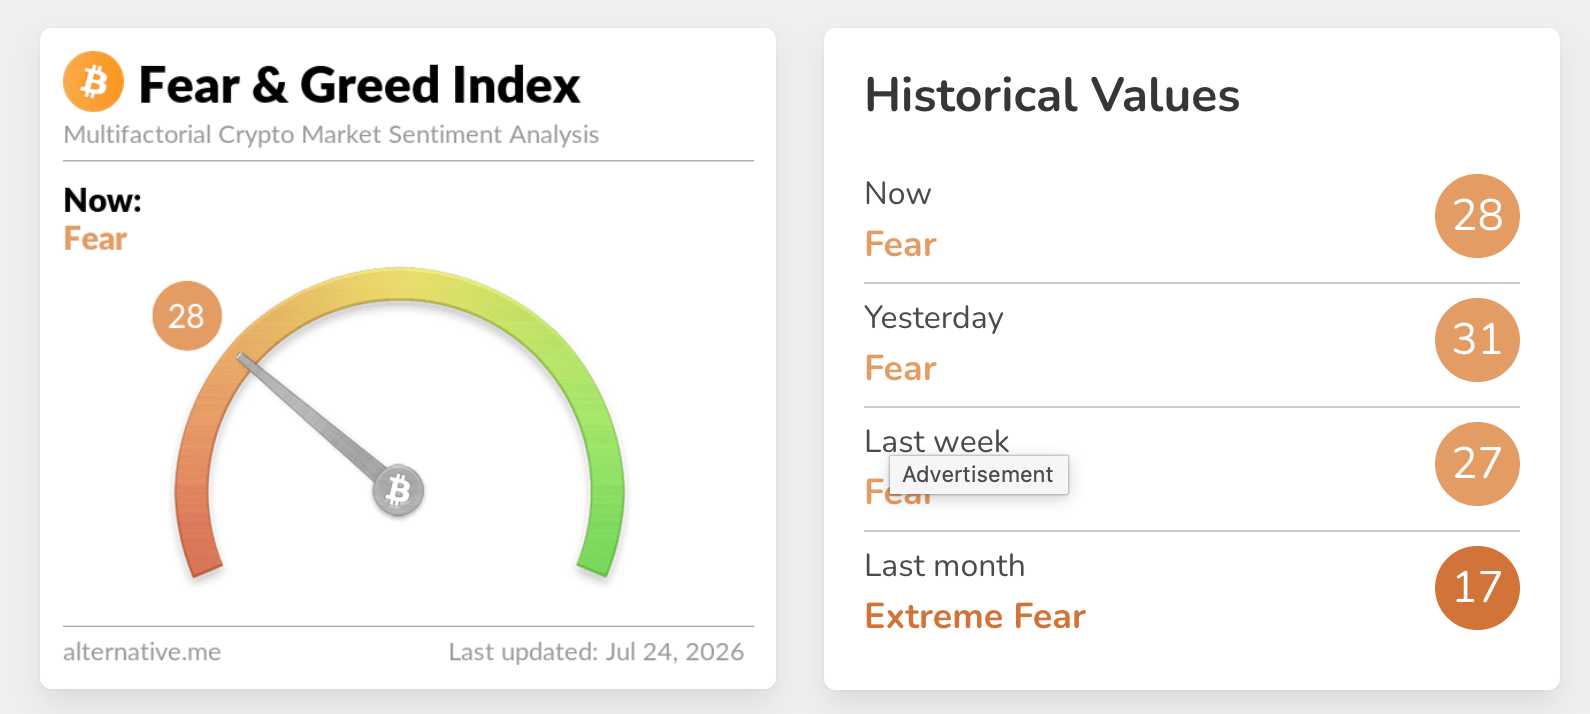
Appetite for risk assets has remained unstable, as reflected in the crypto Fear & Greed Index. Following a brief jump above 30 in the Fear territory earlier this week, the sentiment index currently holds at 28, undermining risk exposure.
Price analysis: Bitcoin gives back gains as technicals weaken
Bitcoin is falling toward $64,000, maintaining a bearish near-term bias as price holds below key moving averages. The 50-day EMA around $65,099 is the first topside cap, with the 100-day and 200-day EMAs near $67,933 and $73,636 reinforcing a broader downside skew while they remain overhead.
Momentum conditions look indecisive rather than supportive, as the Relative Strength Index (RSI) sits almost exactly at the neutral 50 mark on the daily chart and the Moving Average Convergence Divergence (MACD) indicator remains positive but continues to fade, hinting that recent recovery attempts are losing strength rather than building a fresh bullish leg.
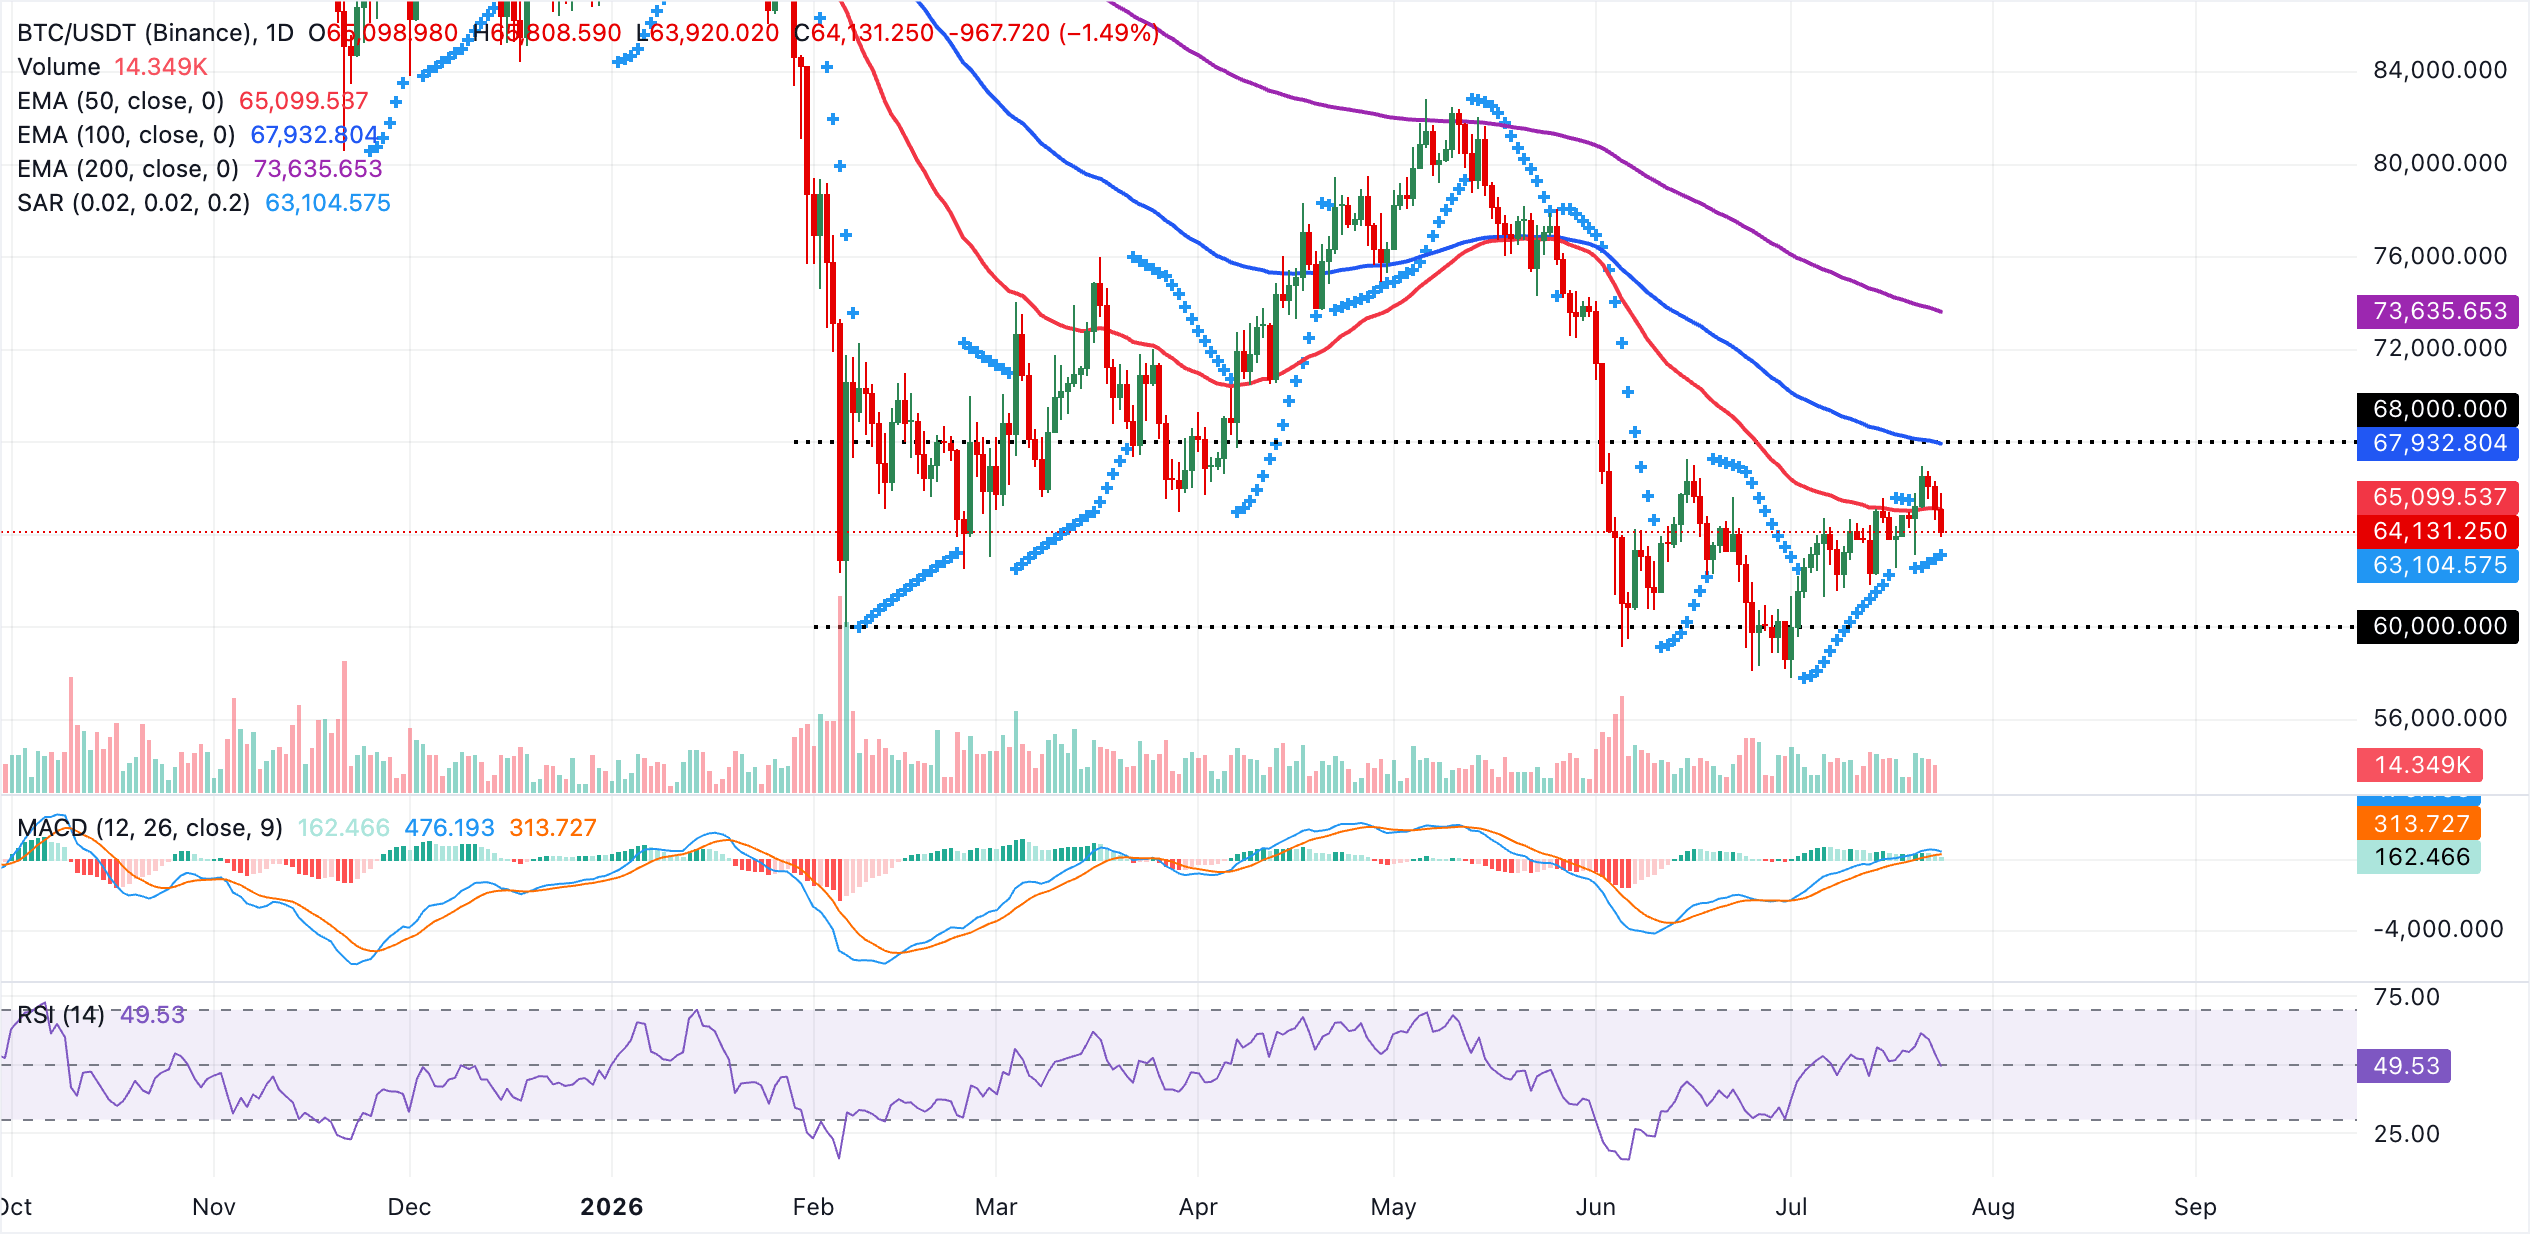
On the downside, the nearest meaningful support is provided by the latest Parabolic SAR print around $63,105, and a clear break beneath this level would likely expose a deeper pullback as bears regain control. On the topside, bulls would first need to reclaim the 50-day EMA at $65,099 to ease immediate selling pressure, with further resistance then aligning at the 100-day EMA near $67,933 and the 200-day EMA around $73,636, where a cluster of longer-term averages continues to cap the broader recovery attempt.
Gold mulls recovery as $4,000 support holds
Gold edges higher above the key $4,000 level at the time of writing. Still, the metal remains capped in the near-term, with spot holding below a dense band of moving averages, as the 50-day EMA around $4,223, the 200-day EMA near $4,302, and the 100-day EMA close to $4,358 all sit overhead as layered resistance.
The Parabolic SAR has flipped below price near $3,951, hinting at some tactical support after the recent pullback, while the RSI hovers just below the midline on the daily chart and the MACD indicator stays positive, suggesting that upside attempts are constrained by structure despite modestly constructive momentum.
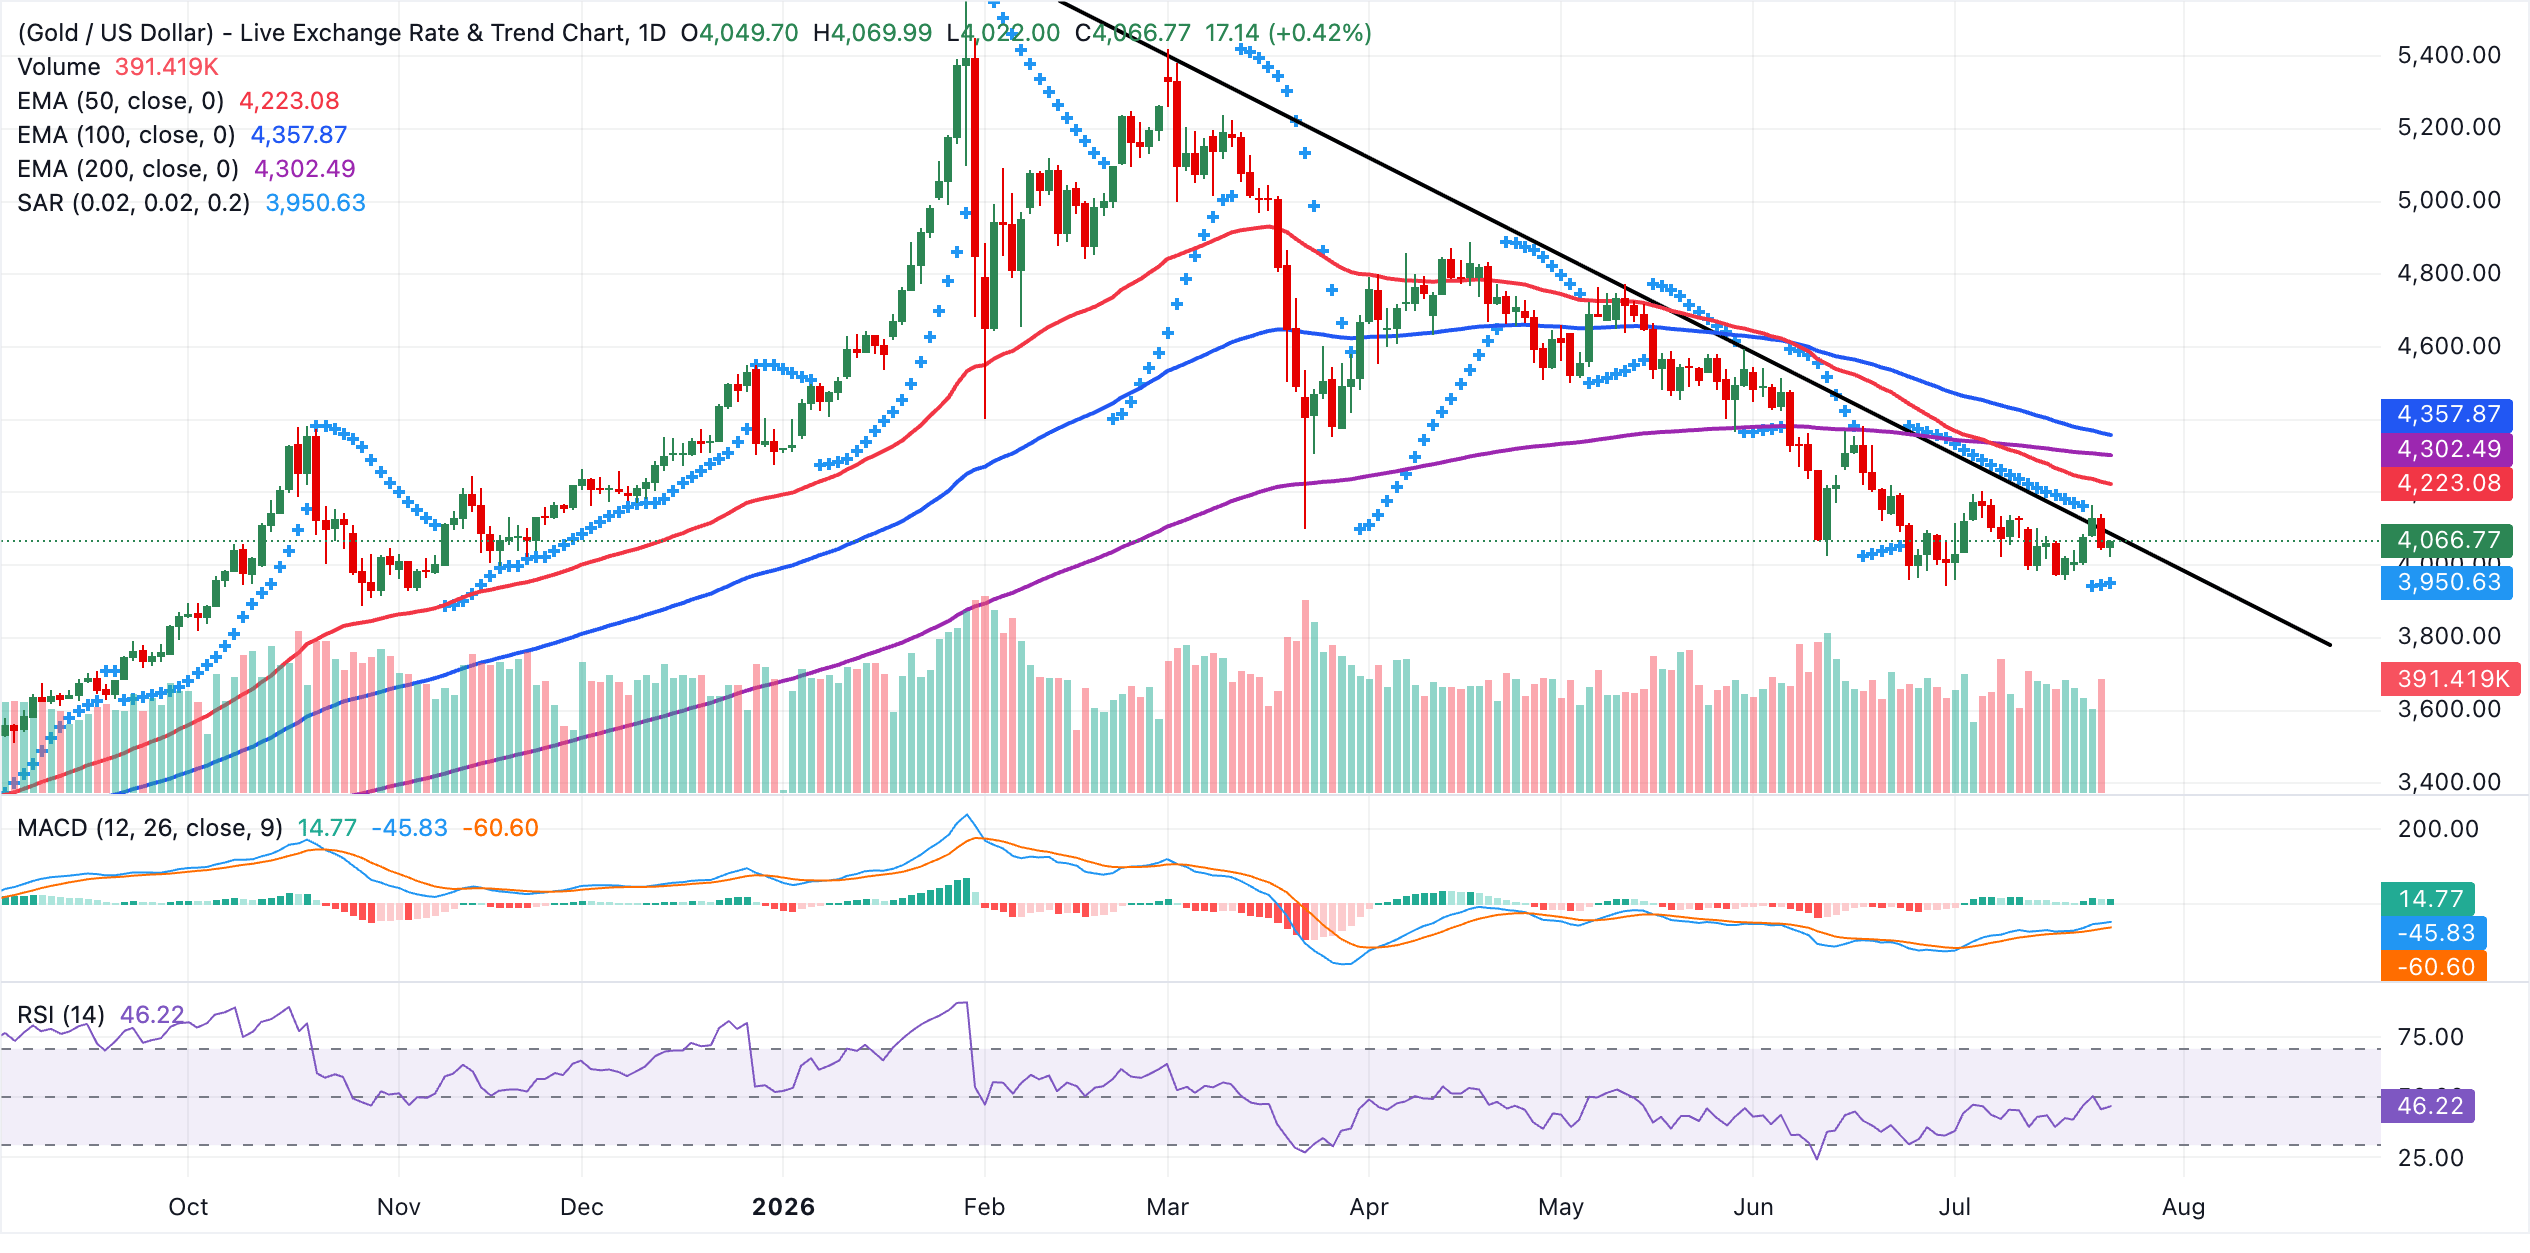
Initial resistance is seen at the 50-day EMA around $4,223, with further barriers at the 200-day EMA near $4,302 and the 100-day EMA around $4,358, and only a sustained break above this moving average cluster would ease the current capped bias. On the downside, nearby support emerges around the prior downward resistance trendline break zone near $4,002, ahead of the Parabolic SAR level around $3,951, where a decisive drop would open the door to a deeper corrective phase.
(The technical analysis of this story was written with the help of an AI tool. Know more.)
Bitcoin, altcoins, stablecoins FAQs
Bitcoin is the largest cryptocurrency by market capitalization, a virtual currency designed to serve as money. This form of payment cannot be controlled by any one person, group, or entity, which eliminates the need for third-party participation during financial transactions.
Altcoins are any cryptocurrency apart from Bitcoin, but some also regard Ethereum as a non-altcoin because it is from these two cryptocurrencies that forking happens. If this is true, then Litecoin is the first altcoin, forked from the Bitcoin protocol and, therefore, an “improved” version of it.
Stablecoins are cryptocurrencies designed to have a stable price, with their value backed by a reserve of the asset it represents. To achieve this, the value of any one stablecoin is pegged to a commodity or financial instrument, such as the US Dollar (USD), with its supply regulated by an algorithm or demand. The main goal of stablecoins is to provide an on/off-ramp for investors willing to trade and invest in cryptocurrencies. Stablecoins also allow investors to store value since cryptocurrencies, in general, are subject to volatility.
Bitcoin dominance is the ratio of Bitcoin's market capitalization to the total market capitalization of all cryptocurrencies combined. It provides a clear picture of Bitcoin’s interest among investors. A high BTC dominance typically happens before and during a bull run, in which investors resort to investing in relatively stable and high market capitalization cryptocurrency like Bitcoin. A drop in BTC dominance usually means that investors are moving their capital and/or profits to altcoins in a quest for higher returns, which usually triggers an explosion of altcoin rallies.
추천 기사


