


Crypto Today: Bitcoin, Ethereum, XRP extend rebound amid returning institutional capital inflows
- Bitcoin edges higher above $66,000, supported by steady inflows into US-listed spot ETFs.
- Ethereum rebounds for the fourth consecutive day, building on the 50-day EMA support and capital inflows.
- XRP flaunts recovery signs, with the MACD reinforcing a buy signal and the RSI rising into bullish territory.
Cryptocurrency prices extend a broad recovery, led by Bitcoin (BTC), trading above $66,000 at the time of writing on Tuesday. Ethereum (ETH) remains bullish above $1,940, after logging four straight days of gains. Meanwhile, Ripple (XRP) hovers around $1.13, building on the reclaimed $1.10 critical level.
Crypto market sentiment lags as US-Iran war rages on
After Monday’s heightened volatility, West Texas Intermediate (WTI) Crude Oil slipped to trade near $82 per barrel in the European session. Reports that mediators were advancing a proposed 10-day pause in strikes to revive the interim United States (US)-Iran deal eased pressure in global markets on Monday and early Tuesday.
However, geopolitical tensions remain elevated as US President Donald Trump has warned Iran of repercussions following US service member casualties.
The US military pressed on with a tenth straight day of strikes, with explosions reported in Sirik, Bandar Abbas, Qeshm Island, Chabahar, and Konarak. Iran responded by targeting US assets throughout the Gulf region.
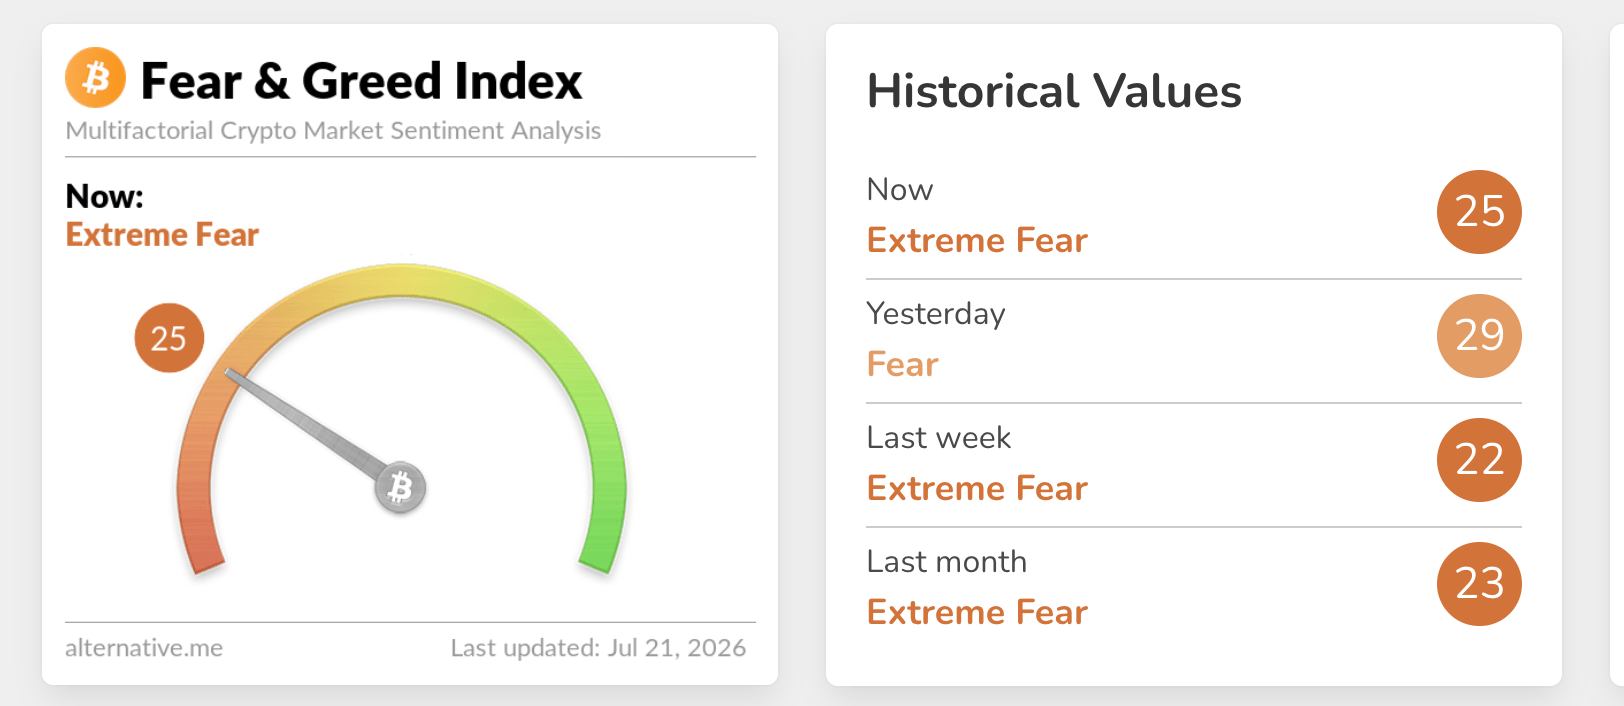
Market sentiment has moderated to 25 in the Extreme Fear territory on Tuesday, down from 29 in the Fear region the day before, according to the Fear & Greed Index. Sustained deterioration in sentiment could cap the ongoing recovery, while a steady increase could boost the bullish outlook.
Capital inflows return as Bitcoin, Ethereum and XRP edge higher
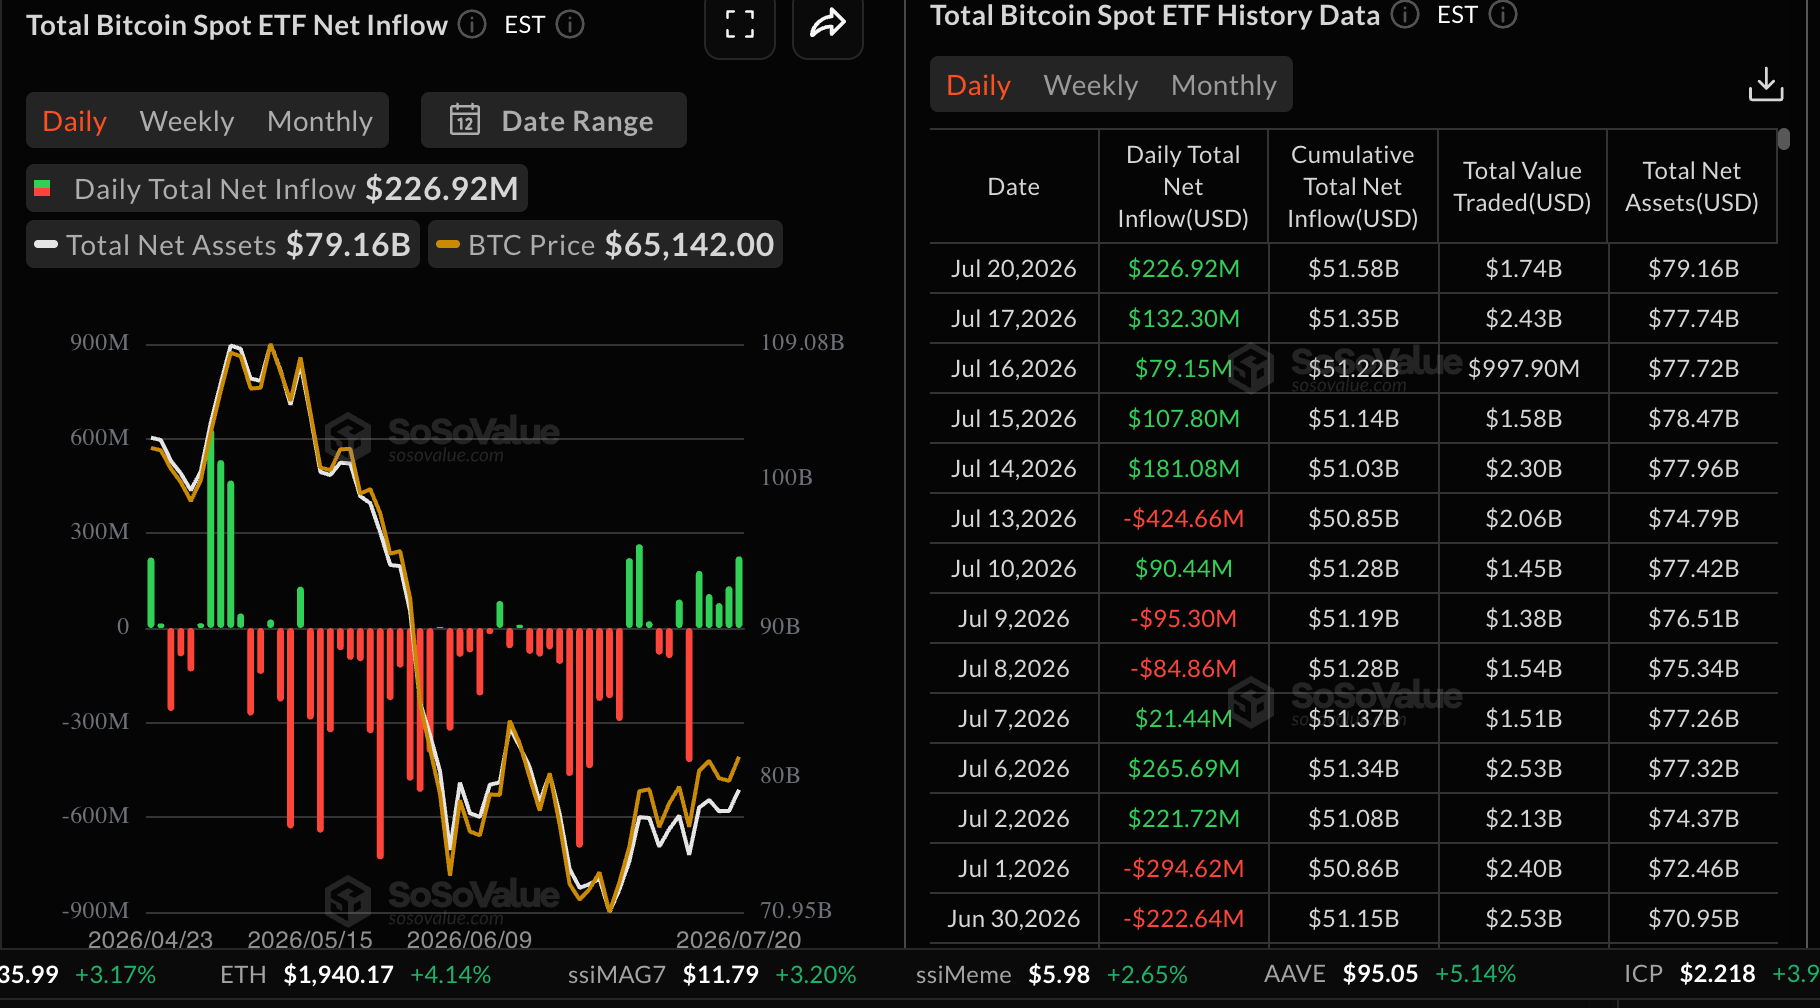
Institutional interest in Bitcoin spot Exchange-Traded Funds (ETFs) has steadied for five consecutive days, with inflows increasing to $227 million on Monday, from $132 million last Friday. According to SoSoValue data, cumulative inflows stand at nearly $52 billion, while net assets under management average $79 billion, underscoring long-term institutional interest in Bitcoin spot ETFs.
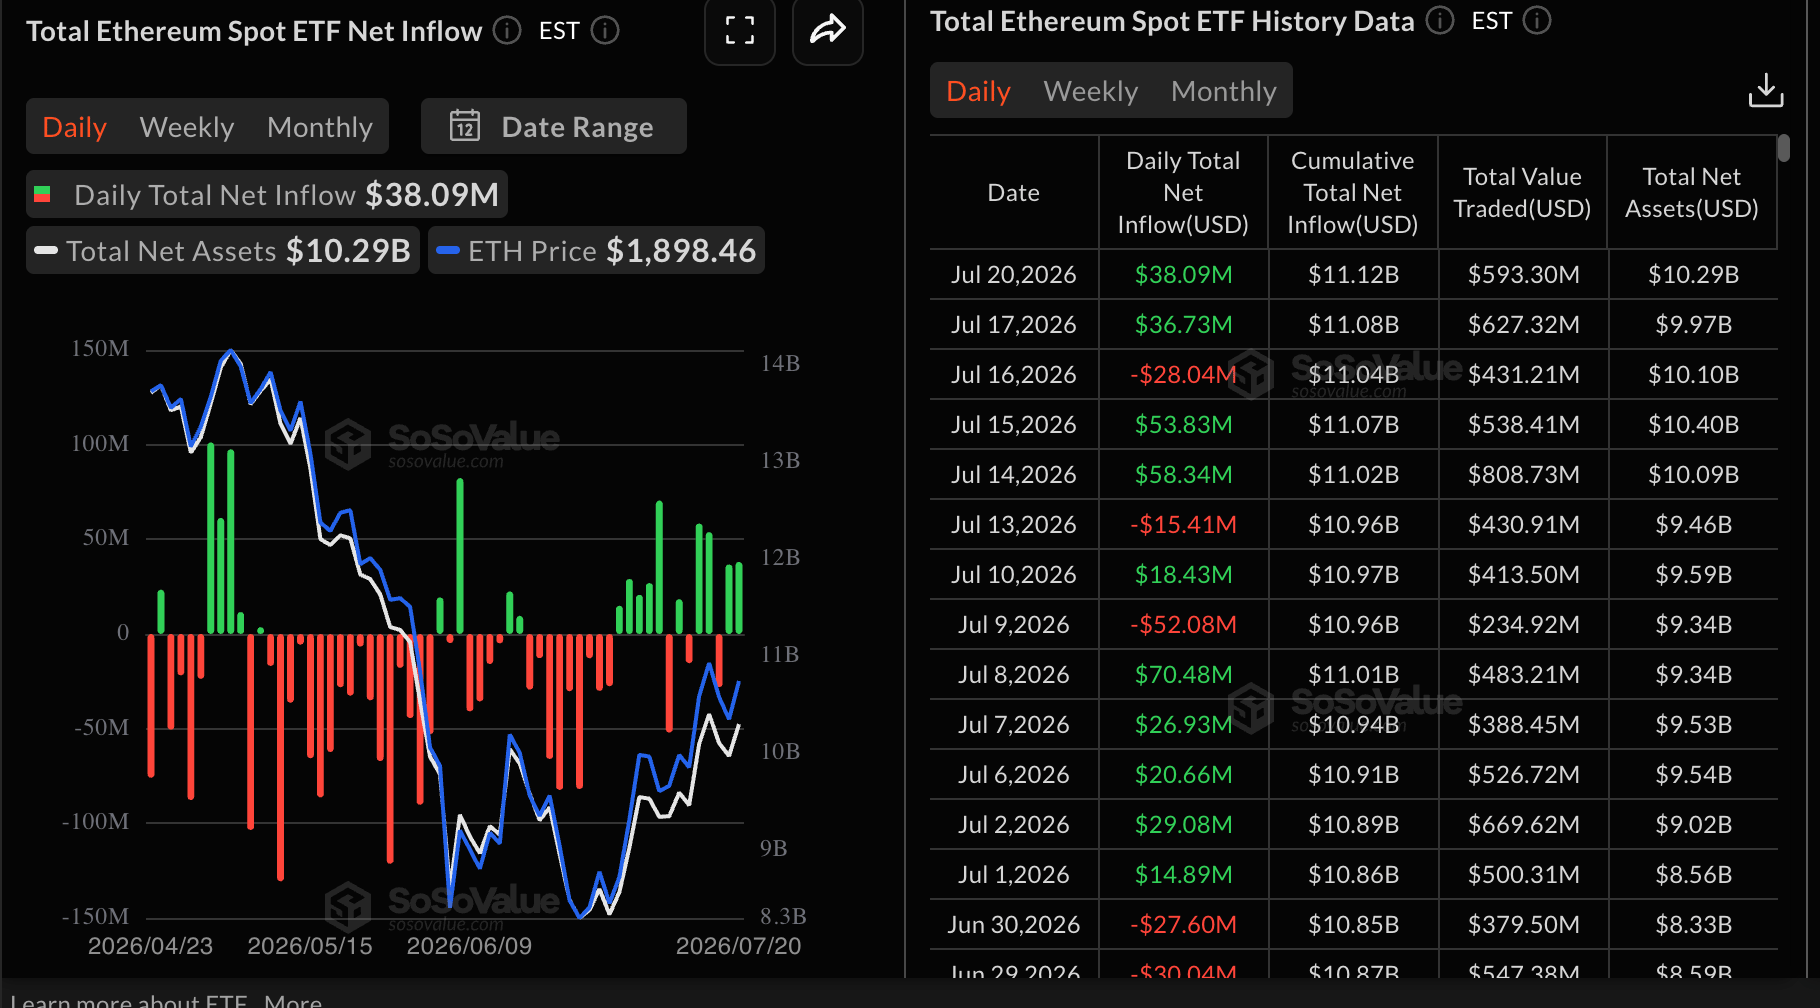
Demand for Ethereum spot ETFs is gradually returning, as evidenced by inflows of $38 million on Monday, up slightly from $37 million last Friday. Cumulative inflows increased only marginally to $11.12 billion, from $11.08 billion in the same period. Meanwhile, assets under management averaged $10.29 billion, up from Friday’s $9.97 billion.
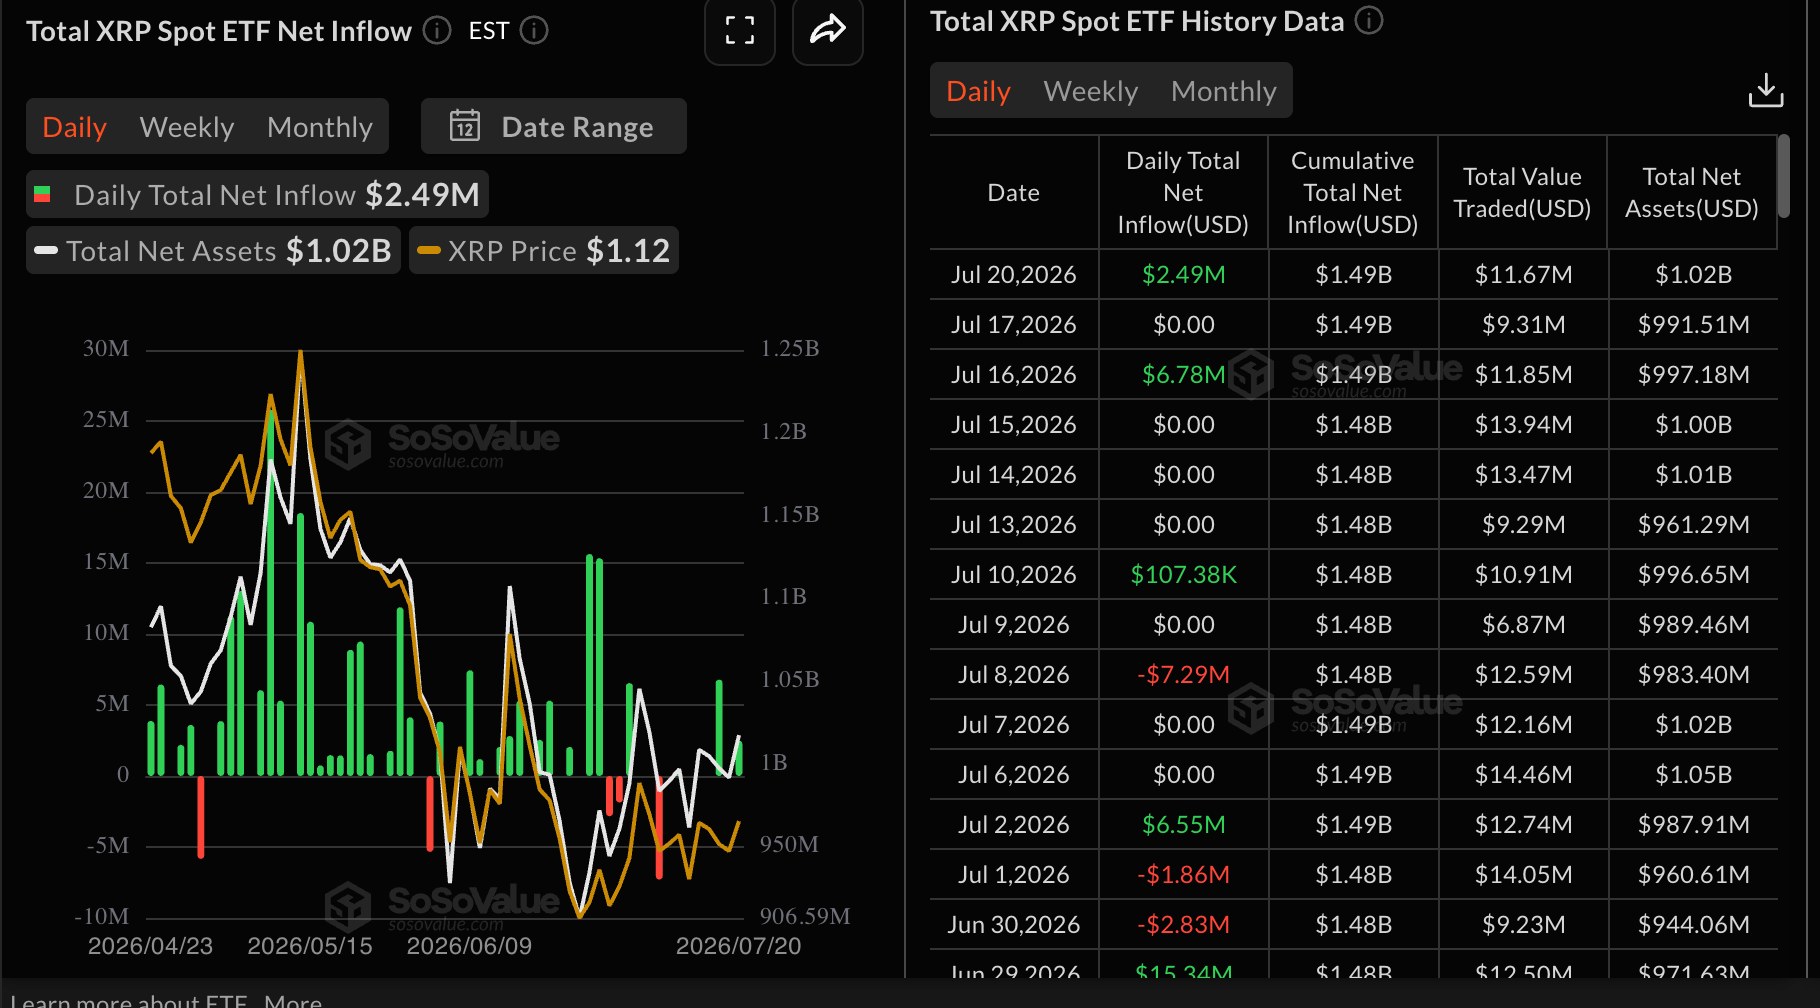
Appetite for XRP spot ETFs shows mild signs of picking up, with inflows totaling $2.5 million on Monday after muted activity last Friday. Cumulative inflows remain steady at $1.49 billion, with total assets under management standing at $1.02 billion. Interest in XRP spot ETFs still lags Bitcoin and Ethereum, which continue to attract larger flow volumes.
Price analysis: Bitcoin bulls make a comeback
Bitcoin holds above the 50-day Exponential Moving Average (EMA) at $65,087, but remains capped beneath the 100-day EMA at $68,109 and the 200-day EMA at $73,933, leaving the broader bias neutral to slightly bearish despite the recent rebound.
Momentum is constructive, as the Relative Strength Index (RSI) advances near 60 on the daily chart, while the Moving Average Convergence Divergence (MACD) stays in positive territory and maintaining a positive histogram, hinting that buyers are attempting to regain control against the prevailing overhead trend structure.
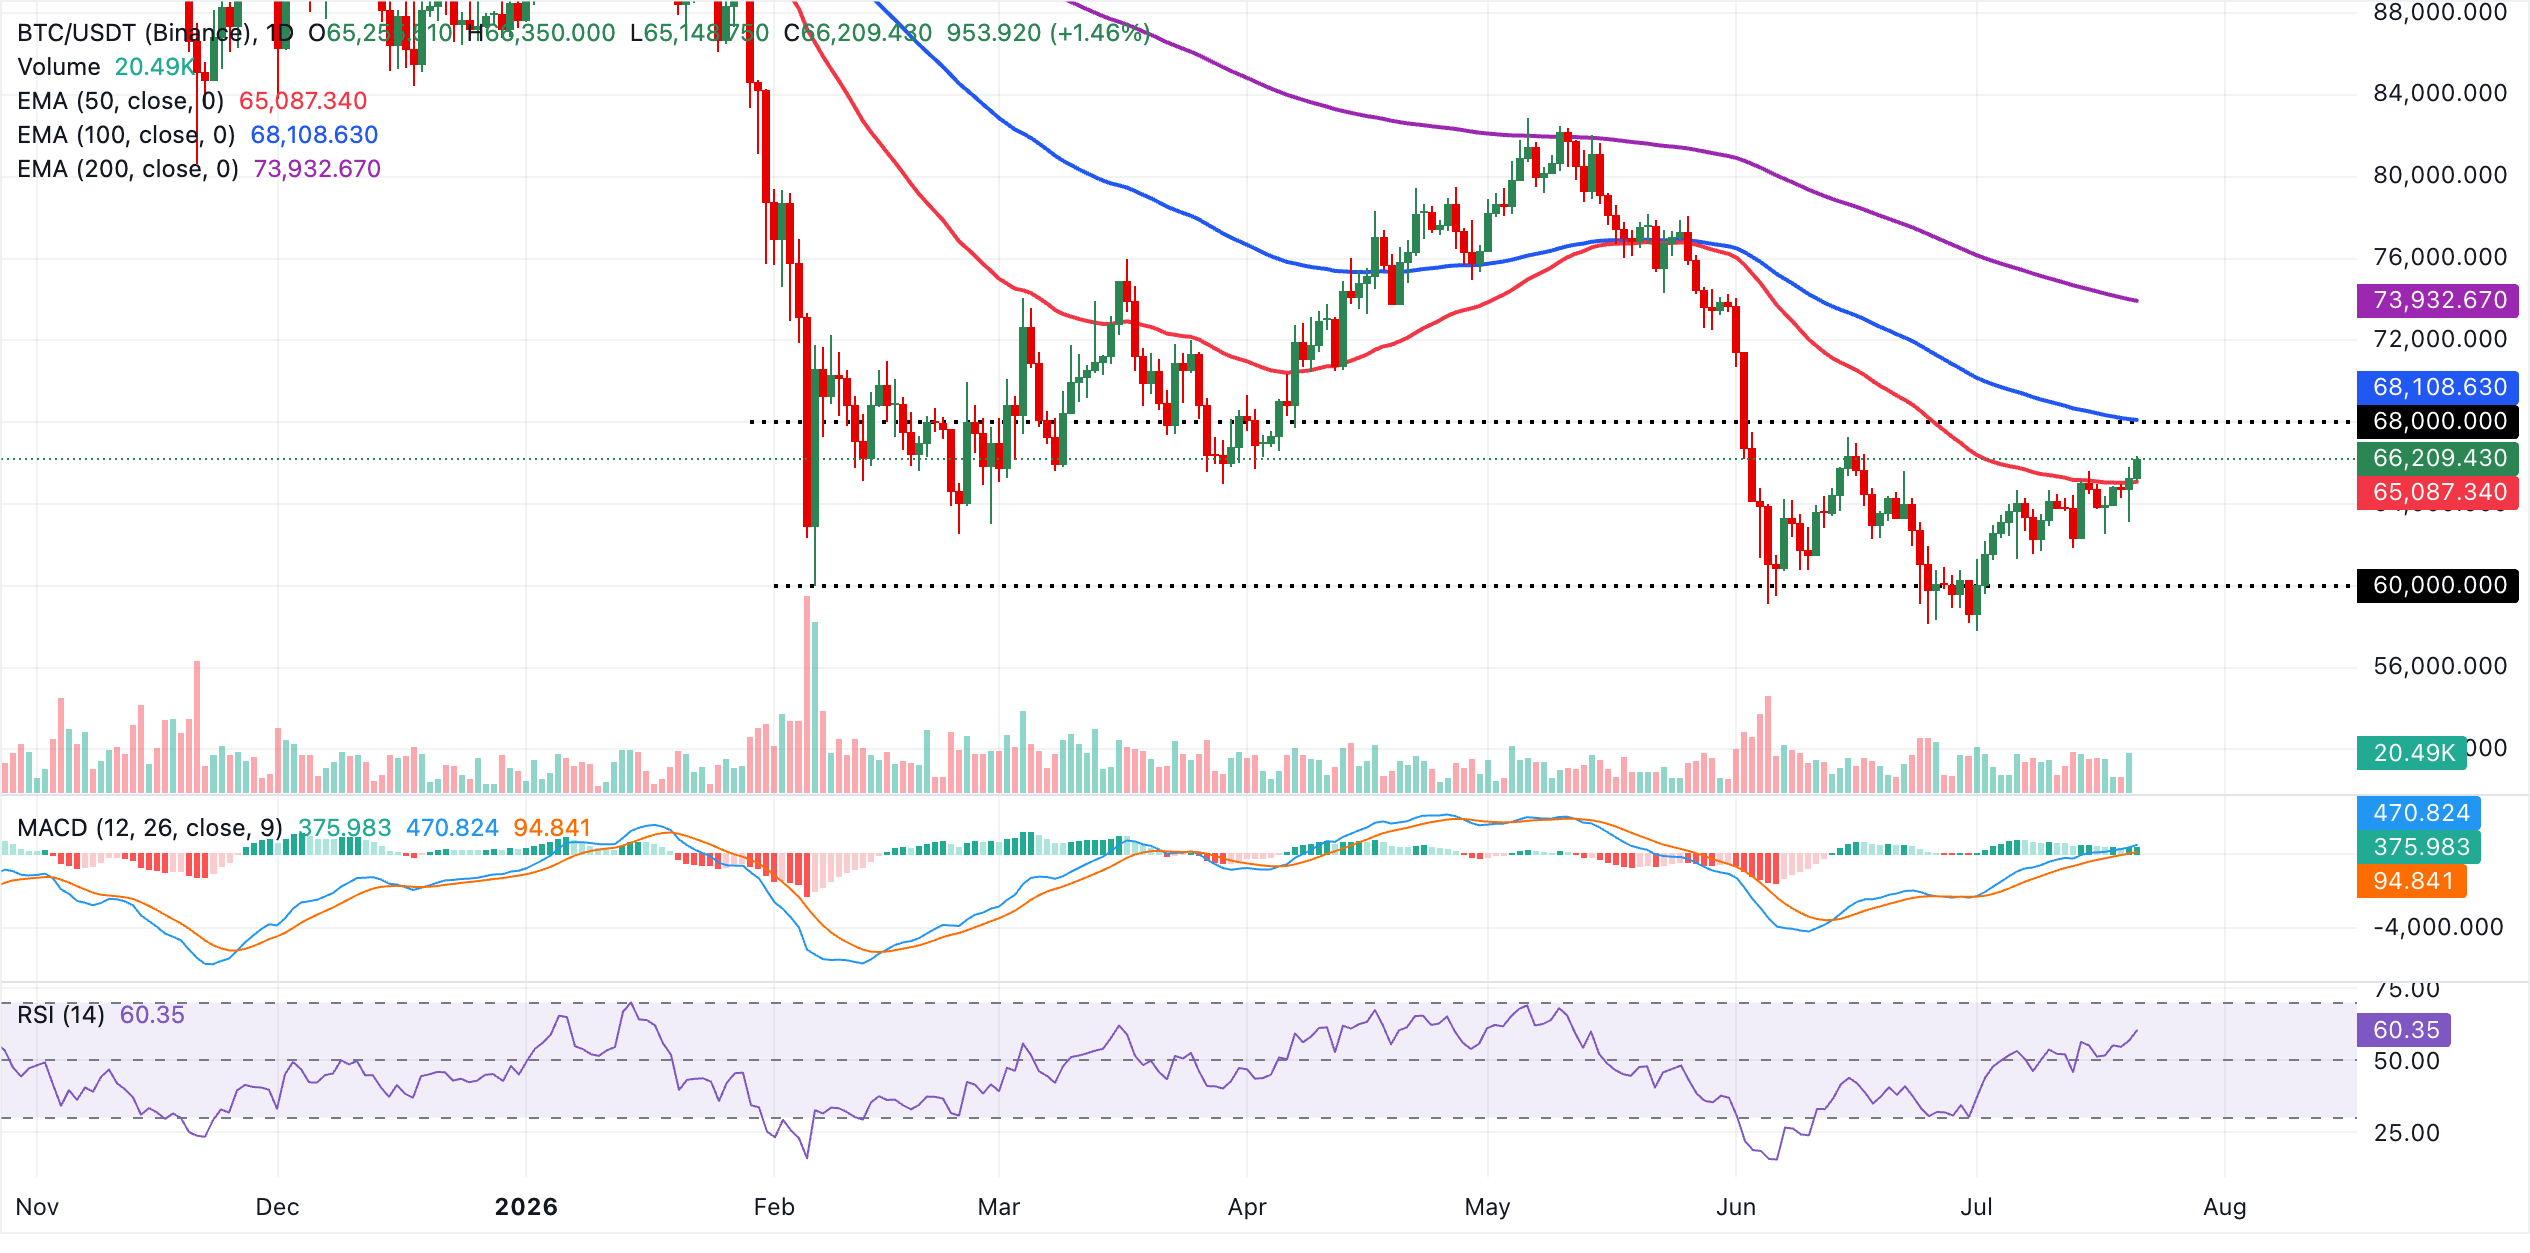
On the downside, initial support is defined by the 50-day EMA at $65,087, and a sustained break below this floor would expose a deeper corrective phase toward lower daily lows. at $65,149. On the topside, immediate resistance lies at the 100-day EMA at $68,109, followed by a more significant barrier at the 200-day EMA near $73,933. A daily close above these clustered moving averages would meaningfully ease the longer-term bearish pressure on BTC.
Altcoins outlook: Ethereum and XRP eye short-term bullish breakout
Ethereum trades around $1,941, maintaining a constructive bullish bias as price holds above the 100-day and 50-day Exponential Moving Averages (EMAs) at $1,938 and $1,824 respectively, while still trading below the longer-term 200-day EMA at $2,201.
The MACD indicator stays in positive territory with the line above the signal and a supportive histogram on the daily chart, and the RSI near 65 suggests firm bullish momentum that is edging toward overbought conditions. This hints that upside may become more measured as price approaches the next major barrier.
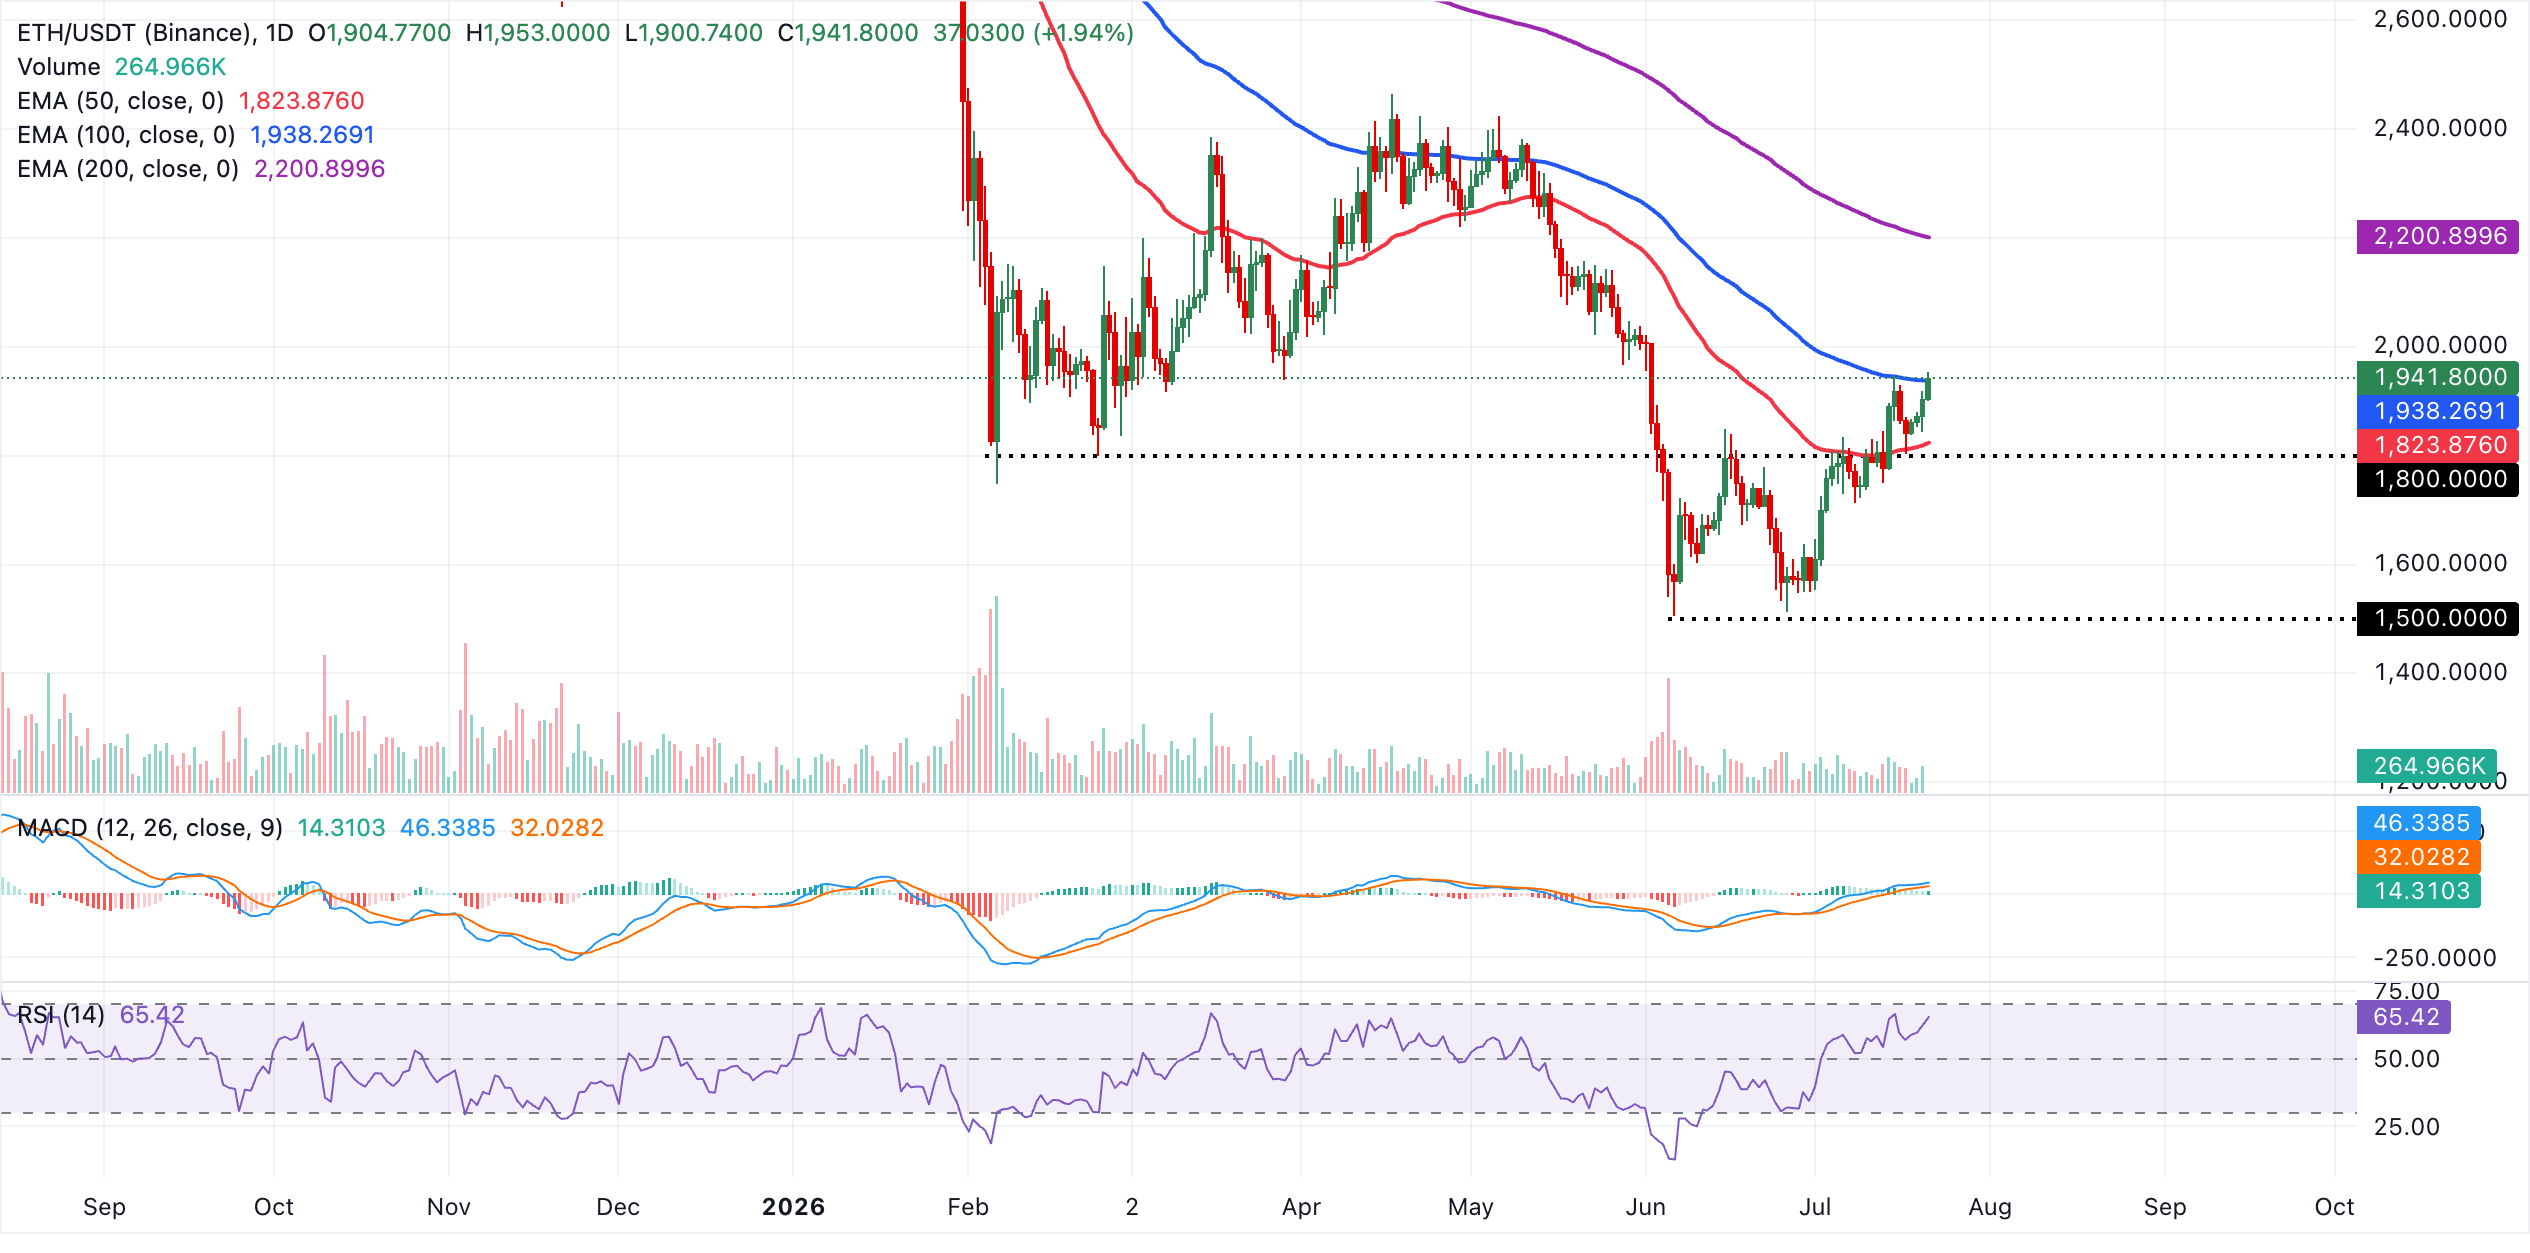
On the topside, the psychological $2,000 level acts as the first significant hurdle, where sellers are likely to reassert themselves. Above that area, the the 200-day EMA at $2,201 could limit bullish advance. On the downside, immediate support is seen at the 100-day EMA at $1,938, with a deeper corrective floor at the 50-day EMA near $1,824. As long as ETH stays above these underlying demand levels, the near-term technical setup favors dip-buying over aggressive selling.
XRP, on the other hand, trades at $1.13, keeping a bearish near-term bias as price remains below the key moving averages. The 50-day EMA at $1.15, together with the 100-day EMA at $1.24 and the 200-day EMA at $1.44, all sit overhead and suggest that the recent bounce is still unfolding within a broader corrective phase.
Momentum is more constructive, with the RSI around 55 on the daily chart and the MACD holding in positive territory with the line above its signal and a mildly expanding positive histogram, hinting at attempts to recover that are yet capped by these structural barriers.
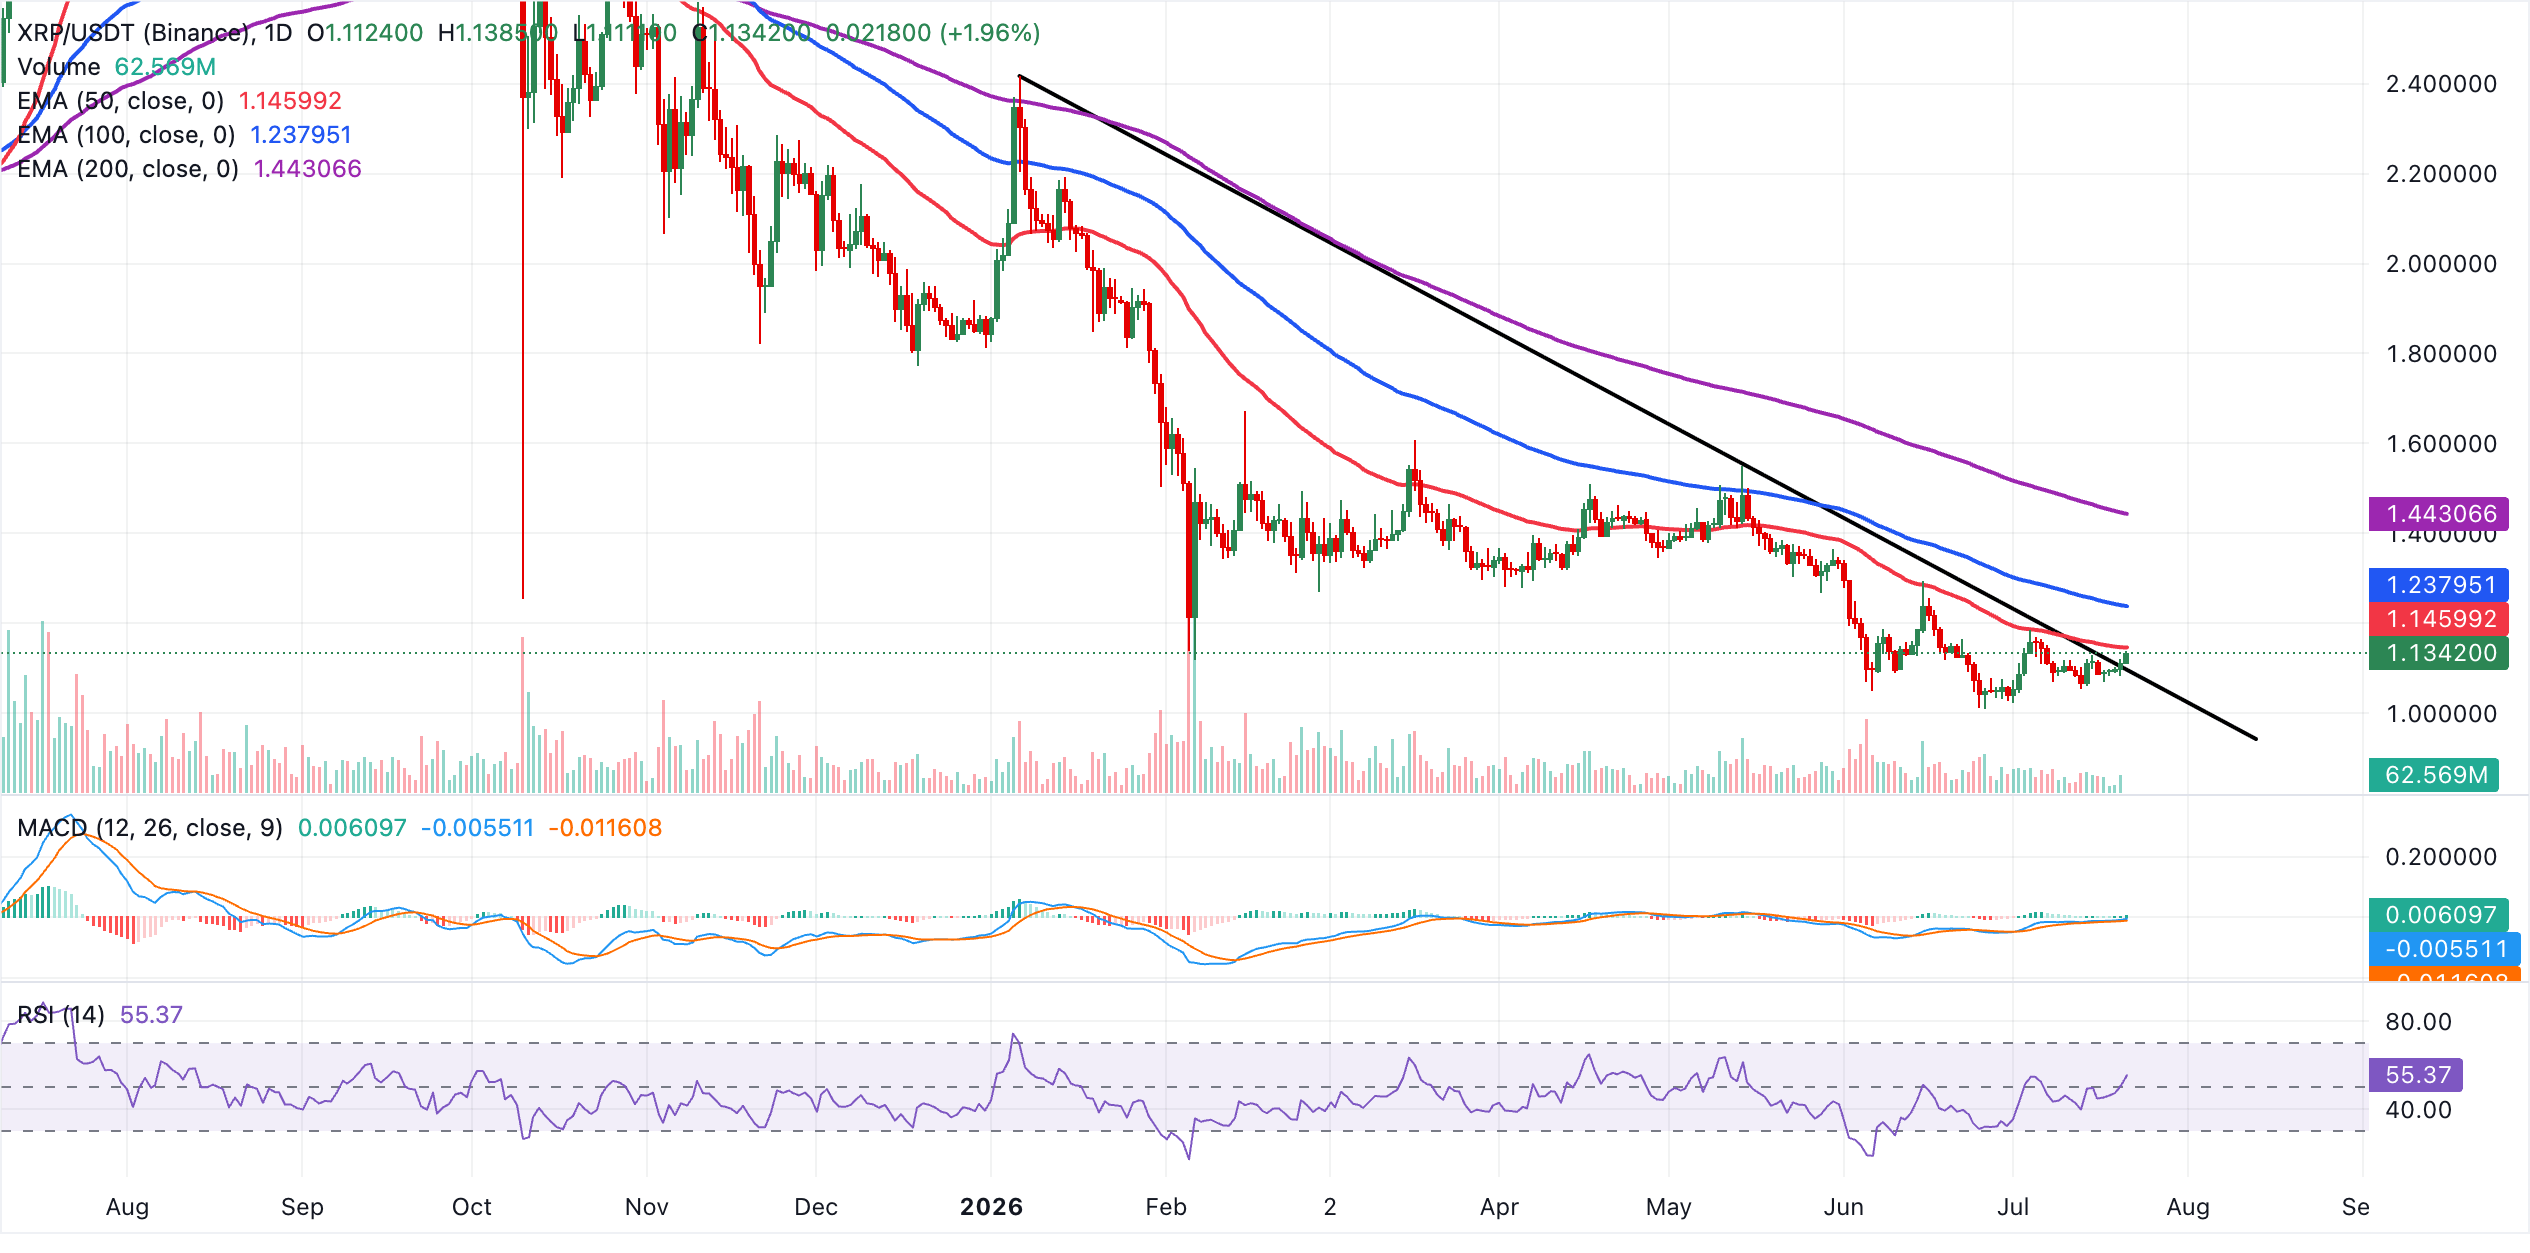
On the topside, immediate resistance is seen at the 50-day EMA at $1.15, which is the first hurdle for any sustained advance. A daily close above this level would open the way toward the 100-day EMA at $1.24, while the 200-day EMA at $1.44 marks a more distant bullish validation zone. On the downside, initial support lies near the prior downward trendline break price at $1.09, where buyers could look to defend the breakout area. A move back below this floor would reinforce the prevailing bearish structure and expose further weakness in the coming sessions.
(The technical analysis of this story was written with the help of an AI tool. Know more.)
Crypto ETF FAQs
An Exchange-Traded Fund (ETF) is an investment vehicle or an index that tracks the price of an underlying asset. ETFs can not only track a single asset, but a group of assets and sectors. For example, a Bitcoin ETF tracks Bitcoin’s price. ETF is a tool used by investors to gain exposure to a certain asset.
Yes. The first Bitcoin futures ETF in the US was approved by the US Securities & Exchange Commission in October 2021. A total of seven Bitcoin futures ETFs have been approved, with more than 20 still waiting for the regulator’s permission. The SEC says that the cryptocurrency industry is new and subject to manipulation, which is why it has been delaying crypto-related futures ETFs for the last few years.
Yes. The SEC approved in January 2024 the listing and trading of several Bitcoin spot Exchange-Traded Funds, opening the door to institutional capital and mainstream investors to trade the main crypto currency. The decision was hailed by the industry as a game changer.
The main advantage of crypto ETFs is the possibility of gaining exposure to a cryptocurrency without ownership, reducing the risk and cost of holding the asset. Other pros are a lower learning curve and higher security for investors since ETFs take charge of securing the underlying asset holdings. As for the main drawbacks, the main one is that as an investor you can’t have direct ownership of the asset, or, as they say in crypto, “not your keys, not your coins.” Other disadvantages are higher costs associated with holding crypto since ETFs charge fees for active management. Finally, even though investing in ETFs reduces the risk of holding an asset, price swings in the underlying cryptocurrency are likely to be reflected in the investment vehicle too.
추천 기사


