


Bitcoin Price Forecast: BTC remains below key 50-day EMA as headwinds from escalating US-Iran conflict offset ETF inflows
- Bitcoin hovers slightly below the 50-day EMA at around $65,000, a key resistance level that, if broken, could lead to further gains.
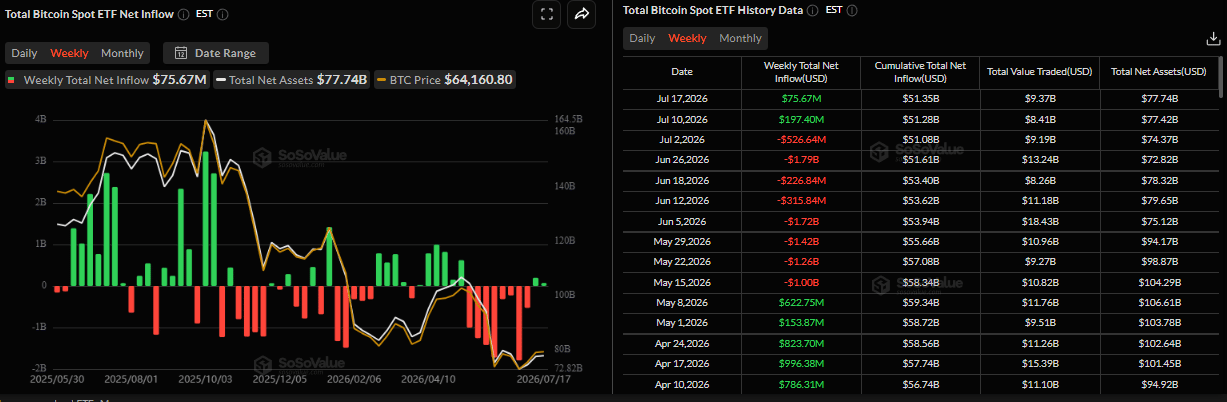
- US-listed spot ETFs recorded a mild inflow of $75.67 million last week, marking the second consecutive week of deposits after a prolonged period of outflows.
- The latest round of strikes between the US and Iran continue to cap risk appetite, limiting BTC’s recovery.
Bitcoin (BTC) trades just below its 50-day Exponential Moving Average (EMA) near $65,000 on Monday, a key technical level that could determine its next directional move. Institutional demand via ETFs improved somewhat last week, providing some tailwind for the Crypto King, but the latest round of strikes between the US and Iran has dampened risk appetite.
Geopolitical risks cap BTC’s upside
US Central Command (CENTCOM) said on X that it has completed the ninth consecutive evening of strikes against Iran on July 19, at 10 p.m. ET.
US President Donald Trump said that the latest strikes were being carried out in honor of US service members killed in recent days. CENTCOM added that the strikes are aimed at degrading Iranian military capabilities used to attack commercial vessels and civilian mariners transiting the Strait of Hormuz.
In response, Iran fired ballistic missiles and one-way attack drones targeting US allies in the region, with Bahrain, Jordan, Kuwait, and Iraq reporting a new wave of attacks.
Adding to this, the US recently resumed a naval blockade of Iranian ports and restricted an earlier Oil-selling license. On the other hand, the Islamic Revolutionary Guard Corps (IRGC) is aggressively monitoring and attempting to restrict vessel traffic through the Strait of Hormuz.
The latest developments have heightened the risk of a broader regional conflict, prompting traders to price in a higher geopolitical risk premium and dampening overall risk appetite. The renewed rise in Oil prices has revived fears of energy-driven inflation, which has strengthened the safe-haven US Dollar (USD) and capped the Crypto King’s upside.
Institutional demand shows mild signs of improvement
SoSoValue data shows that spot BTC ETFs recorded a mild inflow of $75.67 million last week, marking the second week of positive flows after weeks of withdrawals. The sustained inflows suggest institutional investors are gradually returning to the market. If these flows continue and intensify this week, BTC could see further recovery.
“ETF inflows return, but not yet enough for Bitcoin to break out,” Simon-Peter Massabni, Head of Business Development at XS.com, said in an email comment.
Massabni explained that the market sentiment has stabilized somewhat, supported by softer US inflation data and renewed inflows into spot Bitcoin ETFs. However, the fact that prices have yet to decisively break above the $65,000-$65,500 range suggests that current buying pressure is only strong enough to contain the downside, but not yet sufficient to confirm a new uptrend.
“In the near term, the $65,000-$65,500 range remains the key resistance area. If Bitcoin breaks above and holds this zone, the recovery could extend toward $67,000–$68,000. Conversely, if prices continue to face rejection and ETF inflows weaken again, Bitcoin could return to test the area around $62,000, followed by $60,000.”
“In my view, the market does not lack reasons to start buying Bitcoin. What is still missing is a sufficiently strong catalyst – most likely a flow of capital large and persistent enough to turn the current rebound into a genuine trend,”, Massabni concluded.
Bitcoin Price Forecast: BTC could extend gains if it closes above the 50-day EMA
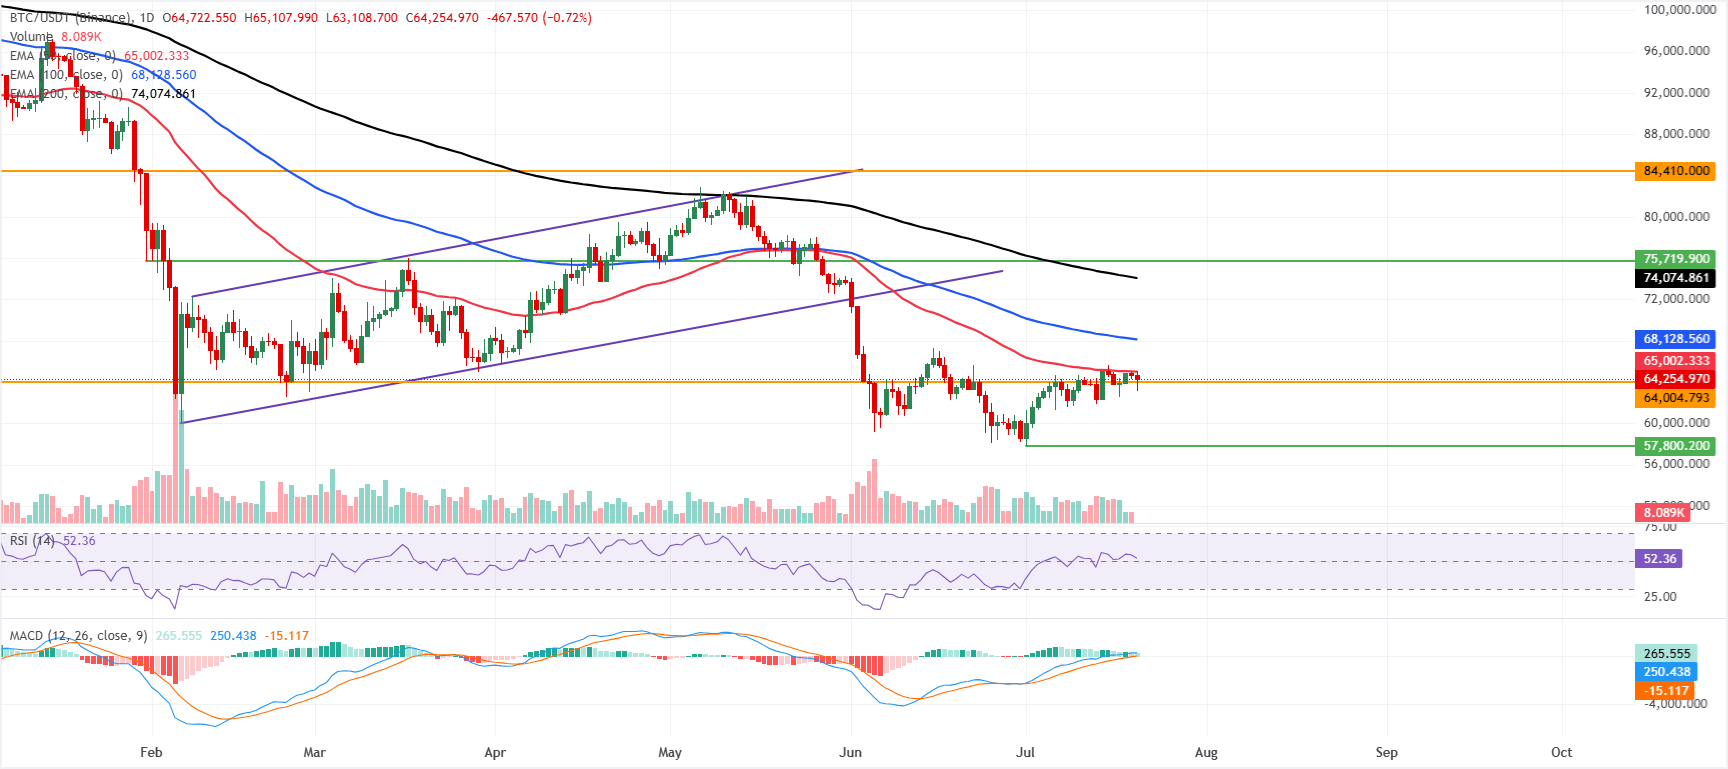
Bitcoin price trades at $64,200 on Monday, holding just above nearby horizontal support around $64,004 but still capped by a dense band of Exponential Moving Averages (EMAs) overhead. The 50-day EMA at roughly $65,000, together with the 100-day and 200-day EMAs higher up at about $68,128 and $74,074, respectively, keeps the broader tone bearish as price continues to consolidate beneath these trend-defining barriers.
The Relative Strength Index (RSI) around 52 stays near neutral territory, while the Moving Average Convergence Divergence (MACD) remains in positive territory but has been losing altitude, which suggests upside momentum is fading rather than accelerating.
On the topside, immediate resistance is seen at the 50-day EMA near $65,000. A daily close above this level would be needed to open a clearer path toward the 100-day EMA around $68,128 and then the 200-day EMA near $74,074, with a more distant horizontal cap emerging near $84,410.
On the downside, immediate support is seen near $64,004, where buyers previously emerged, and a break below this floor would expose further weakness toward the key psychological level at $60,000.
(The technical analysis of this story was written with the help of an AI tool. Know more.)
Bitcoin, altcoins, stablecoins FAQs
Bitcoin is the largest cryptocurrency by market capitalization, a virtual currency designed to serve as money. This form of payment cannot be controlled by any one person, group, or entity, which eliminates the need for third-party participation during financial transactions.
Altcoins are any cryptocurrency apart from Bitcoin, but some also regard Ethereum as a non-altcoin because it is from these two cryptocurrencies that forking happens. If this is true, then Litecoin is the first altcoin, forked from the Bitcoin protocol and, therefore, an “improved” version of it.
Stablecoins are cryptocurrencies designed to have a stable price, with their value backed by a reserve of the asset it represents. To achieve this, the value of any one stablecoin is pegged to a commodity or financial instrument, such as the US Dollar (USD), with its supply regulated by an algorithm or demand. The main goal of stablecoins is to provide an on/off-ramp for investors willing to trade and invest in cryptocurrencies. Stablecoins also allow investors to store value since cryptocurrencies, in general, are subject to volatility.
Bitcoin dominance is the ratio of Bitcoin's market capitalization to the total market capitalization of all cryptocurrencies combined. It provides a clear picture of Bitcoin’s interest among investors. A high BTC dominance typically happens before and during a bull run, in which investors resort to investing in relatively stable and high market capitalization cryptocurrency like Bitcoin. A drop in BTC dominance usually means that investors are moving their capital and/or profits to altcoins in a quest for higher returns, which usually triggers an explosion of altcoin rallies.
추천 기사


