


Crypto Market Overview: Bitcoin nears $65,000 as Pi Network and Pump.fun rebound
- Bitcoin tests a bullish breakout of its 50-day EMA at $65,026 on Monday.
- Pi Network is up over 3% on Monday, extending a bullish rebound for the fourth consecutive day.
- Pump.fun extends gains on Monday following a 20% surge the previous day.
Bitcoin (BTC) remains capped below its 50-day Exponential Moving Average (EMA) around $65,026 on Monday. Pi Network (PI) and Pump.fun (PUMP) show steady recovery on Monday, outperforming other crypto assets over the last 24 hours.
Bitcoin nears key level breakout
Bitcoin maintains a capped tone just under its 50-day Exponential Moving Average (EMA) at $65,026 while remaining well below the 200-day EMA near $74,769. This configuration suggests the broader trend still leans to the downside despite a modest recovery off recent lows.
The Relative Strength Index (RSI) at 55 has edged into positive territory, and the Moving Average Convergence Divergence (MACD) histogram stays in the positive zone with its signal line, hinting at improving momentum, yet price action remains constrained beneath $65,000.
On the topside, immediate resistance is seen at the 50-day EMA around $65,026, with additional supply aligning higher at the $70,000 round figure and the 200-day EMA near $74,769.
On the downside, the next significant support sits at the horizontal level of 60,000, where buyers previously emerged, and a sustained break below that floor would likely reopen a deeper corrective phase despite the current momentum uptick.
Pi Network hints at a bullish trend reversal
Pi Network shows a steady recovery trend, extending for the fourth consecutive day on Monday. PI extends a positive rebound within a falling channel pattern, testing to reclaim the 127.2% Fibonacci extension at $0.09613, measured from $0.1998 to $0.1183. The dominant structure remains bearish, with the overhead trendline near $0.1060, which could cap the upside.
The MACD has crossed back above its signal line in negative territory and flipped the histogram positive, hinting at a tentative easing of downside momentum. The RSI near 43 stays below the midline, but the rebound from the oversold zone reflects modest improvement in momentum.
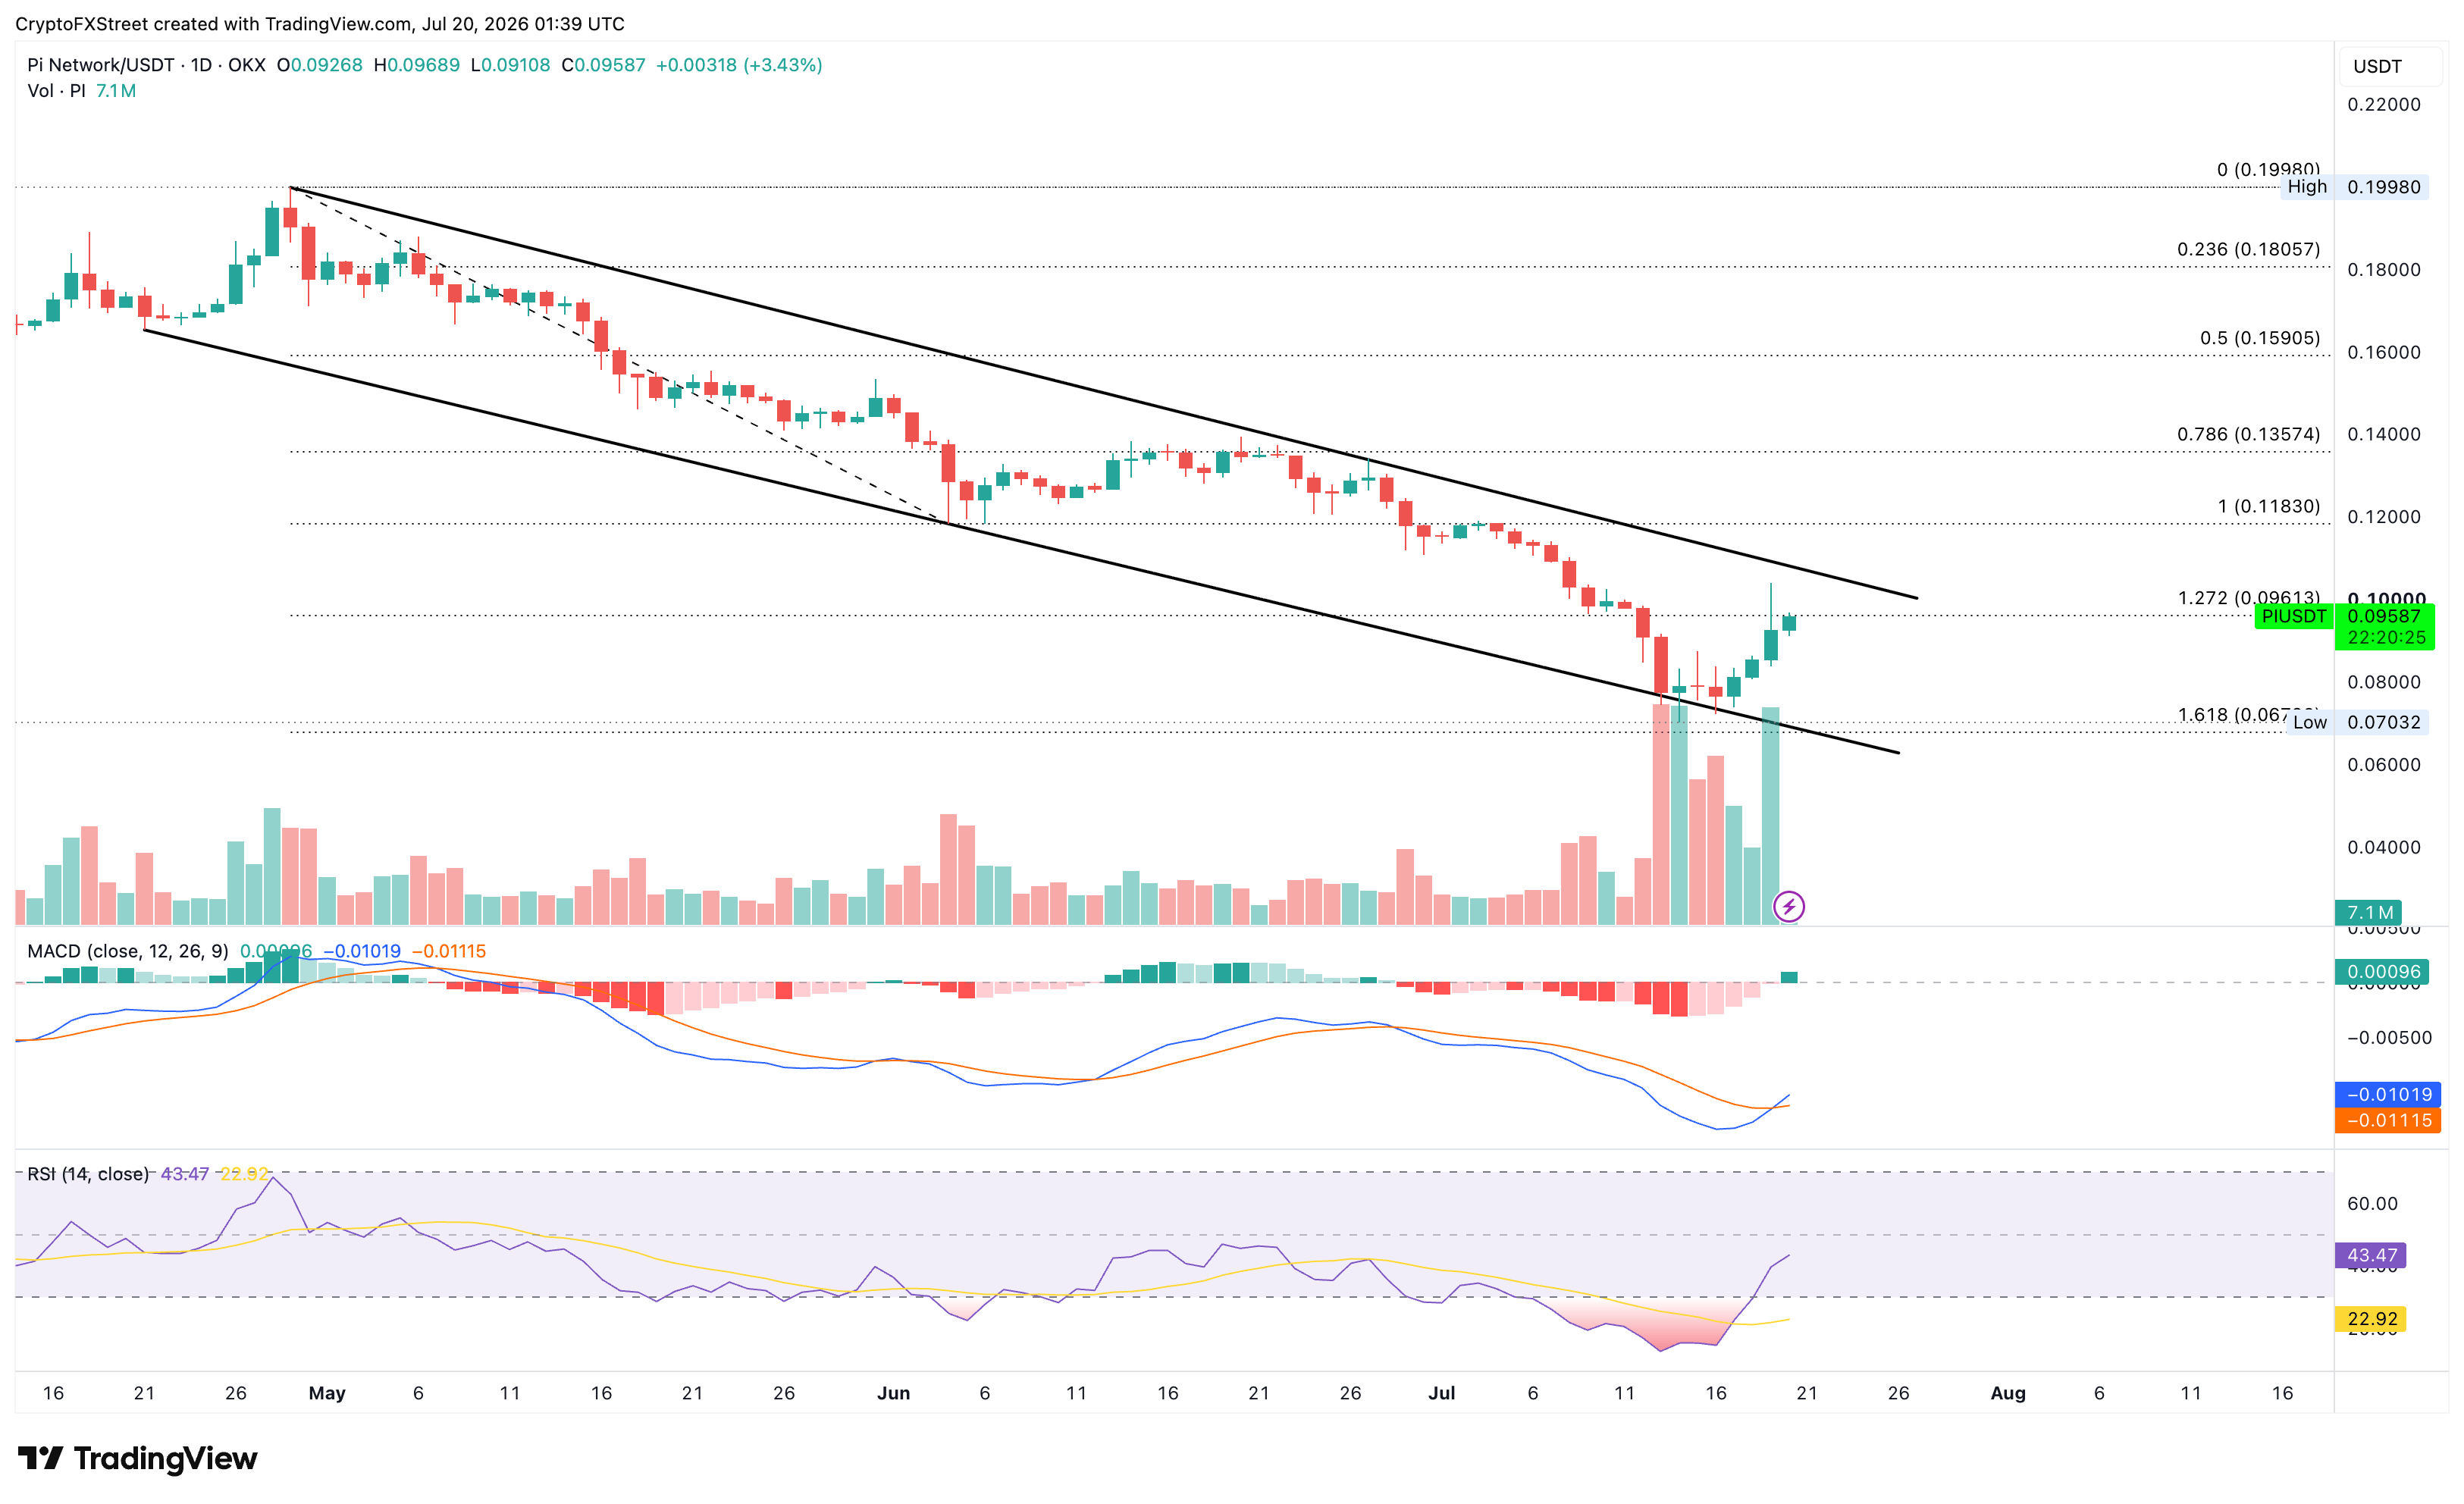
As long as PI/USD trades below both these moving averages, rallies are likely to face supply into these zones, and the broader technical picture would remain vulnerable to renewed downside pressure on failures ahead of $0.1153.
Pump.fun gains bullish momentum
Pump.fun hovers near the $0.002000 mark on Monday, following a 20% jump the previous day. PUMP maintains a constructive near-term bias, with over 35% gains last week and reclaiming both the 50-day and 200-day EMAs at $0.001597 and $0.001915, respectively.
The recovery targets the previous swing high near $0.002251, followed by the 127.2% Fibonacci extension level at $0.002700, calculated from the $0.00251 to $0.001153 downswing.
The RSI near 71 signals overbought conditions, despite a firm positive trend in the MACD and signal lines, which hint at sustained upside momentum.
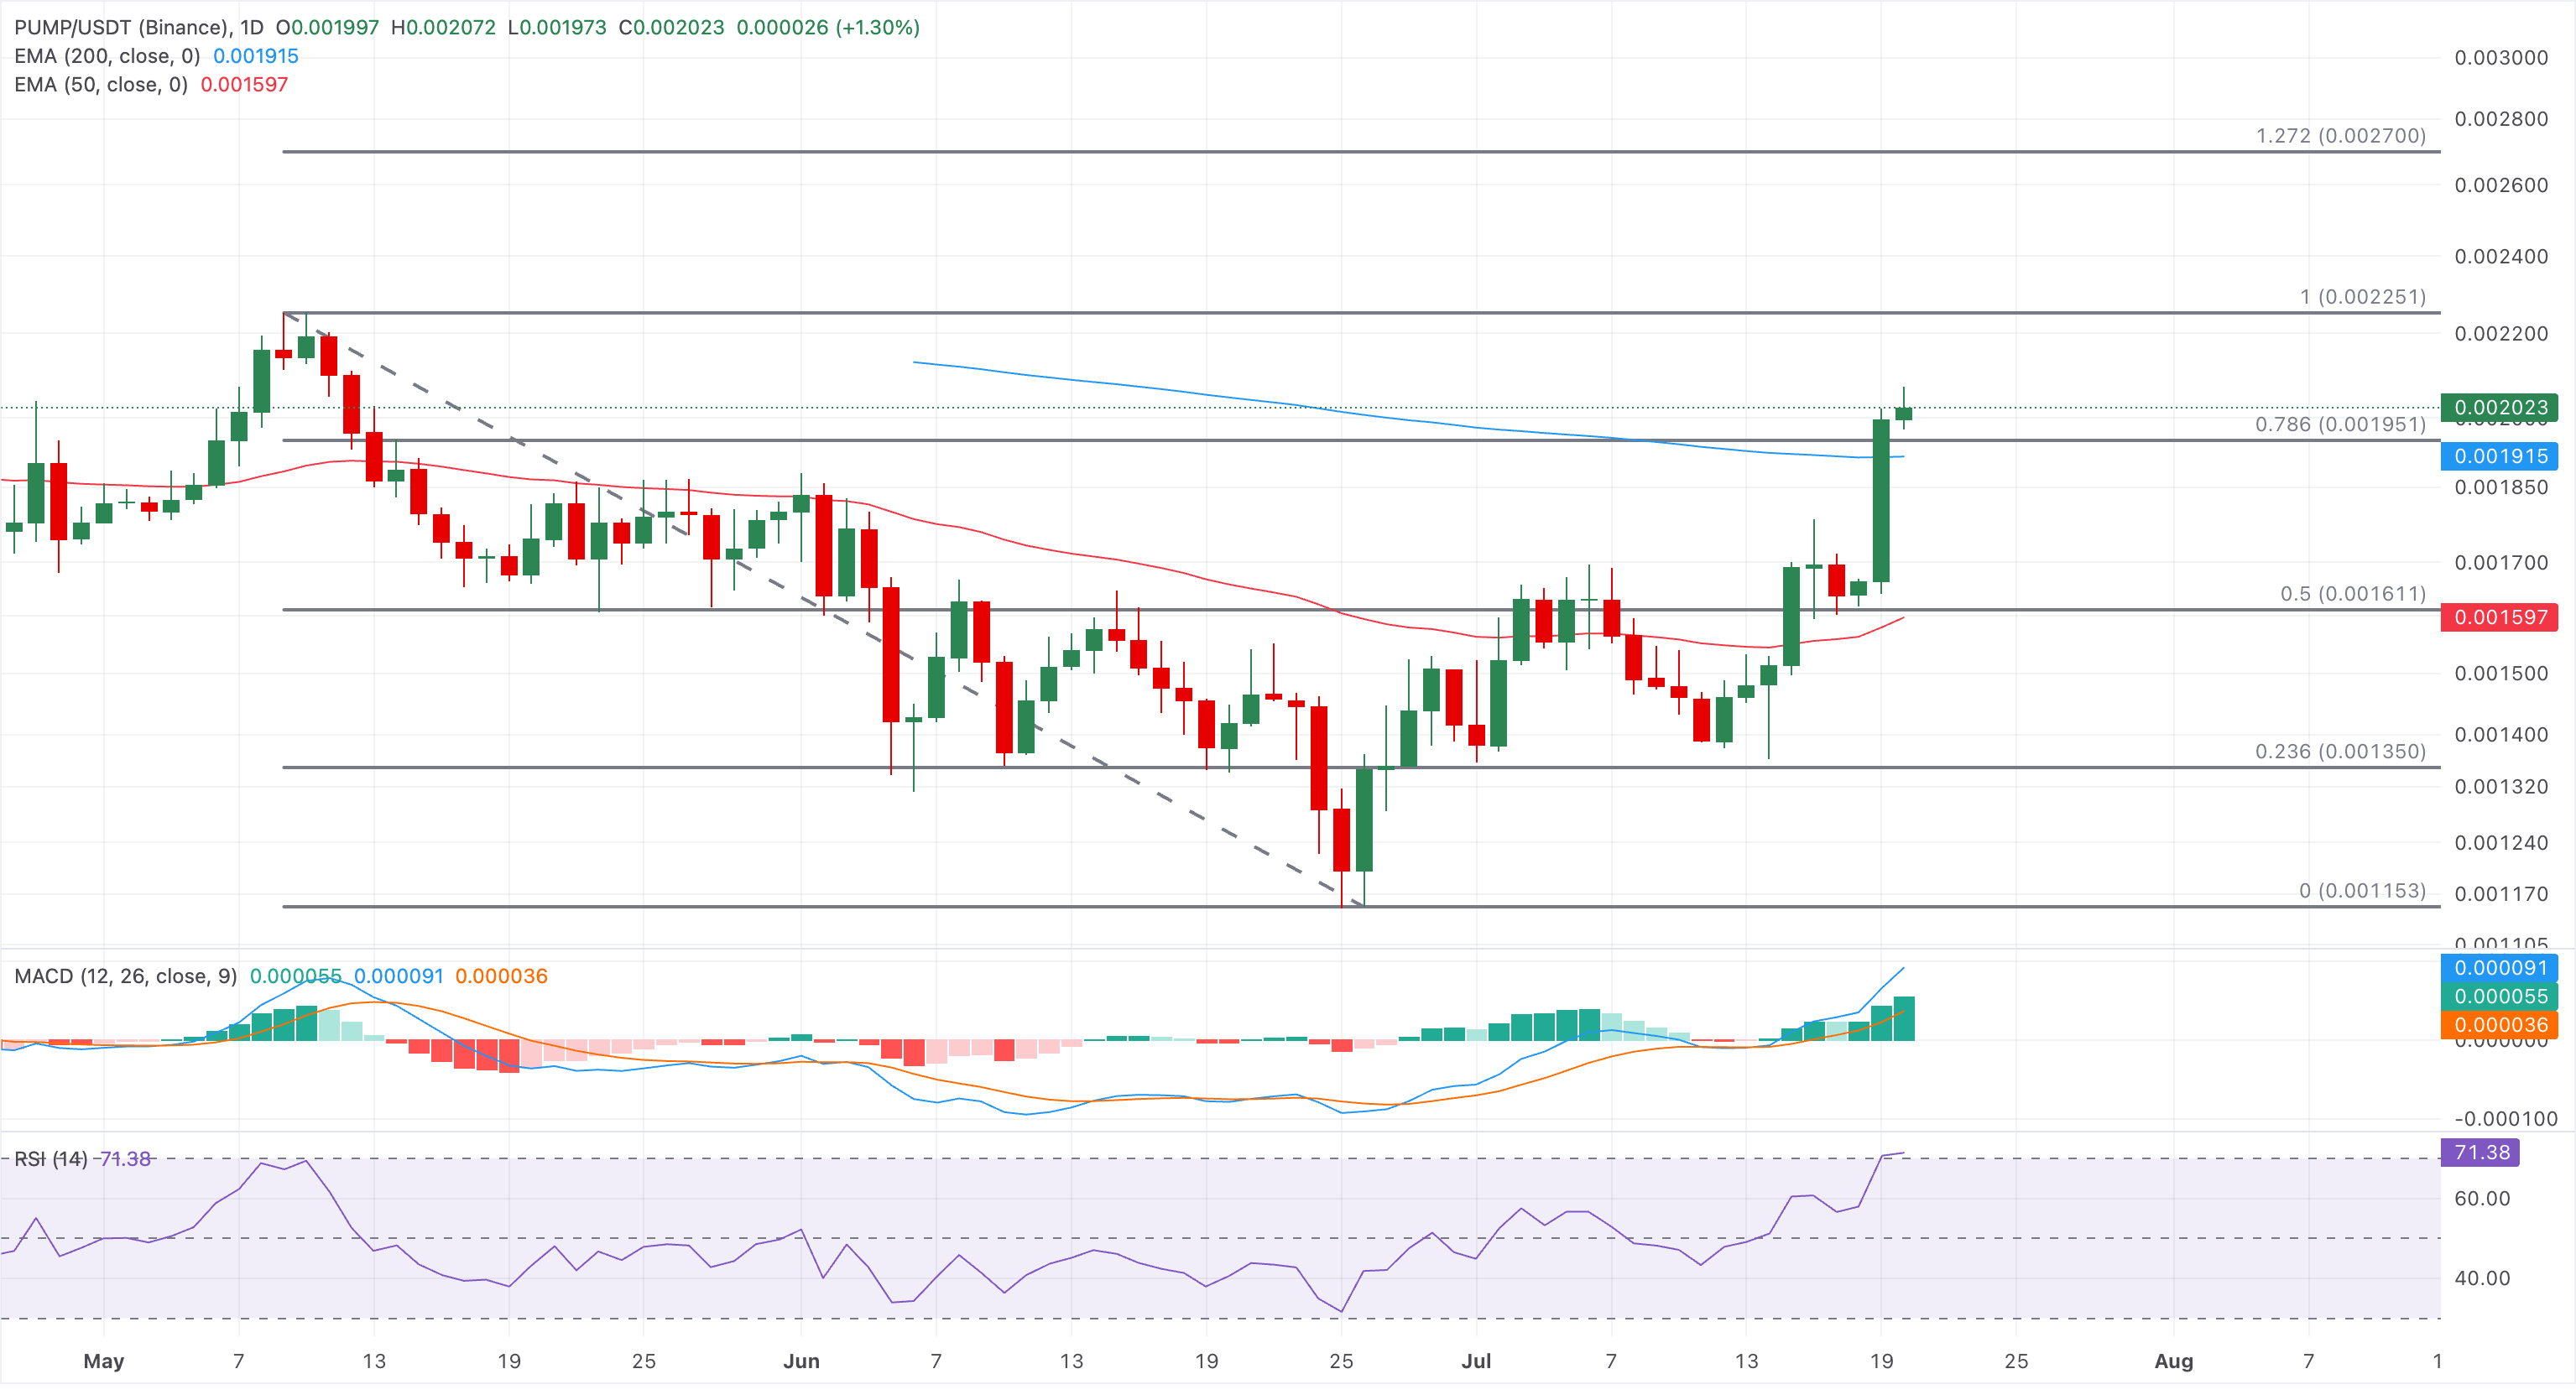
On the downside, initial support is provided by the 200-day EMA at $0.001915, followed by the 78.6% retracement at $0.001951 and the 50% level at $0.001611.
(The technical analysis of this story was written with the help of an AI tool. Know more.)
추천 기사


