


Crypto Today: Bitcoin, Ethereum, XRP edge lower as risk-off sentiment weighs amid escalating US-Iran tensions
- Bitcoin extends its decline for a third consecutive day amid intensifying selling and growing US-Iran tensions.
- Ethereum sellers maintain dominance following President Trump's statement that he will not be rushed into a peace deal with Iran.
- XRP slides below $1.30 for the first time since early April as momentum indicators continue to weaken.
Cryptocurrency prices are extending a broader sell-off on Thursday amid growing tensions between the United States (US) and Iran. Bitcoin (BTC) exhibits technical weakness, trading around $73,353 on the third consecutive day of declines. Altcoins, including Ethereum (ETH) and Ripple (XRP), remain under pressure with ETH hovering below $2,200 and XRP below $1.30.
Risk-averse sentiment builds on rising geopolitical tensions
The US and Iran are actively exchanging fire, weighing on market sentiment. Iran said on Thursday that it targeted an American base in response to US attacks, which it referred to as a “blatant violation” of both the fragile ceasefire between the two nations and international law.
Iran's State TV reported on Wednesday that the unofficial framework of the Memorandum of Understanding (MOU) with the US had been finalized, resolving that the US would withdraw its military forces from the vicinity of Iran and lift the naval blockade. Iran said it had committed to restoring the number of commercial transit ships through the Hormuz Strait to pre-war levels within one month. However, US President Donald Trump said he will not be rushed into making a deal, suggesting that a peace agreement was not close.
Investor optimism weakened further amid reports that the US military had downed Iranian drones and a launch site around the Strait of Hormuz. Although the US described the attacks as self-defense, Iran retaliated by targeting the American base.
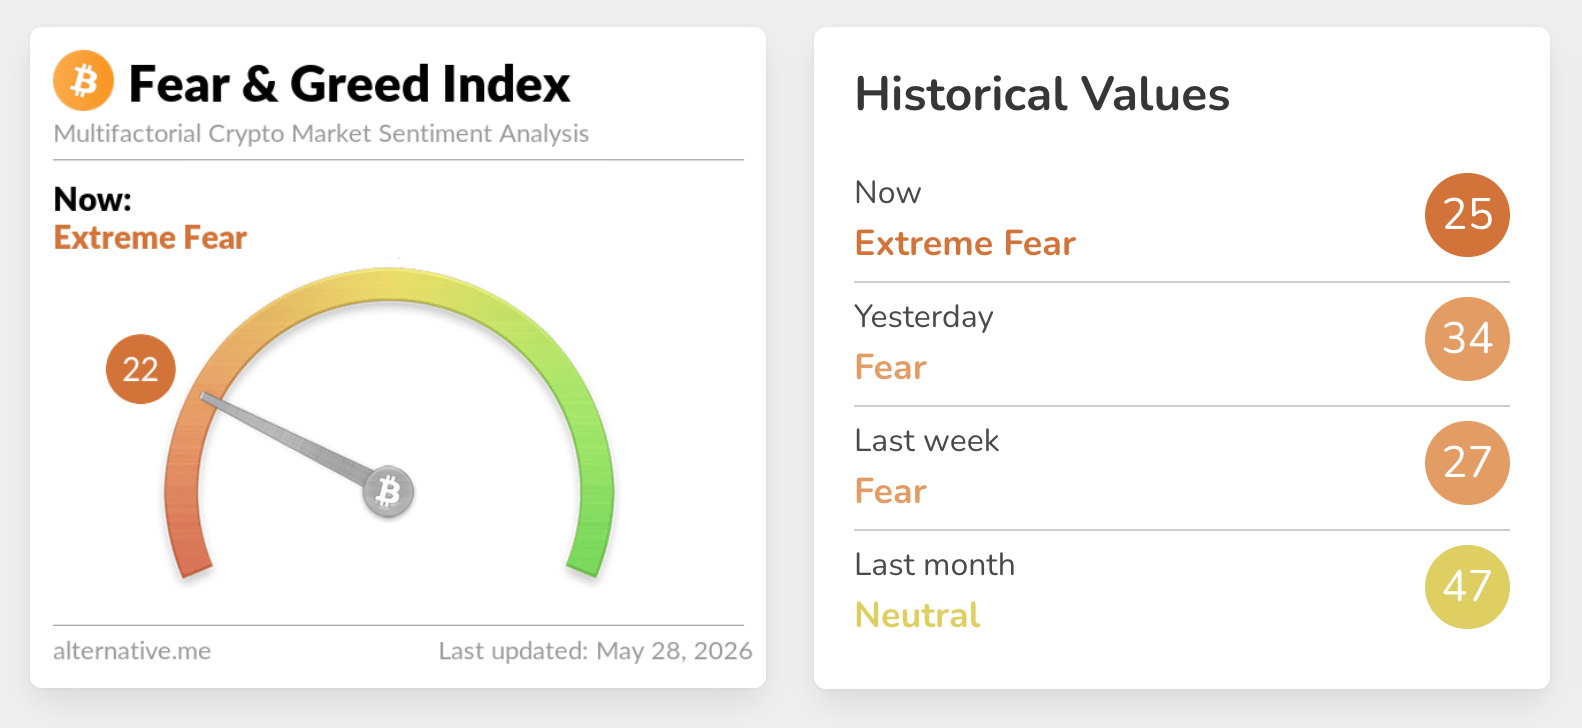
Appetite for crypto assets continues to fade, as reflected in the Fear & Greed Index, which fell to 22 in the Extreme Fear territory on Thursday, down from 25 the day before. If sentiment remains weak, it would be difficult to uphold price increases, raising the odds of a persistent sell-off.
Price analysis: Bitcoin pressured as technical structure weakens
Bitcoin trades at $73,353, keeping a bearish near-term bias as the price holds below the 50-day, 100-day and 200-day Exponential Moving Averages (EMAs). The clustering of the 50-day EMA around $76,535 and the 100-day EMA near $76,748 suggests that the recent rebound is occurring within a broader corrective phase, while the 200-day EMA up at $81,350 reinforces a higher cap.
Momentum remains fragile, with the Relative Strength Index (RSI) hovering near 35 on the daily chart and the Moving Average Convergence Divergence (MACD) histogram extending further below both its signal line and the zero mark, hinting that downside pressure has not fully abated despite short-term bounces.
-1779960666084.png)
On the topside, immediate resistance is seen at the 50-day EMA around $76,535, followed by the 100-day EMA at roughly $76,748, where sellers are likely to defend the current range. A sustained break above these levels would be needed to ease the bearish tone and expose the 200-day EMA near $81,350 as the next hurdle. On the downside, the broken support trend line, with a break area around $70,671, acts as the first key floor. A daily close below this zone would open the way toward deeper retracements, with any subsequent violation likely to confirm that the broader uptrend has lost traction.
Altcoins technical outlook: Ethereum and XRP falter as selling intensifies
Ethereum trades around $1,990, keeping a bearish near-term bias as price sits below the 50-day, 100-day and 200-day Exponential Moving Averages (EMAs), with the 50-day EMA now capping around $2,200. The SuperTrend indicator also runs above spot near $2,222, reinforcing the overhead supply zone, while MACD histogram remains in negative territory on the daily chart and the RSI hovers around 30, hinting at persistent downside pressure albeit in oversold conditions.
-1779960694032.png)
On the topside, initial resistance is seen at the 50-day EMA near $2,200, followed by the SuperTrend barrier around $2,222 and then the 100-day EMA close to $2,282, with the 200-day EMA near $2,521 acting as a broader cap while price trades beneath all of them. On the downside, the next notable cushion aligns with the rising trendline support coming from prior lows around $1,737, where buyers could attempt to slow the decline if the current weakness extends.
XRP, on the other hand, trades around $1.29, extending a bearish near-term bias as price holds below the reclaimed trendline break at $1.31 and all three key moving averages. The 50-day EMA at $1.39, clustered with the SuperTrend at $1.43 and the 100-day EMA at $1.46, reinforces a dense overhead supply zone, while the 200-day EMA higher up at $1.67 keeps the broader structure capped.
Momentum remains weak, with the RSI hovering above 33 on the daily chart and MACD histogram in negative territory, suggesting downside pressure is still dominant despite the market slipping toward oversold conditions.
-1779960710386.png)
On the topside, initial resistance emerges at the former support trendline break around $1.31. A sustained recovery above this pivot would be needed to ease immediate selling pressure. Beyond that, the 50-day EMA near $1.39, the SuperTrend line at $1.43 and the 100-day EMA at $1.46 form successive barriers before the larger bearish context defined by the 200-day EMA at $1.67 comes into play. If the sell-off persists, XRP could seek support at $1.25 with further decline likely to confirm a broader bearish trend.
(The technical analysis of this story was written with the help of an AI tool.)
Bitcoin, altcoins, stablecoins FAQs
Bitcoin is the largest cryptocurrency by market capitalization, a virtual currency designed to serve as money. This form of payment cannot be controlled by any one person, group, or entity, which eliminates the need for third-party participation during financial transactions.
Altcoins are any cryptocurrency apart from Bitcoin, but some also regard Ethereum as a non-altcoin because it is from these two cryptocurrencies that forking happens. If this is true, then Litecoin is the first altcoin, forked from the Bitcoin protocol and, therefore, an “improved” version of it.
Stablecoins are cryptocurrencies designed to have a stable price, with their value backed by a reserve of the asset it represents. To achieve this, the value of any one stablecoin is pegged to a commodity or financial instrument, such as the US Dollar (USD), with its supply regulated by an algorithm or demand. The main goal of stablecoins is to provide an on/off-ramp for investors willing to trade and invest in cryptocurrencies. Stablecoins also allow investors to store value since cryptocurrencies, in general, are subject to volatility.
Bitcoin dominance is the ratio of Bitcoin's market capitalization to the total market capitalization of all cryptocurrencies combined. It provides a clear picture of Bitcoin’s interest among investors. A high BTC dominance typically happens before and during a bull run, in which investors resort to investing in relatively stable and high market capitalization cryptocurrency like Bitcoin. A drop in BTC dominance usually means that investors are moving their capital and/or profits to altcoins in a quest for higher returns, which usually triggers an explosion of altcoin rallies.
추천 기사


