

Crypto Today: Bitcoin, Ethereum, XRP tick up as optimism builds for US-Iran peace deal
- Bitcoin advances for the second consecutive day and hovers around $78,000, backed by hopes that US-Iran negotiations are in the final stages.
- Ethereum gradually gains momentum above $2,100 as sentiment in the broader cryptocurrency market mildly rises.
- XRP edges higher toward the $1.40 pivotal threshold, building on a marginal improvement in momentum indicators.
The cryptocurrency market remains calm on Thursday, with prices broadly increasing. Bitcoin (BTC) hovers above $78,000, advancing from $76,000 support. Altcoins, including Ethereum (ETH) and Ripple (XRP), are gaining momentum, albeit gradually, with ETH trading at $2,136 and XRP at $1.38.
US-Iran edge closer to a peace deal
United States (US) President Donald Trump said on Wednesday that negotiations with Iran were in the final stages but needed to wait a few days to “get the right answers.” Meanwhile, according to Al Jazeera, Iranian state media said on Thursday that the country’s Ministry of Foreign Affairs is reviewing a US proposal to end the war received via Pakistan, the mediator.
Iran’s President Masoud Pezeshkian said the country was open to a diplomatic solution. However, Iran’s Revolutionary Guards also warned in a statement, "if aggression against Iran is repeated, the promised regional war will extend beyond the region this time.” At the same time, Trump maintains that the situation could escalate quickly if Iran fails to make a deal.
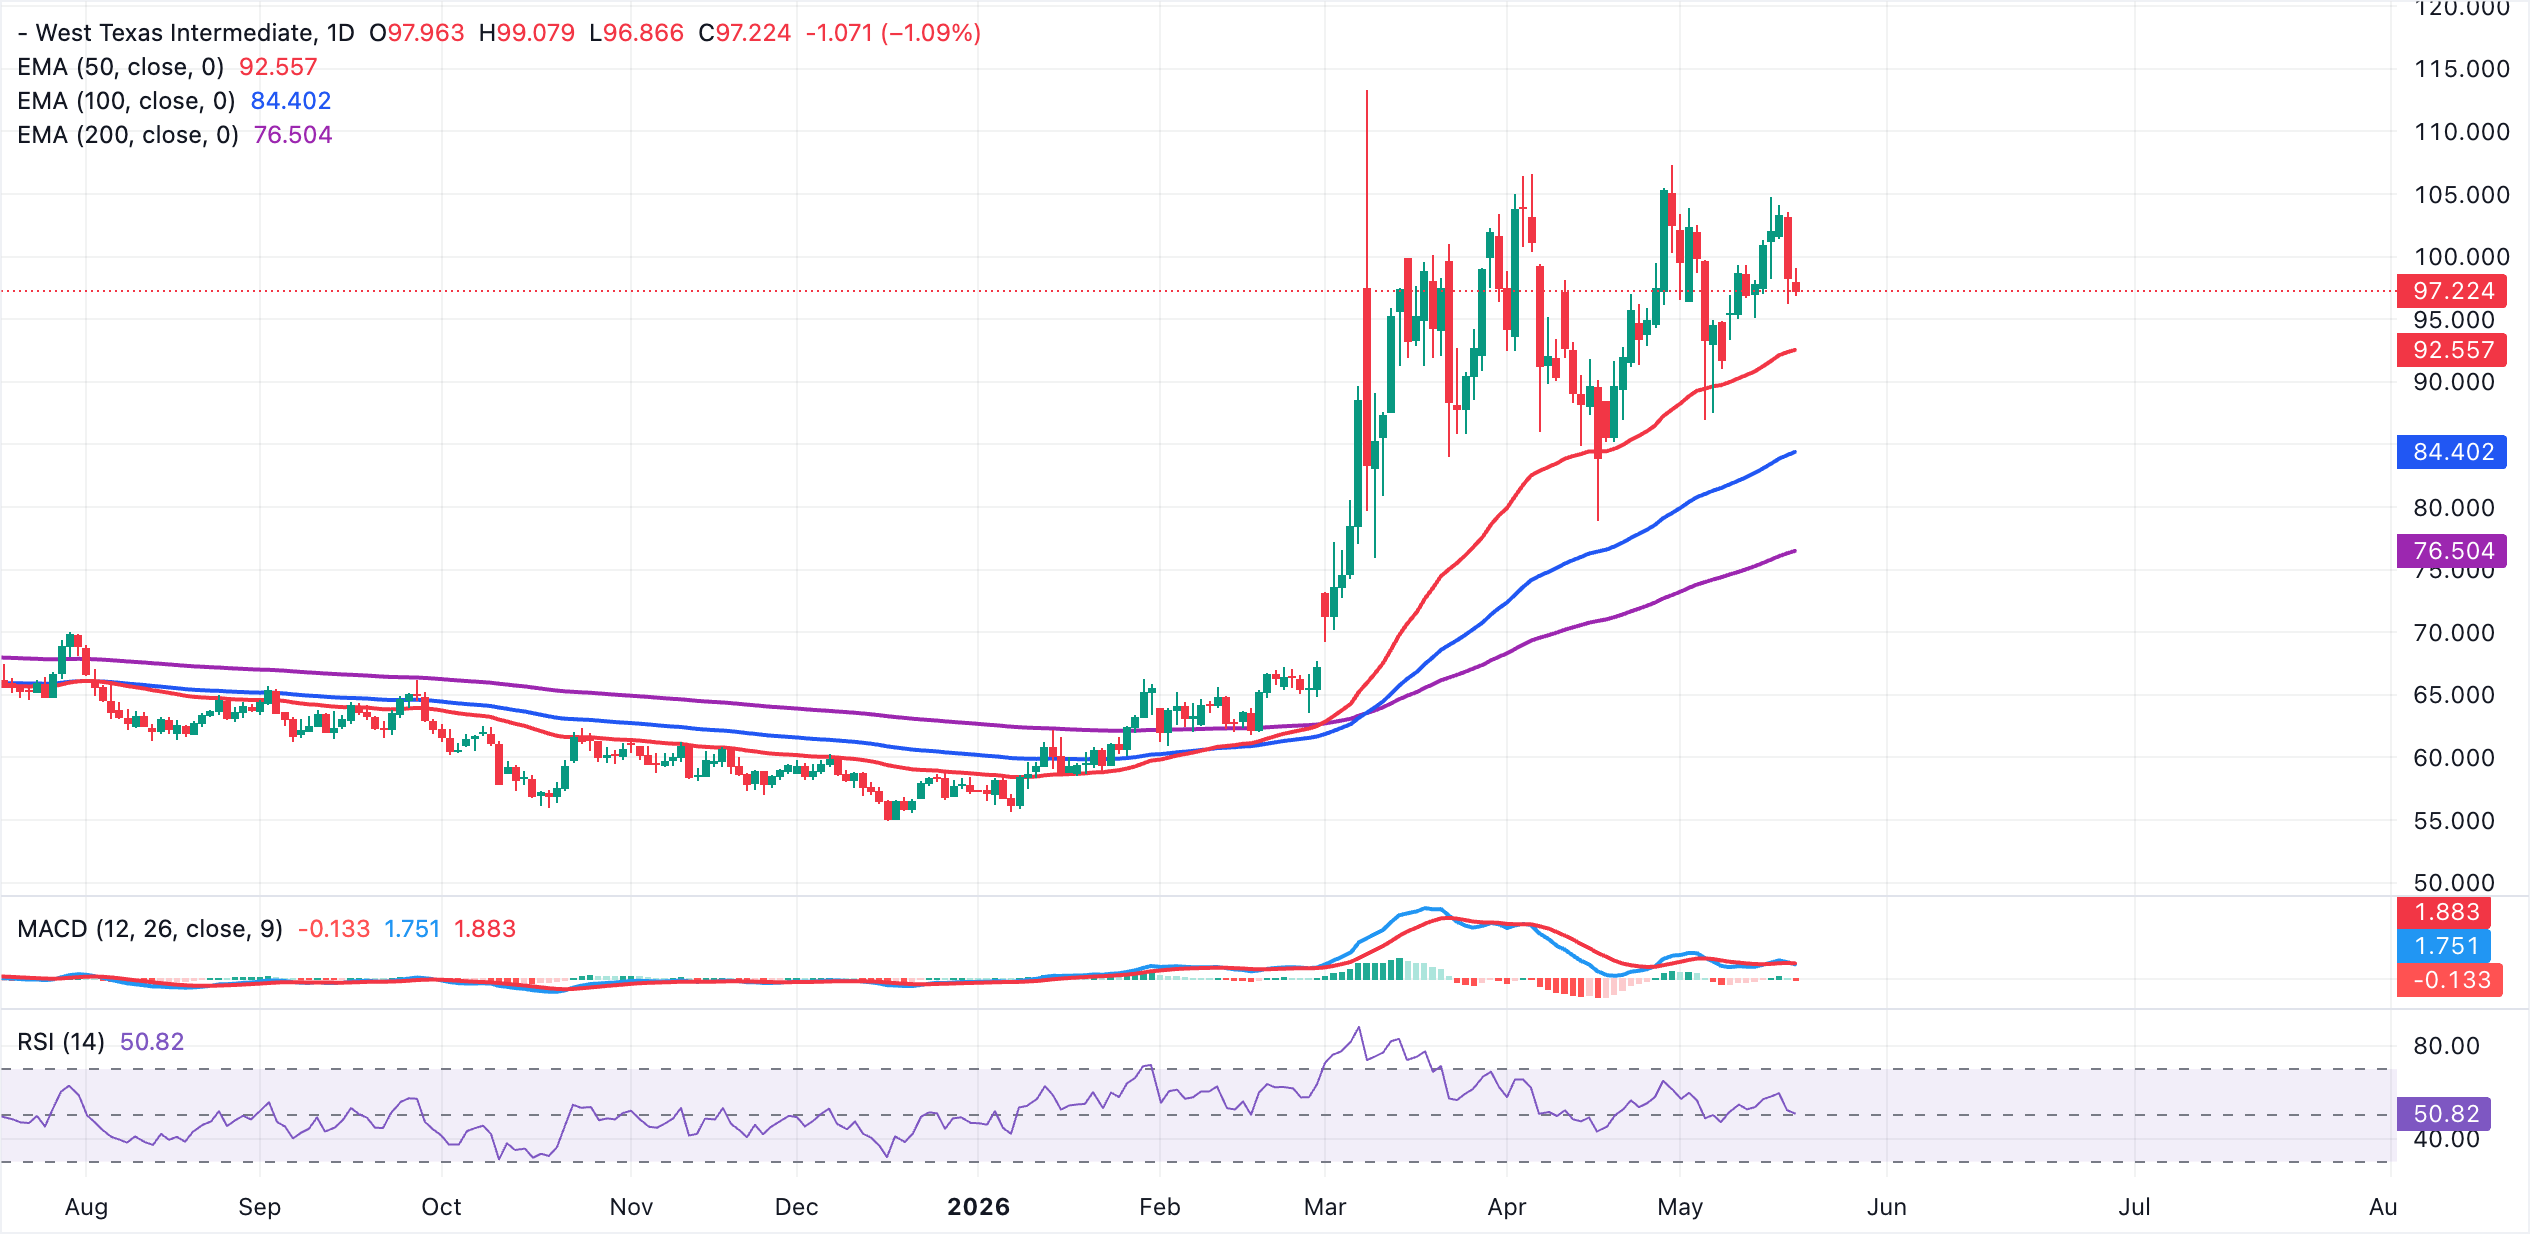
Overall, global markets appear cautiously optimistic that a diplomatic solution could prevail and end the war that has disrupted Oil and Gas supplies. For instance, the West Texas Intermediate (Oil) prices have moderated to $97 on Thursday, after climbing above $104 on Monday.
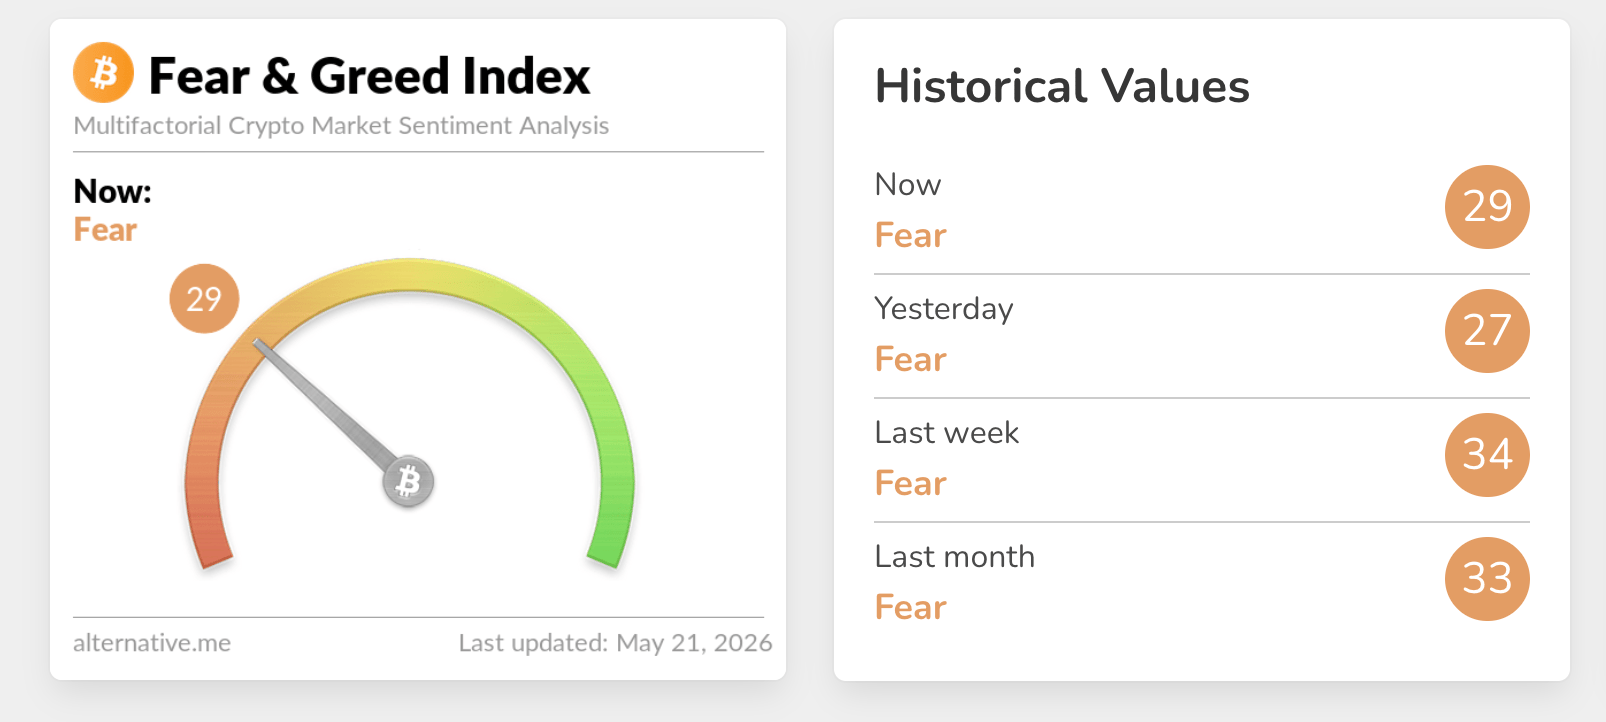
Sentiment in the broader crypto market shows signs of improvement, as evidenced by the Fear & Greed Index lifting to 29 in the Fear Territory on Thursday, up from 27 the day before. An uptick in this metric typically reflects improving investor sentiment, thereby increasing the likelihood of continued market momentum.
Price analysis: Bitcoin rebounds above $78,000
Bitcoin trades around $78,000, holding a mildly bullish near-term bias as it consolidates above the 50-day and 100-day Exponential Moving Averages (EMAs) at $76,820 and $76,904 respectively. This configuration suggests underlying dip-buying interest, even as the pair remains capped below the 200-day EMA at $81,671, which defines the next significant topside hurdle.
The Relative Strength Index (RSI around 49 points to neutral momentum on the daily chart, while the negative Moving Average Convergence Divergence (MACD) histogram hints that recovery attempts may remain gradual unless buyers can regain traction toward the 200-day EMA.
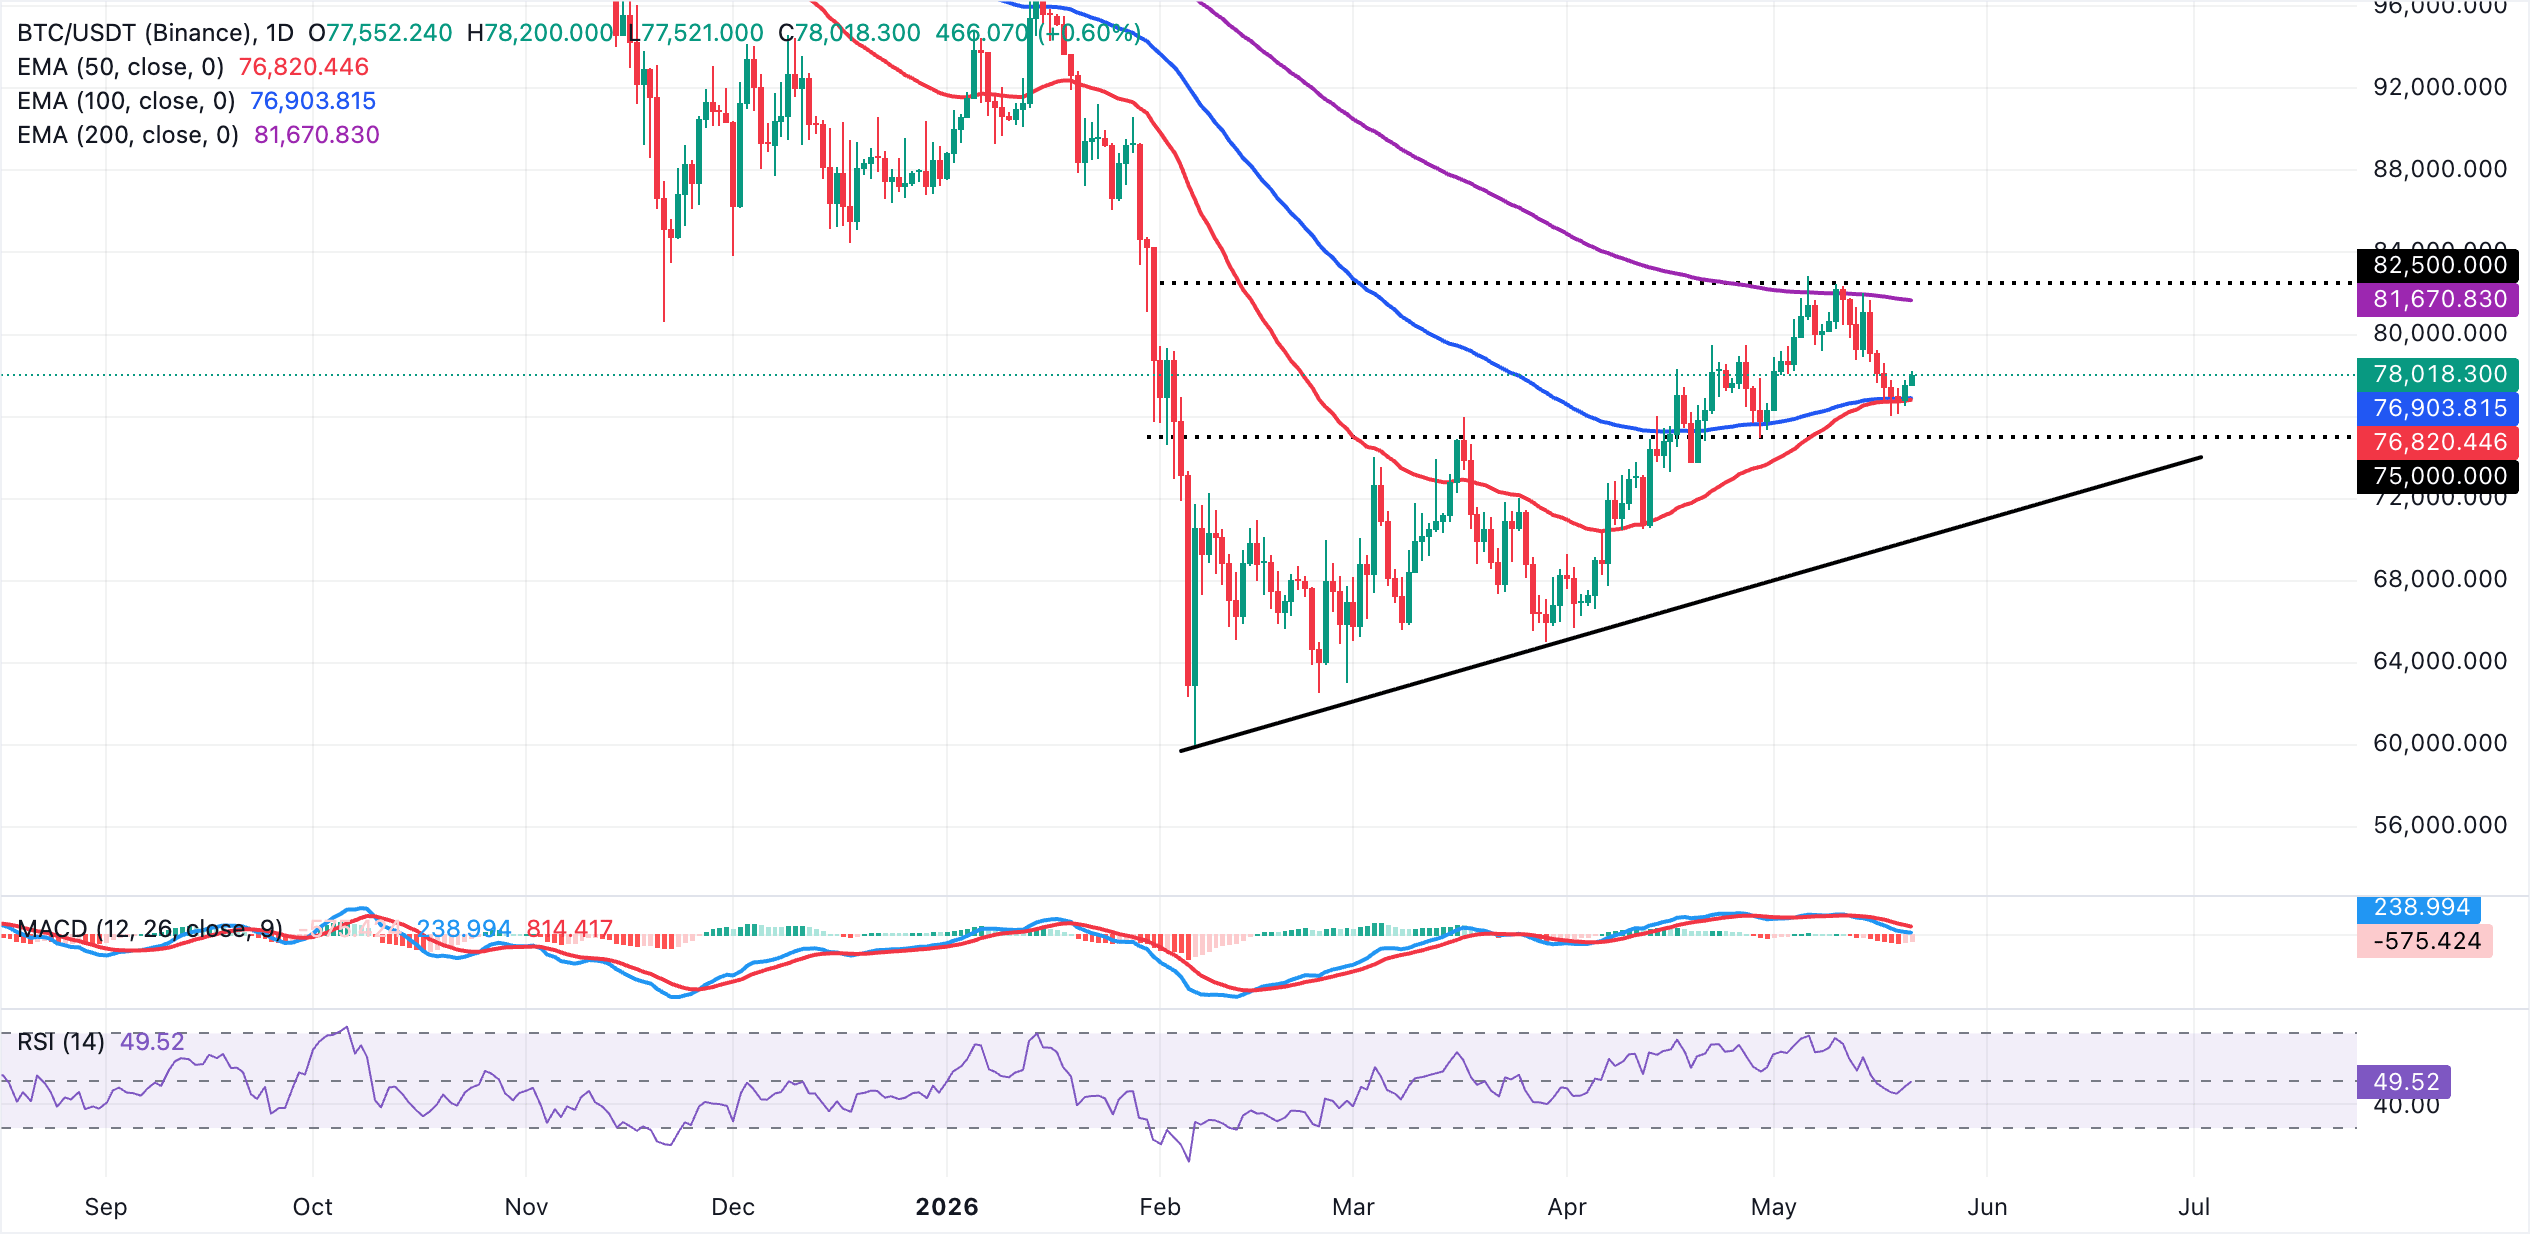
On the downside, initial support is reinforced by the 100-day and 50-day EMAs clustered just under $77,000, ahead of the more distant rising trendline around $69,992. A daily close below this EMA cluster would weaken the constructive tone and open the door to a deeper correction toward that broader uptrend base. On the topside, bulls face initial resistance at the 200-day EMA near $81,670. A sustained break above this barrier would strengthen the bullish structure and expose higher highs toward the recent record zone.
Altcoins technical outlook: Ethereum and XRP eye short-term recovery
Ethereum trades at $2,140 with a bearish near-term bias as price holds below the 50-day, 100-day and 200-day EMAs clustered between roughly $2,245 and $2,535. The pair is attempting to stabilize above an earlier upward trendline area around $2,059, but downside pressure remains dominant, with the RSI hovering just below the neutral 50 mark on the daily chart and the MACD histogram entrenched in negative territory, which together suggest that rebounds are likely to be sold while these overhead EMAs cap the upside.
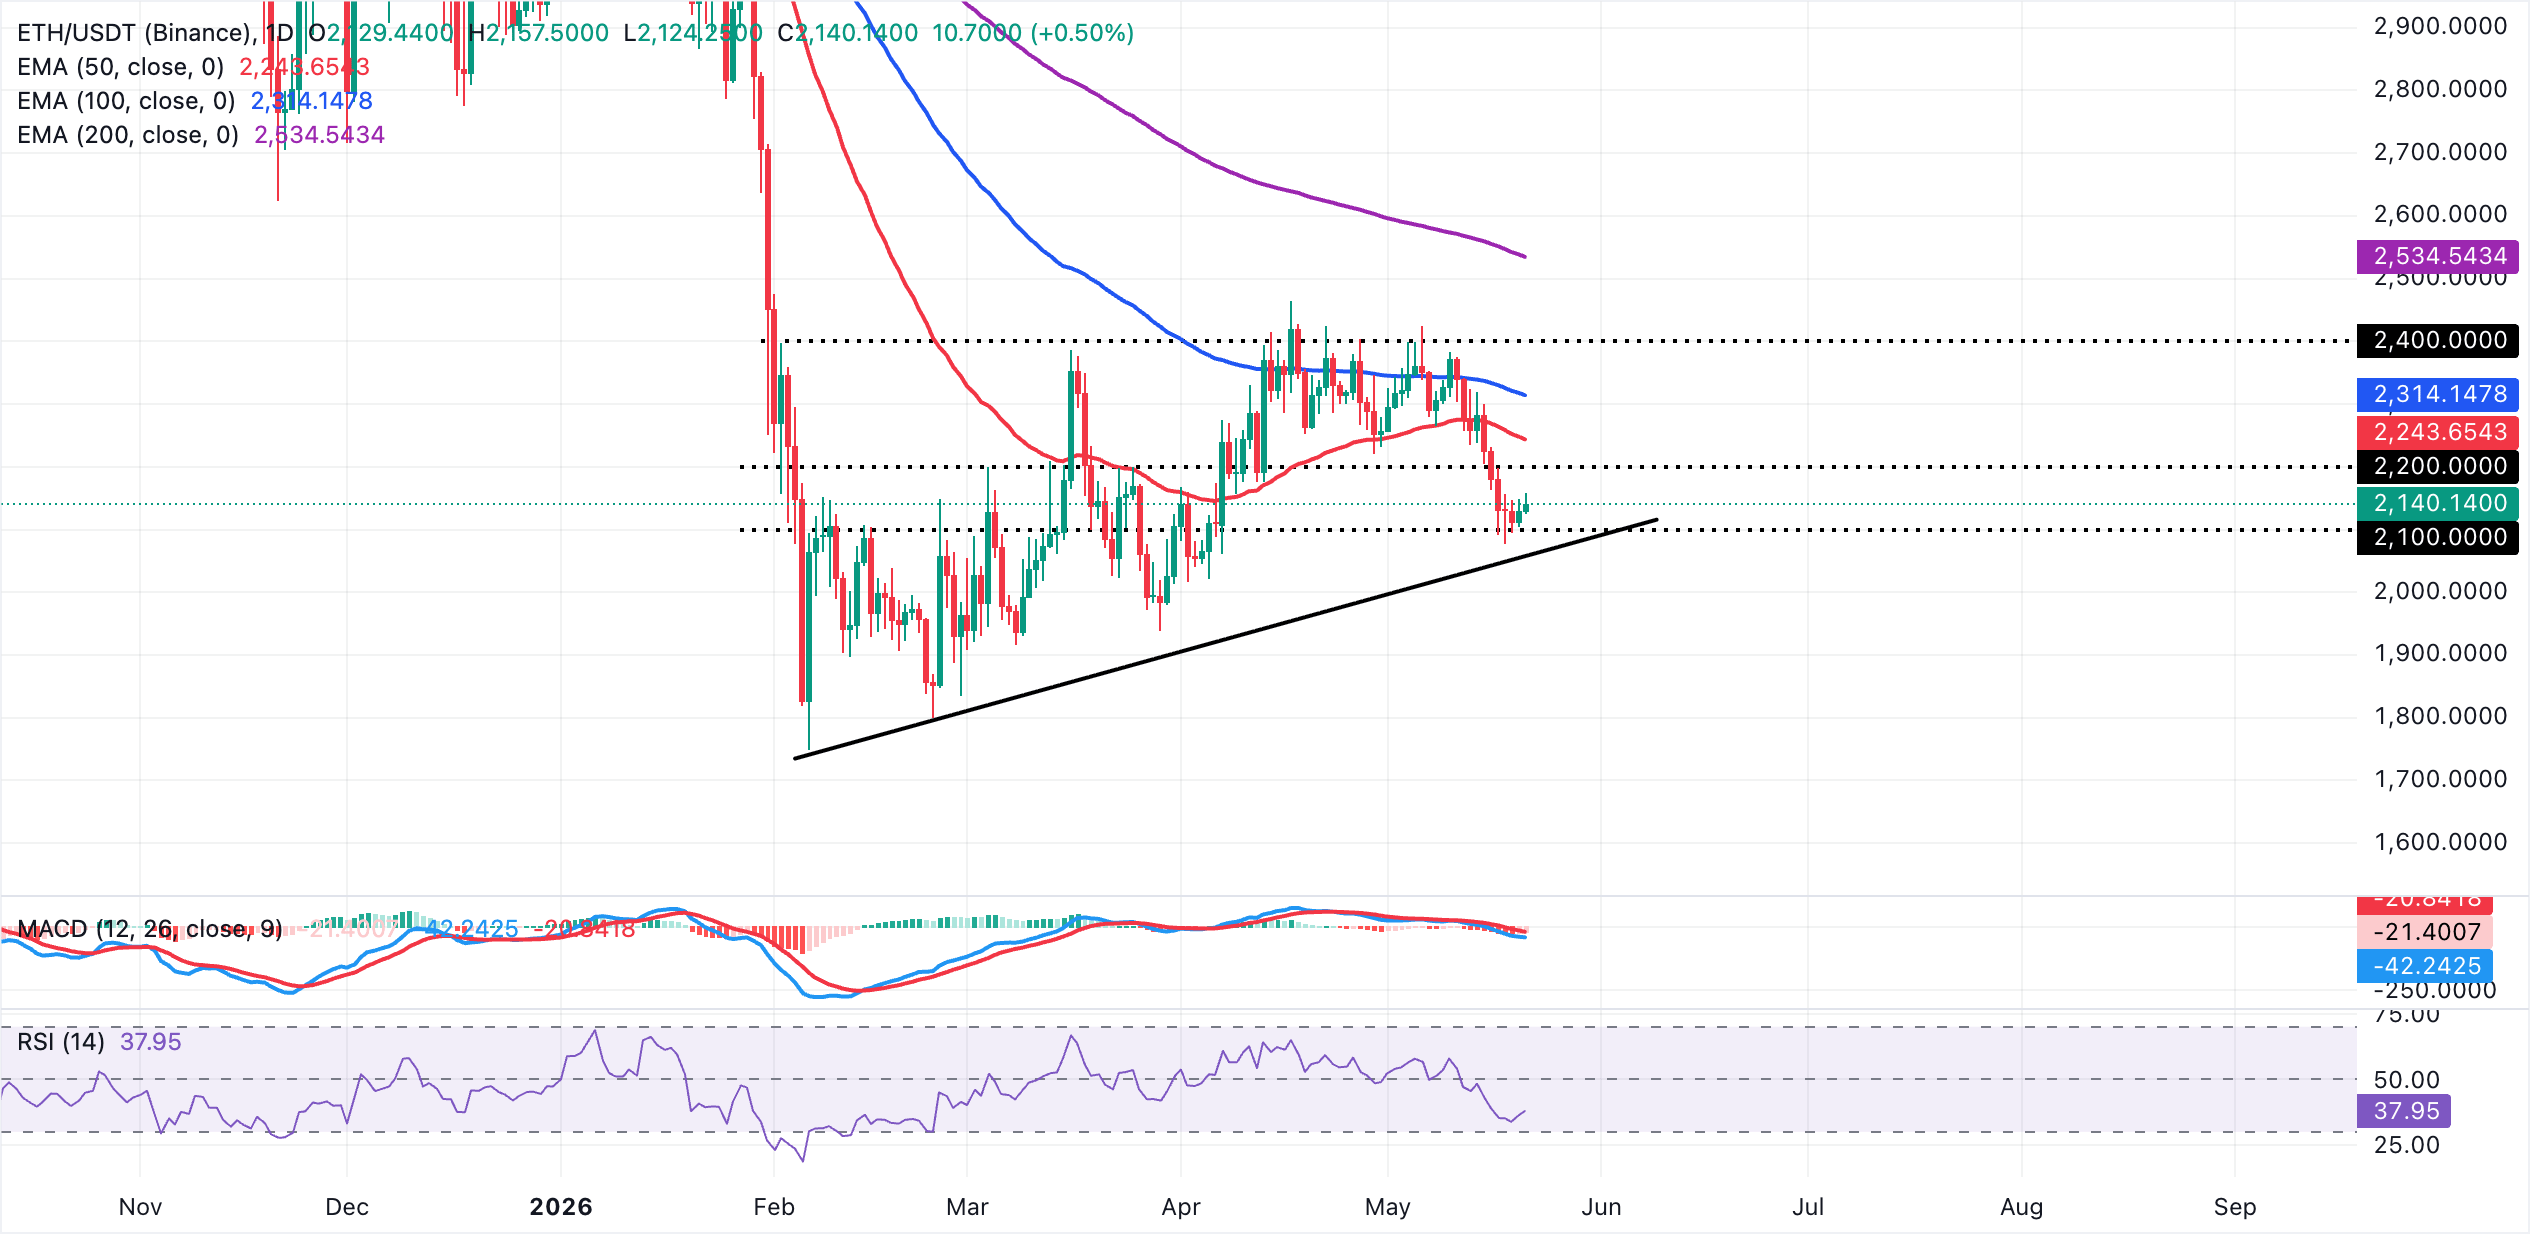
On the topside, initial resistance is seen at the 50-day EMA near $2,244, followed by the 100-day EMA around $2,314 and then the more distant 200-day EMA close to $2,535, where a sustained break would be needed to ease the prevailing bearish tone. On the downside, the first notable support emerges in the $2,060 area, defined by the prior upward trendline support and break zone, and a clear loss of this floor would expose ETH to a deeper slide toward lower swing lows on the daily chart.
XRP trades at $1.38, holding a bearish near-term bias as price sits beneath the 50-, 100- and 200-day EMAs clustered from around $1.41 to $1.70. The recent break below the rising support trendline, now acting as resistance at $1.40 , suggests the prior uptrend has given way to a corrective phase, while the RSI near 45 on the daily chart and a negative MACD reading reinforce soft downside momentum rather than an oversold market.
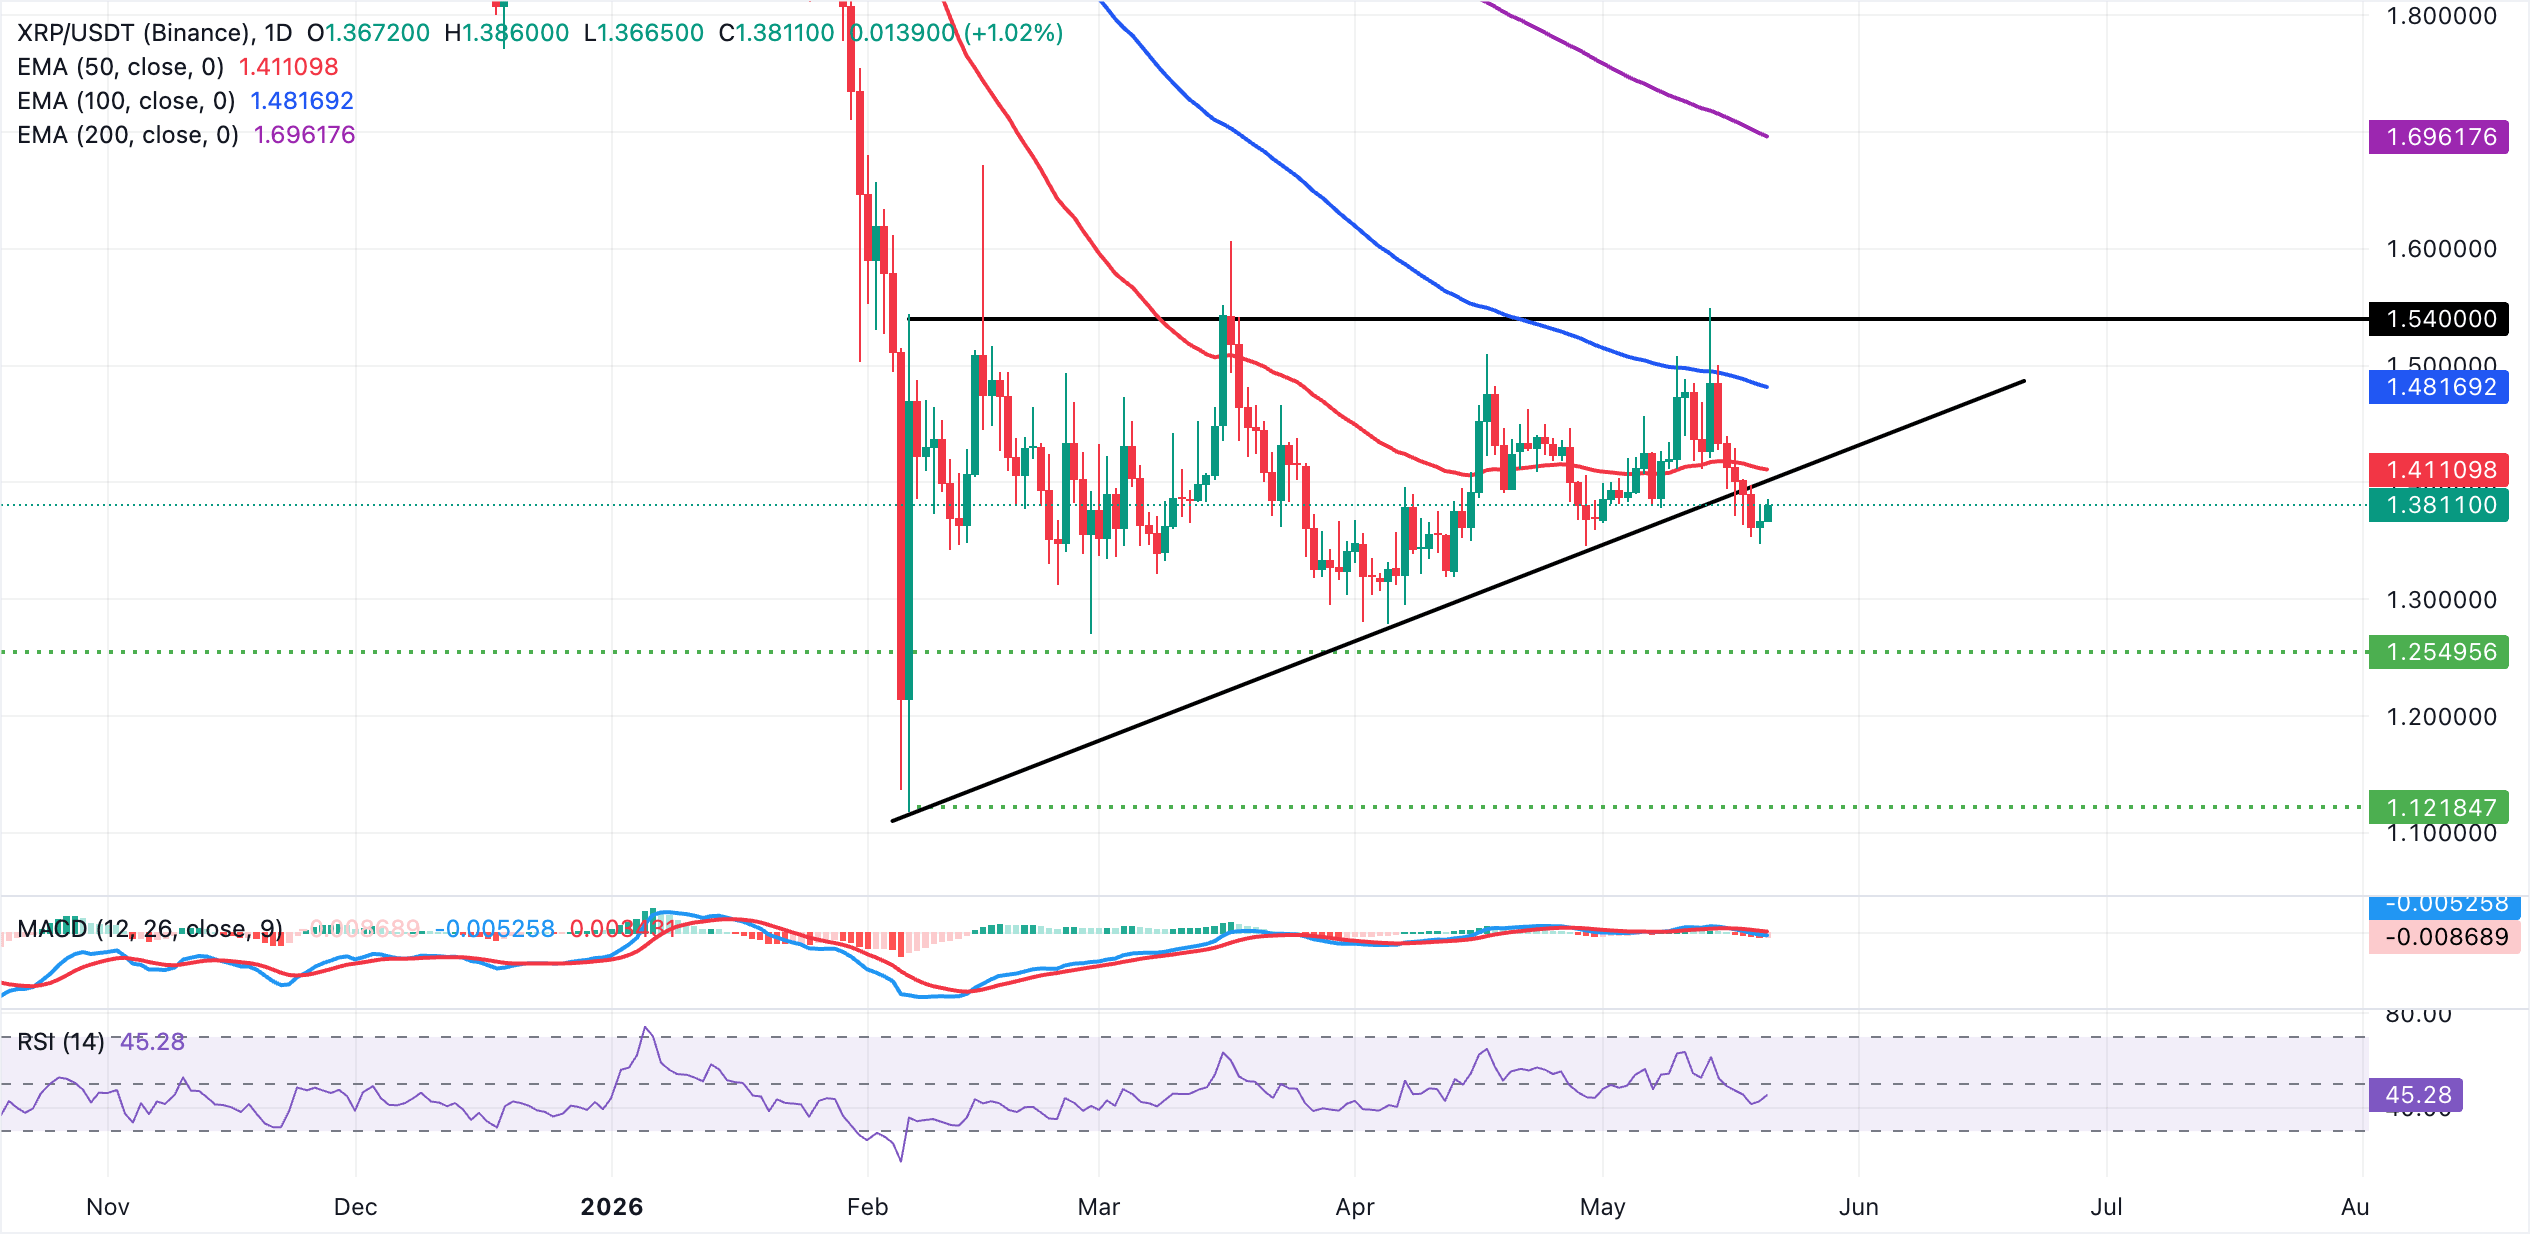
On the topside, immediate resistance lies at the former trendline break area around $1.40, followed by the 50-day EMA at $1.4. A daily close above these would be needed to ease the current pressure and open the way toward the 100-day EMA near $1.48 and then the 200-day EMA around $1.70. If selling pressure returns, a correction would find support at $1.35 and $1.30 should the sell-off intensify.
(The technical analysis of this story was written with the help of an AI tool.)
Bitcoin, altcoins, stablecoins FAQs
Bitcoin is the largest cryptocurrency by market capitalization, a virtual currency designed to serve as money. This form of payment cannot be controlled by any one person, group, or entity, which eliminates the need for third-party participation during financial transactions.
Altcoins are any cryptocurrency apart from Bitcoin, but some also regard Ethereum as a non-altcoin because it is from these two cryptocurrencies that forking happens. If this is true, then Litecoin is the first altcoin, forked from the Bitcoin protocol and, therefore, an “improved” version of it.
Stablecoins are cryptocurrencies designed to have a stable price, with their value backed by a reserve of the asset it represents. To achieve this, the value of any one stablecoin is pegged to a commodity or financial instrument, such as the US Dollar (USD), with its supply regulated by an algorithm or demand. The main goal of stablecoins is to provide an on/off-ramp for investors willing to trade and invest in cryptocurrencies. Stablecoins also allow investors to store value since cryptocurrencies, in general, are subject to volatility.
Bitcoin dominance is the ratio of Bitcoin's market capitalization to the total market capitalization of all cryptocurrencies combined. It provides a clear picture of Bitcoin’s interest among investors. A high BTC dominance typically happens before and during a bull run, in which investors resort to investing in relatively stable and high market capitalization cryptocurrency like Bitcoin. A drop in BTC dominance usually means that investors are moving their capital and/or profits to altcoins in a quest for higher returns, which usually triggers an explosion of altcoin rallies.
추천 기사


