

Gold slips as Iran uranium demands complicate US-Iran negotiations
- Gold trades with a downside bias as uncertainty surrounding Iran’s nuclear programme dampens hopes for a near-term deal.
- Oil-driven inflation risks fuel hawkish Fed expectations, keeping US Treasury yields elevated and weighing on non-yielding Gold.
- XAU/USD remains capped below the 50-day and 100-day SMAs, keeping the near-term technical bias bearish.
Gold (XAU/USD) trades with a downside bias on Thursday, struggling to build on the previous day’s rebound from seven-week lows as markets digest fresh headlines surrounding the US-Iran war. At the time of writing, XAU/USD trades around $4,515, down nearly 0.60% on the day.
In the latest developments, Reuters reported earlier on Thursday, citing two senior Iranian sources, that Iran’s Supreme Leader has ordered that near-weapons-grade uranium must remain inside the country. The report dampened hopes for a near-term breakthrough in negotiations as limiting Iran’s nuclear programme remains one of Washington’s main demands and could complicate ongoing efforts to end the war in the Middle East.
Earlier, Iranian media outlet Tasnim News Agency reported that Tehran is reviewing a new draft proposal sent by the United States (US) in response to its 14-point proposal. The update came after US President Donald Trump said on Wednesday that negotiations with Iran were in the “final stages,” though he warned that military action could resume if no deal is reached.
Lingering uncertainty surrounding the conflict is supporting safe-haven demand for the US Dollar (USD), with the US Dollar Index (DXY), which tracks the Greenback's value against a basket of six major currencies, hovering near more than one-month highs above the 99.00 mark.
At the same time, elevated Oil prices are fueling inflation concerns and reinforcing expectations that the Federal Reserve (Fed) could raise interest rates by the end of the year.
Minutes from the Fed’s April meeting showed that participants “generally judged that continued elevated inflation and uncertainty over the Middle East could necessitate keeping the current policy stance for longer than anticipated.” The Minutes also noted that a “majority of participants said some policy firming would likely become appropriate if inflation were to continue running persistently above 2%.”
The hawkish repricing continues to support US Treasury yields, with the benchmark 10-year Treasury yield holding near multi-month highs. Elevated yields and a stronger US Dollar remain key headwinds for non-yielding assets such as Gold, limiting stronger upside momentum in XAU/USD.
Looking ahead, traders will continue to monitor headlines surrounding developments in the Middle East. On the data front, market participants now await the release of the preliminary S&P Global Purchasing Managers Index (PMI) data for May later on Thursday.
Technical Analysis: XAU/USD struggles below 50-day and 100-day SMAs
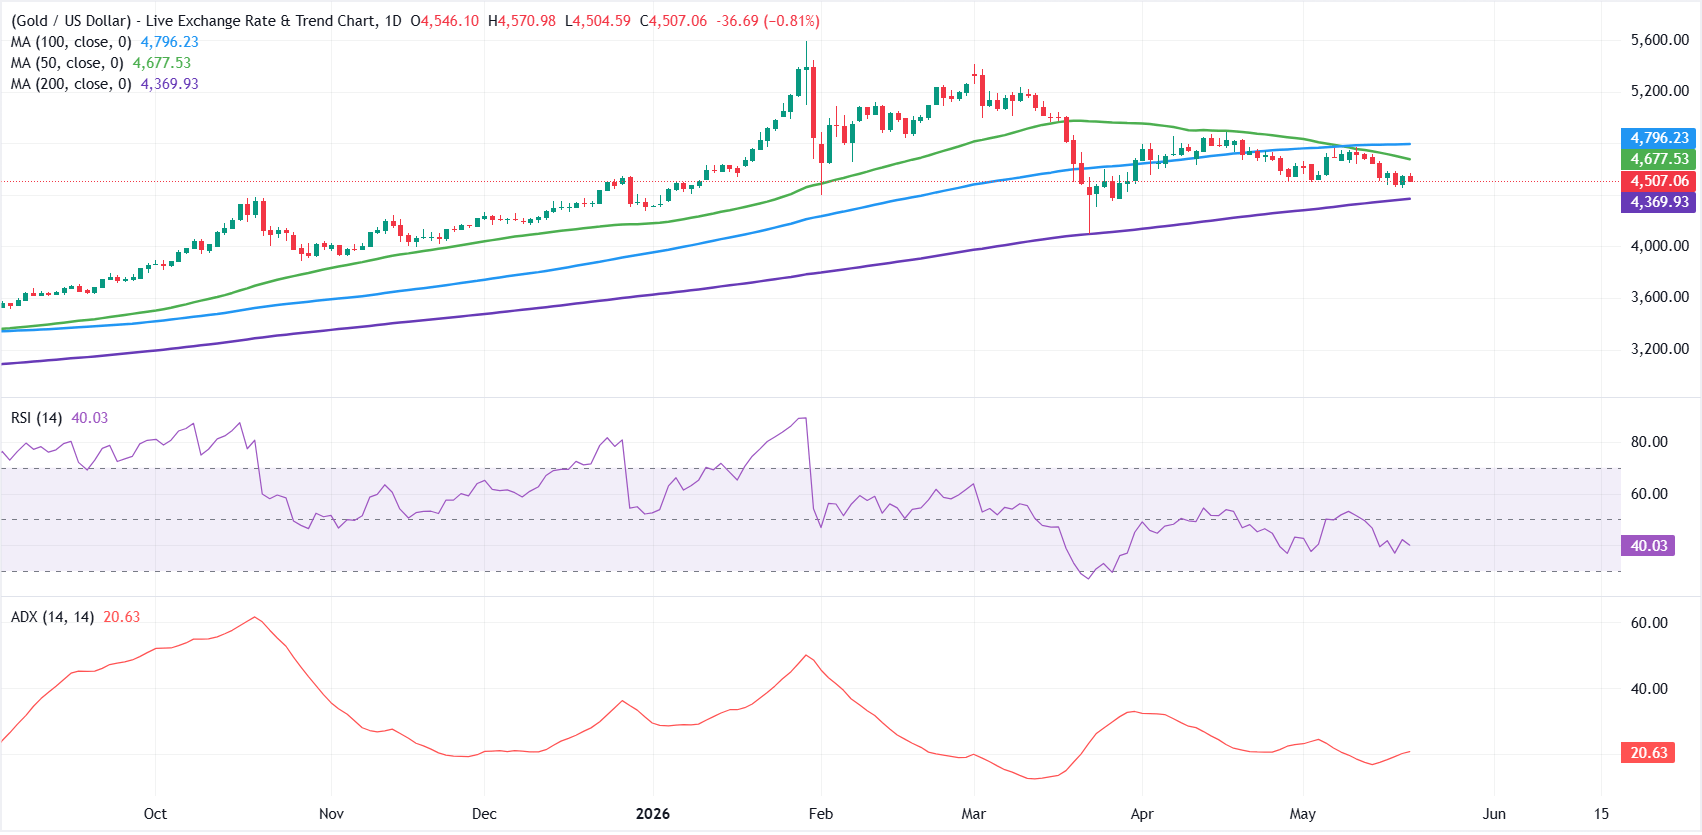
On the daily chart, XAU/USD is holding below the descending 50-day and 100-day Simple Moving Averages (SMAs), which keeps the near-term bias bearish despite price remaining comfortably above the rising 200-day SMA near $4,370.
The Relative Strength Index (RSI) at 40.51 remains below the midline, suggesting lingering downside pressure, while the Average Directional Index (ADX) around 20 indicates a weak directional trend as the market consolidates within a broader corrective phase.
On the topside, initial resistance aligns with the 50-day SMA at $4,677, with a stronger cap emerging at the 100-day SMA near $4,796 if bulls attempt a deeper recovery.
On the downside, the rising 200-day SMA at $4,370 marks the key support to watch. A decisive break beneath this longer-term baseline would reinforce the bearish bias and open the door to a more pronounced correction.
(The technical analysis of this story was written with the help of an AI tool.)
Gold FAQs
Gold has played a key role in human’s history as it has been widely used as a store of value and medium of exchange. Currently, apart from its shine and usage for jewelry, the precious metal is widely seen as a safe-haven asset, meaning that it is considered a good investment during turbulent times. Gold is also widely seen as a hedge against inflation and against depreciating currencies as it doesn’t rely on any specific issuer or government.
Central banks are the biggest Gold holders. In their aim to support their currencies in turbulent times, central banks tend to diversify their reserves and buy Gold to improve the perceived strength of the economy and the currency. High Gold reserves can be a source of trust for a country’s solvency. Central banks added 1,136 tonnes of Gold worth around $70 billion to their reserves in 2022, according to data from the World Gold Council. This is the highest yearly purchase since records began. Central banks from emerging economies such as China, India and Turkey are quickly increasing their Gold reserves.
Gold has an inverse correlation with the US Dollar and US Treasuries, which are both major reserve and safe-haven assets. When the Dollar depreciates, Gold tends to rise, enabling investors and central banks to diversify their assets in turbulent times. Gold is also inversely correlated with risk assets. A rally in the stock market tends to weaken Gold price, while sell-offs in riskier markets tend to favor the precious metal.
The price can move due to a wide range of factors. Geopolitical instability or fears of a deep recession can quickly make Gold price escalate due to its safe-haven status. As a yield-less asset, Gold tends to rise with lower interest rates, while higher cost of money usually weighs down on the yellow metal. Still, most moves depend on how the US Dollar (USD) behaves as the asset is priced in dollars (XAU/USD). A strong Dollar tends to keep the price of Gold controlled, whereas a weaker Dollar is likely to push Gold prices up.
추천 기사


