


Ripple Price Forecast: XRP edges up above $1.40 on growing institutional, retail demand
- XRP reclaims $1.40 support as momentum indicators signal a potential breakout.
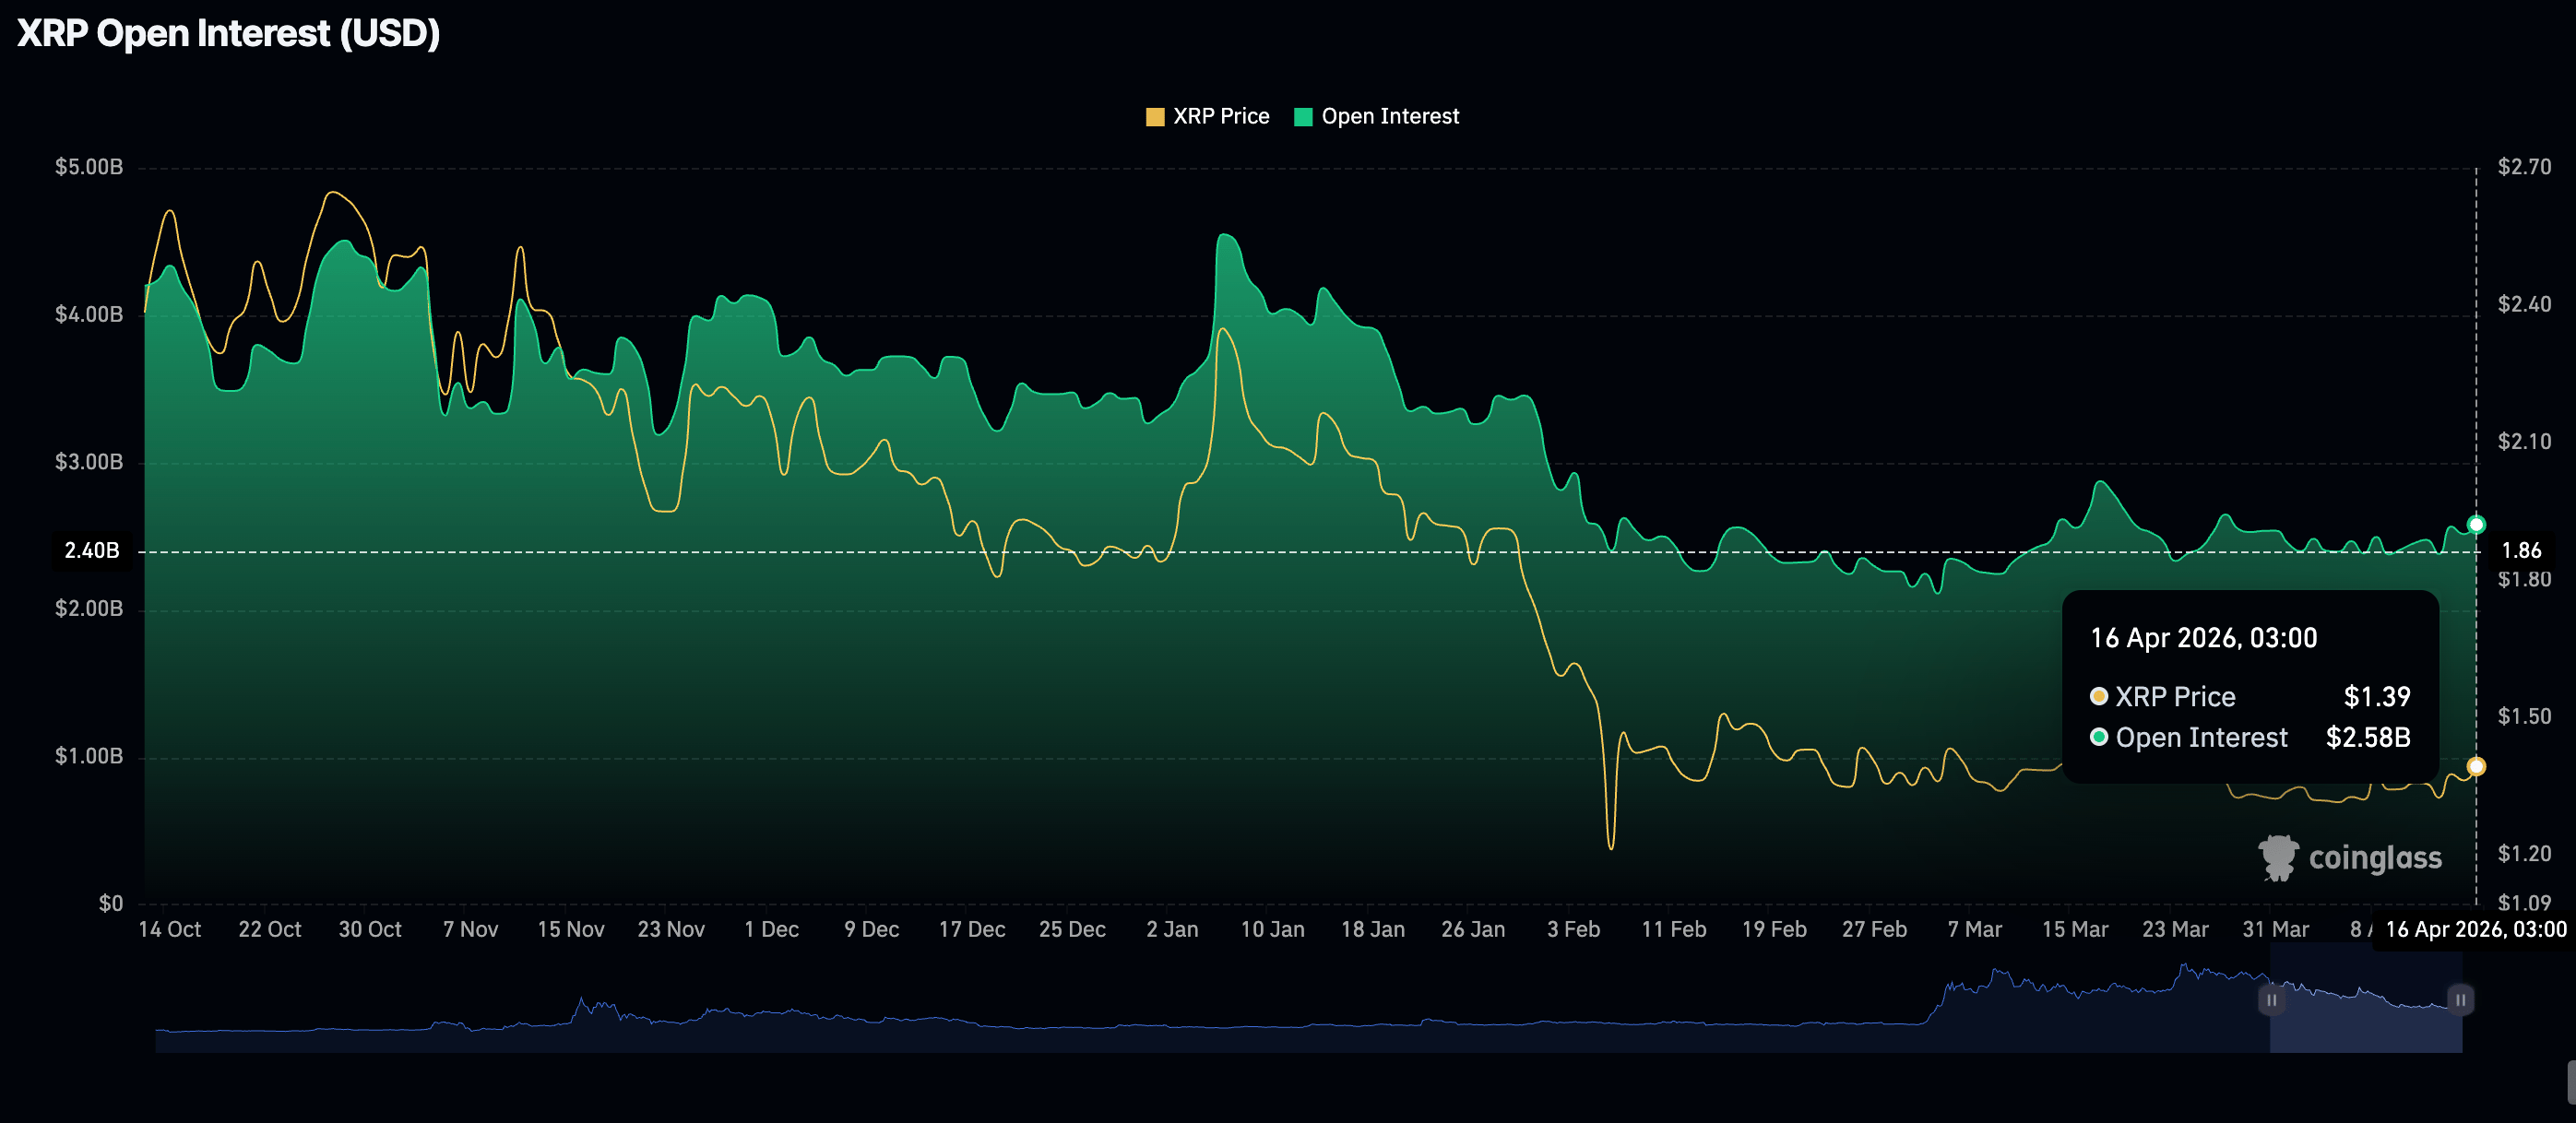
- XRP derivatives market sees retail investors return as futures Open Interest climbs to $2.58 billion on Thursday.
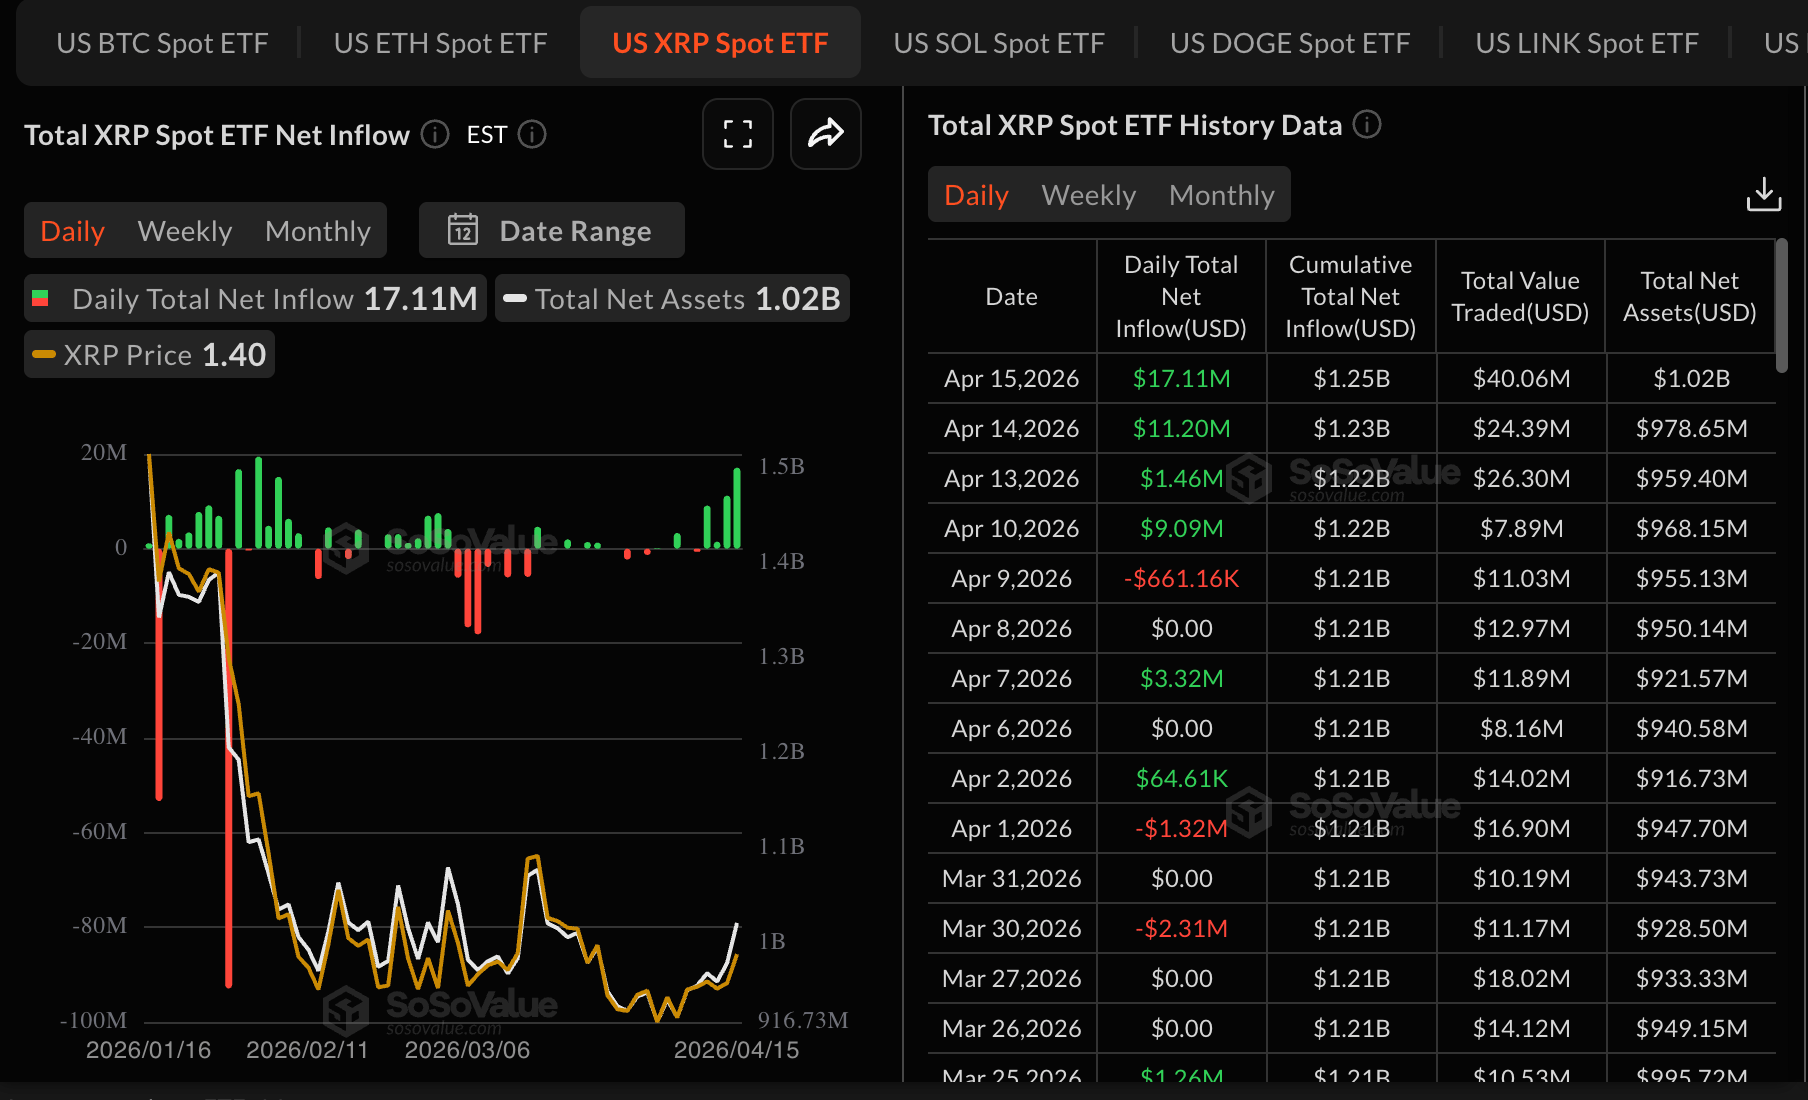
- Inflows via US-listed XRP spot ETFs accelerate, totaling $17 million on Wednesday, underscoring steady risk appetite.
Ripple (XRP) maintains a neutral-to-bullish tone, trading above $1.41 at the time of writing on Thursday, supported by renewed institutional and retail interest. A steady price increase could accelerate the remittance token toward the next resistance levels at $1.50 and $1.55.
Still, traders should temper their expectations, given that the immediate supply around $1.41 could absorb the gains.
XRP growing institutional and retail interest boosts recovery outlook
Institutional investors are showing renewed interest in digital investment products, evidenced by US-listed XRP spot Exchange-Traded Funds (ETFs) recording approximately $17 million in inflows on Wednesday, up from roughly $11 million the previous day.
Cumulative inflows currently stand at $1.25 billion, with net assets under management averaging $1.02 billion, according to SoSoValue data. If inflows into the spot ETFs continue , prices could steadily increase, with XRP grinding toward the $1.50 psychological level.
Similarly, retail demand has expanded this week, steadying the XRP derivatives market. The Open Interest (OI), reflecting the notional value of outstanding futures and options contracts, rose to $2.58 billion on Thursday from $2.51 billion the previous day. The return of retail investors, albeit gradual, suggests growing conviction in XRP’s ability to sustain upward price action in the short- to medium-term.
Technical outlook: XRP bulls tighten grip as gains extend
XRP trades at $1.41 and holds marginally above the 50-day Exponential Moving Average (EMA) and the 50.0% Fibonacci retracement at $1.3946, drawn between the February 6 low of $1.12 and February 15 high of $1.67. Still, XRP remains well below the 100-day EMA at $1.55 and the 200-day EMA at $1.80, keeping the broader bias capped to the downside.
The Relative Strength Index is near 58 on the daily chart, and a positive Moving Average Convergence Divergence (MACD) histogram hints at improving bullish momentum. Still, this recovery unfolds beneath a dense band of medium-term resistance defined by the higher EMAs and Fibonacci levels.
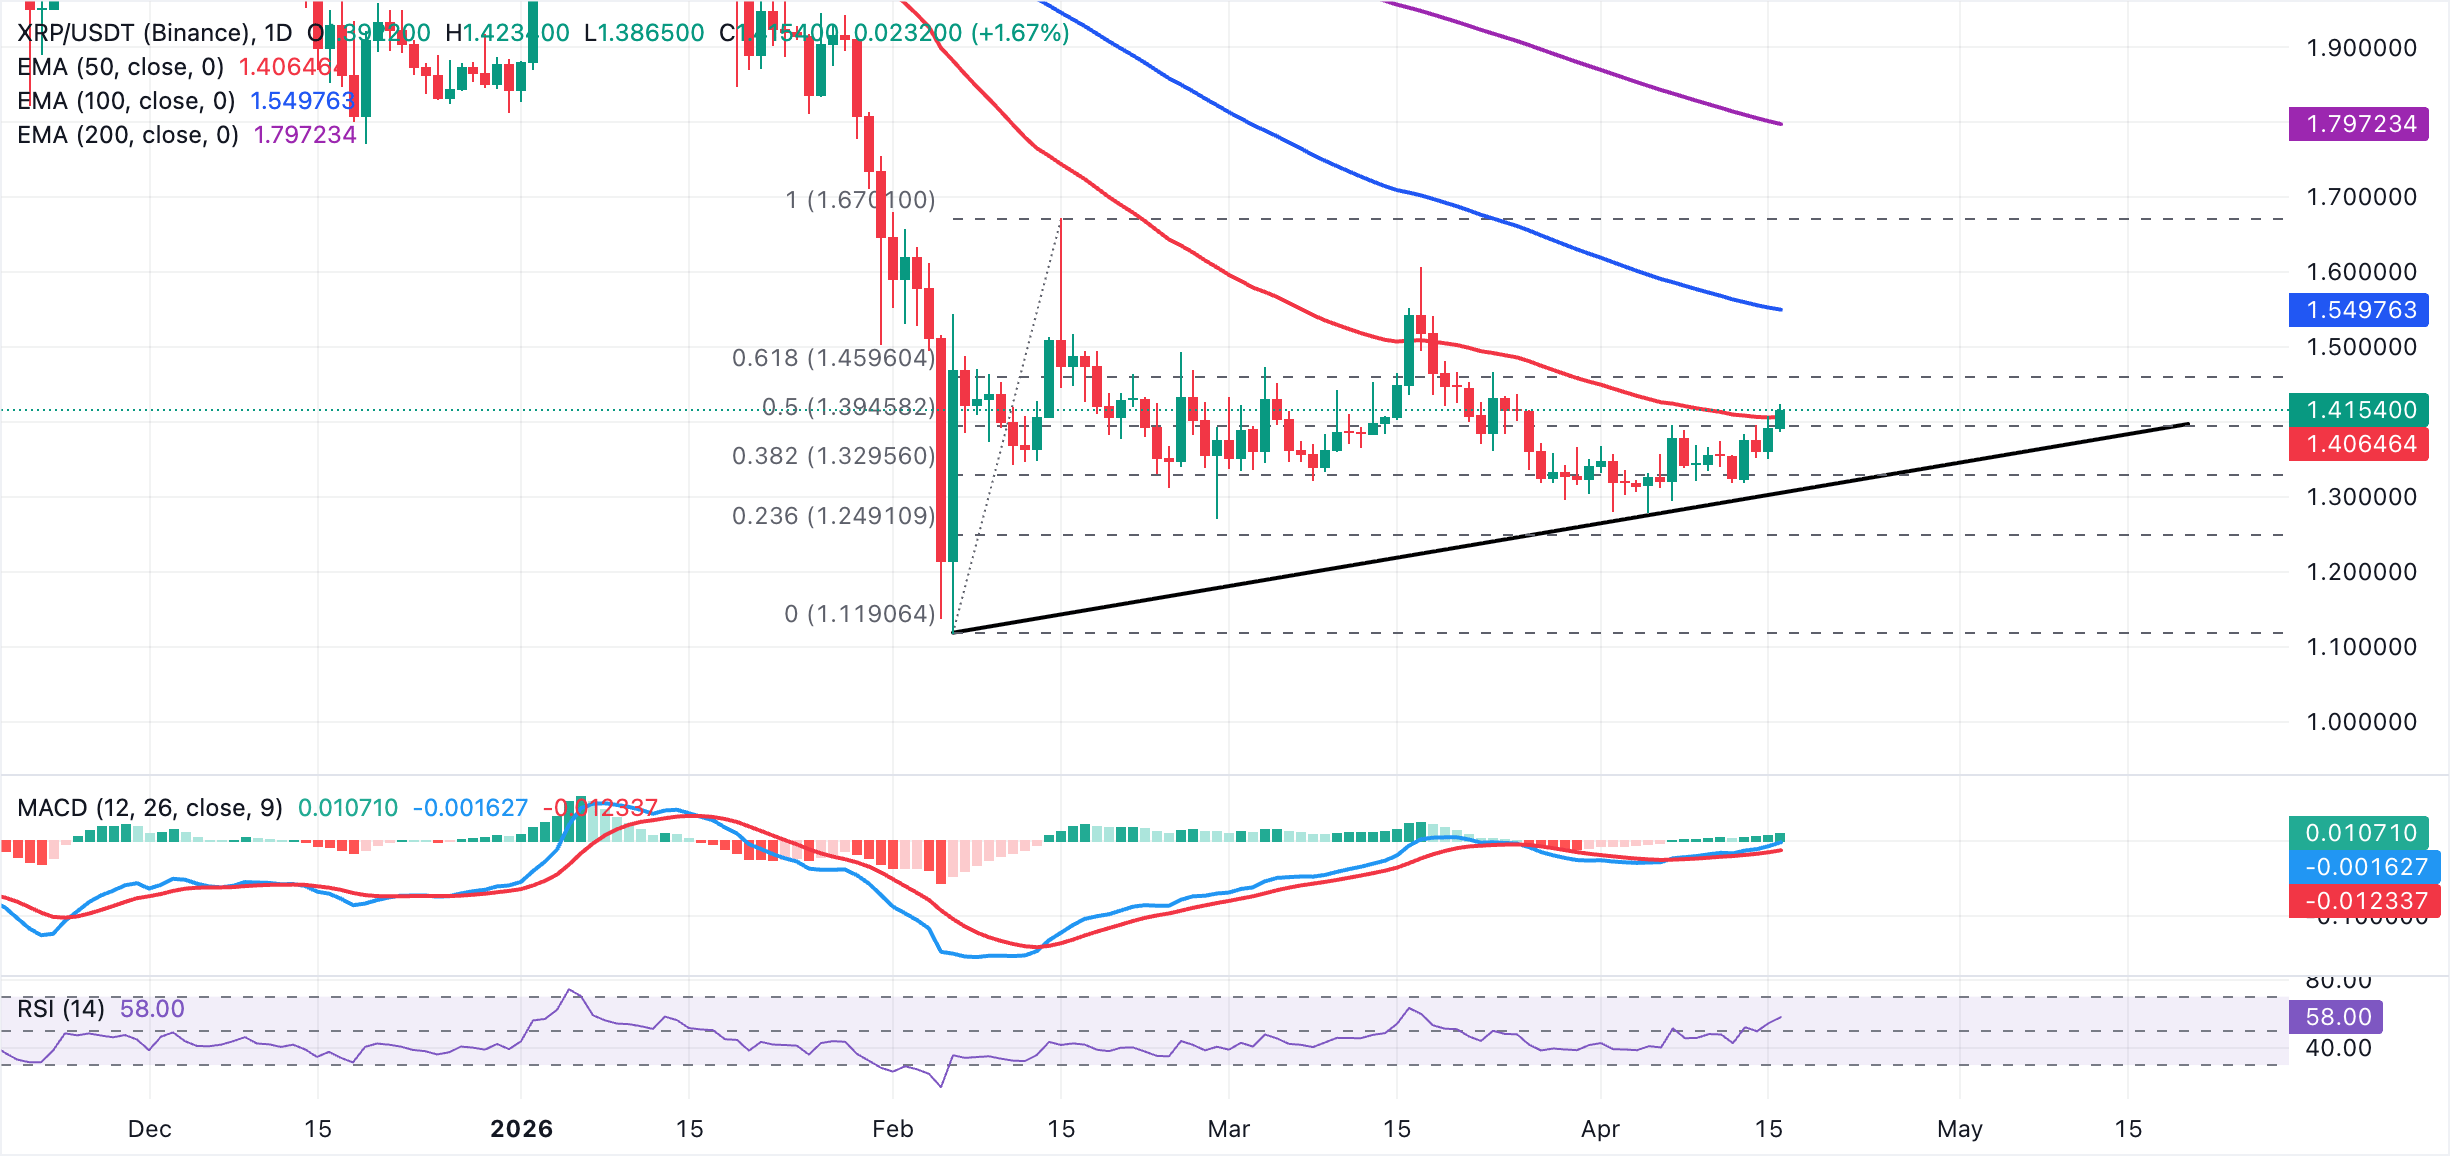
On the downside, initial support is seen at the 50-day EMA around $1.41, followed by the 50.0% Fibonacci retracement near $1.39. A break below this band would expose the 38.2% Fibonacci retracement at $1.33 and the prior trendline break area around $1.31, with the 23.6% Fibonacci retracement at $1.25 acting as a deeper structural floor.
On the topside, immediate resistance emerges at the 61.8% Fibonacci retracement around $1.46, ahead of a stronger cluster at $1.55, where both the 100-day EMA and the 78.6% Fibonacci retracement align.
Crypto ETF FAQs
An Exchange-Traded Fund (ETF) is an investment vehicle or an index that tracks the price of an underlying asset. ETFs can not only track a single asset, but a group of assets and sectors. For example, a Bitcoin ETF tracks Bitcoin’s price. ETF is a tool used by investors to gain exposure to a certain asset.
Yes. The first Bitcoin futures ETF in the US was approved by the US Securities & Exchange Commission in October 2021. A total of seven Bitcoin futures ETFs have been approved, with more than 20 still waiting for the regulator’s permission. The SEC says that the cryptocurrency industry is new and subject to manipulation, which is why it has been delaying crypto-related futures ETFs for the last few years.
Yes. The SEC approved in January 2024 the listing and trading of several Bitcoin spot Exchange-Traded Funds, opening the door to institutional capital and mainstream investors to trade the main crypto currency. The decision was hailed by the industry as a game changer.
The main advantage of crypto ETFs is the possibility of gaining exposure to a cryptocurrency without ownership, reducing the risk and cost of holding the asset. Other pros are a lower learning curve and higher security for investors since ETFs take charge of securing the underlying asset holdings. As for the main drawbacks, the main one is that as an investor you can’t have direct ownership of the asset, or, as they say in crypto, “not your keys, not your coins.” Other disadvantages are higher costs associated with holding crypto since ETFs charge fees for active management. Finally, even though investing in ETFs reduces the risk of holding an asset, price swings in the underlying cryptocurrency are likely to be reflected in the investment vehicle too.
(The technical analysis of this story was written with the help of an AI tool.)
추천 기사


