

Crypto Today: Bitcoin, Ethereum, XRP consolidate as market sentiment remains fragile
- Bitcoin struggles for direction above $71,000 as supply around $73,000 caps its upside potential.
- Ethereum holds above the key 50-day EMA support at around $2,150, buoyed by inflows into spot ETFs.
- XRP remains in a dominant downward trend, as weak technicals and ETF outflows weigh.
The cryptocurrency market has largely taken a breather on Friday after the United States (US) and Iran agreed to a ceasefire, which lifted sentiment and triggered a broader price recovery.
Bitcoin (BTC) hovers above $71,000 but holds below its weekly peak of $73,145. Bulls appear intent on securing a higher support ahead of a potential breakout toward the psychological $80,000 threshold.
Altcoins, including Ethereum (ETH) and Ripple (XRP), are also struggling for direction, with ETH trading below $2,200 and XRP hovering under $1.35.
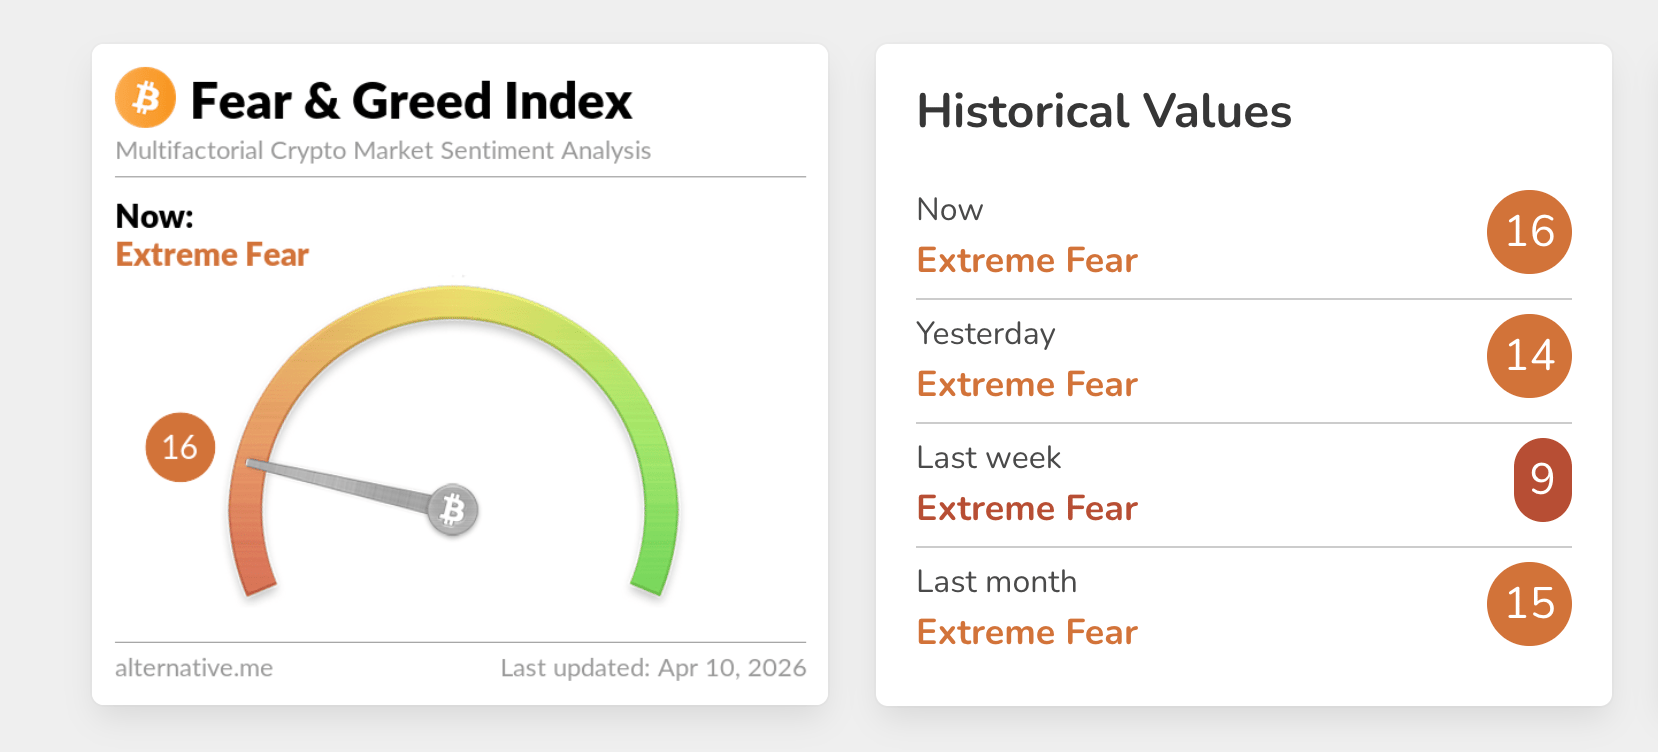
Despite the ceasefire in the Middle East, market sentiment has remained suppressed. The crypto Fear & Greed Index is reading 16 in extreme fear territory on Friday, up from 14 the previous day. If sentiment does not improve, risk-off mood could weigh on crypto assets, limiting recovery potential.
On the macroeconomic and geopolitical front, Pakistan is preparing to host the ceasefire talks between US officials, led by Vice President J.D. Vance, and the Iranian delegation, led by Foreign Minister Abbas Araghchi and Parliament Speaker Mohammad Bagher Ghalibaf, over the weekend. Senior figures from Iran’s Revolutionary Guard are also expected to attend the talks in Islamabad.
The outcome of the negotiations amid a fragile ceasefire could shape the market sentiment in the coming days. So far, Bitcoin holds roughly 4% above its weekly open of $69,034, underscoring the positive impact of the ceasefire.
Institutional interest favors Bitcoin and Ethereum ETFs, XRP sees outflows
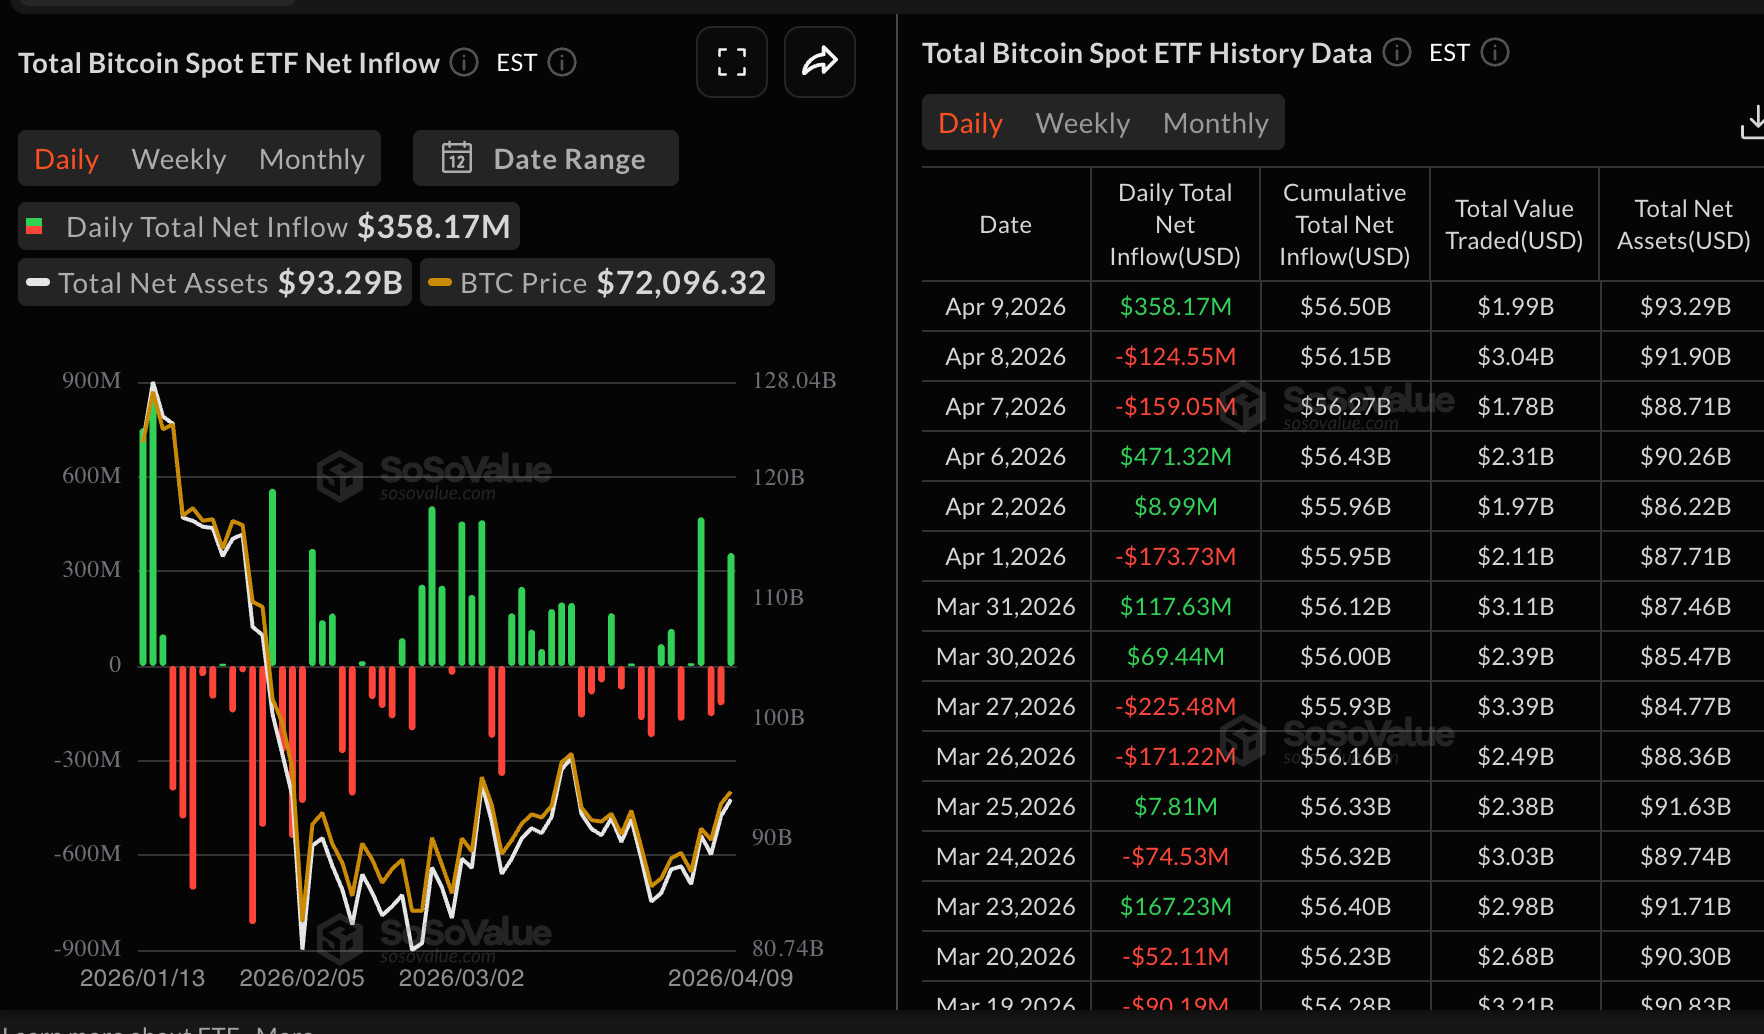
Interest in crypto investment products generally improved on Thursday, with inflows of roughly $358 million into Bitcoin spot Exchange-Traded Funds (ETFs). Cumulative inflows currently stand at $56.50 billion, with net assets under management averaging $93.29 billion.
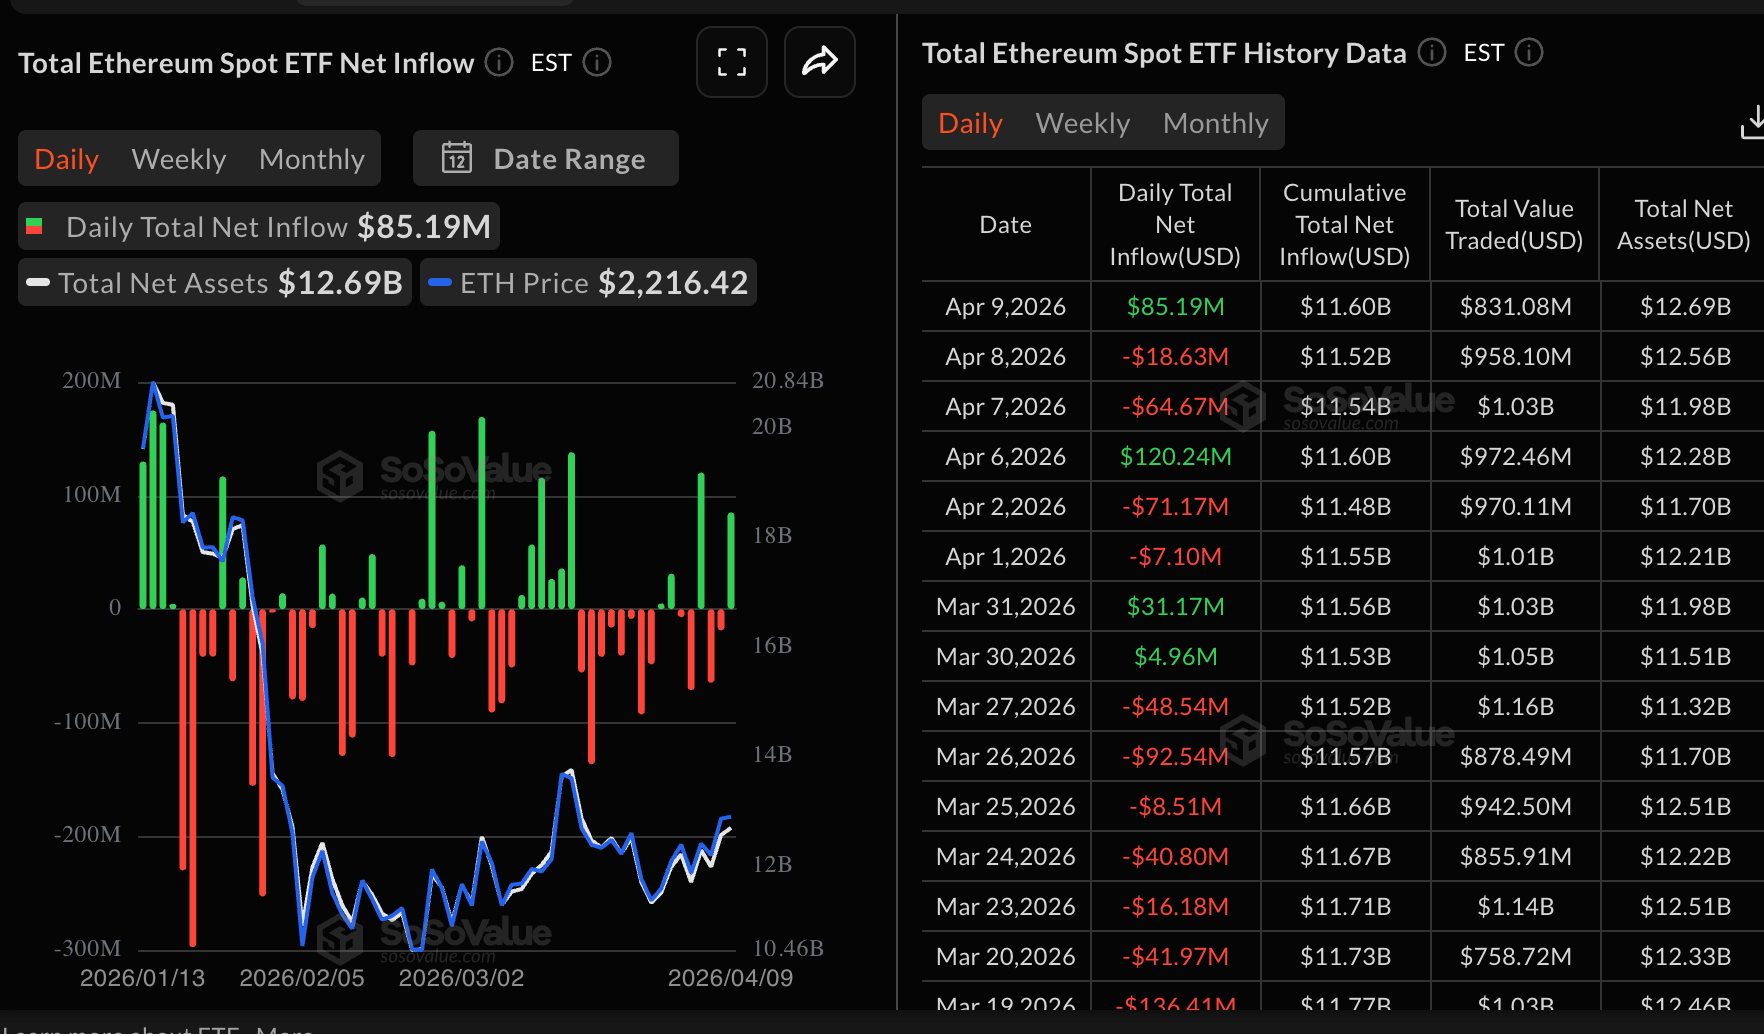
Ethereum spot ETFs, similarly, recorded inflows totaling $85 million on Thursday, breaking a two-day bearish streak, after seeing outflows of nearly $19 million on Wednesday and approximately $65 million on Tuesday. Cumulative inflows currently stand at $11.60 billion, with net assets under management averaging $12.69 billion.
Meanwhile, XRP ETFs remain on the back foot, as risk appetite deteriorates further. As Bitcoin and Ethereum ETFs posted inflows on Thursday, US-listed XRP spot ETFs experienced outflows of roughly $661,000. Moreover, activity remained muted on Wednesday, with zero flows recorded. Cumulative inflows currently stand at $1.21 billion, with net assets under management averaging $955 million.
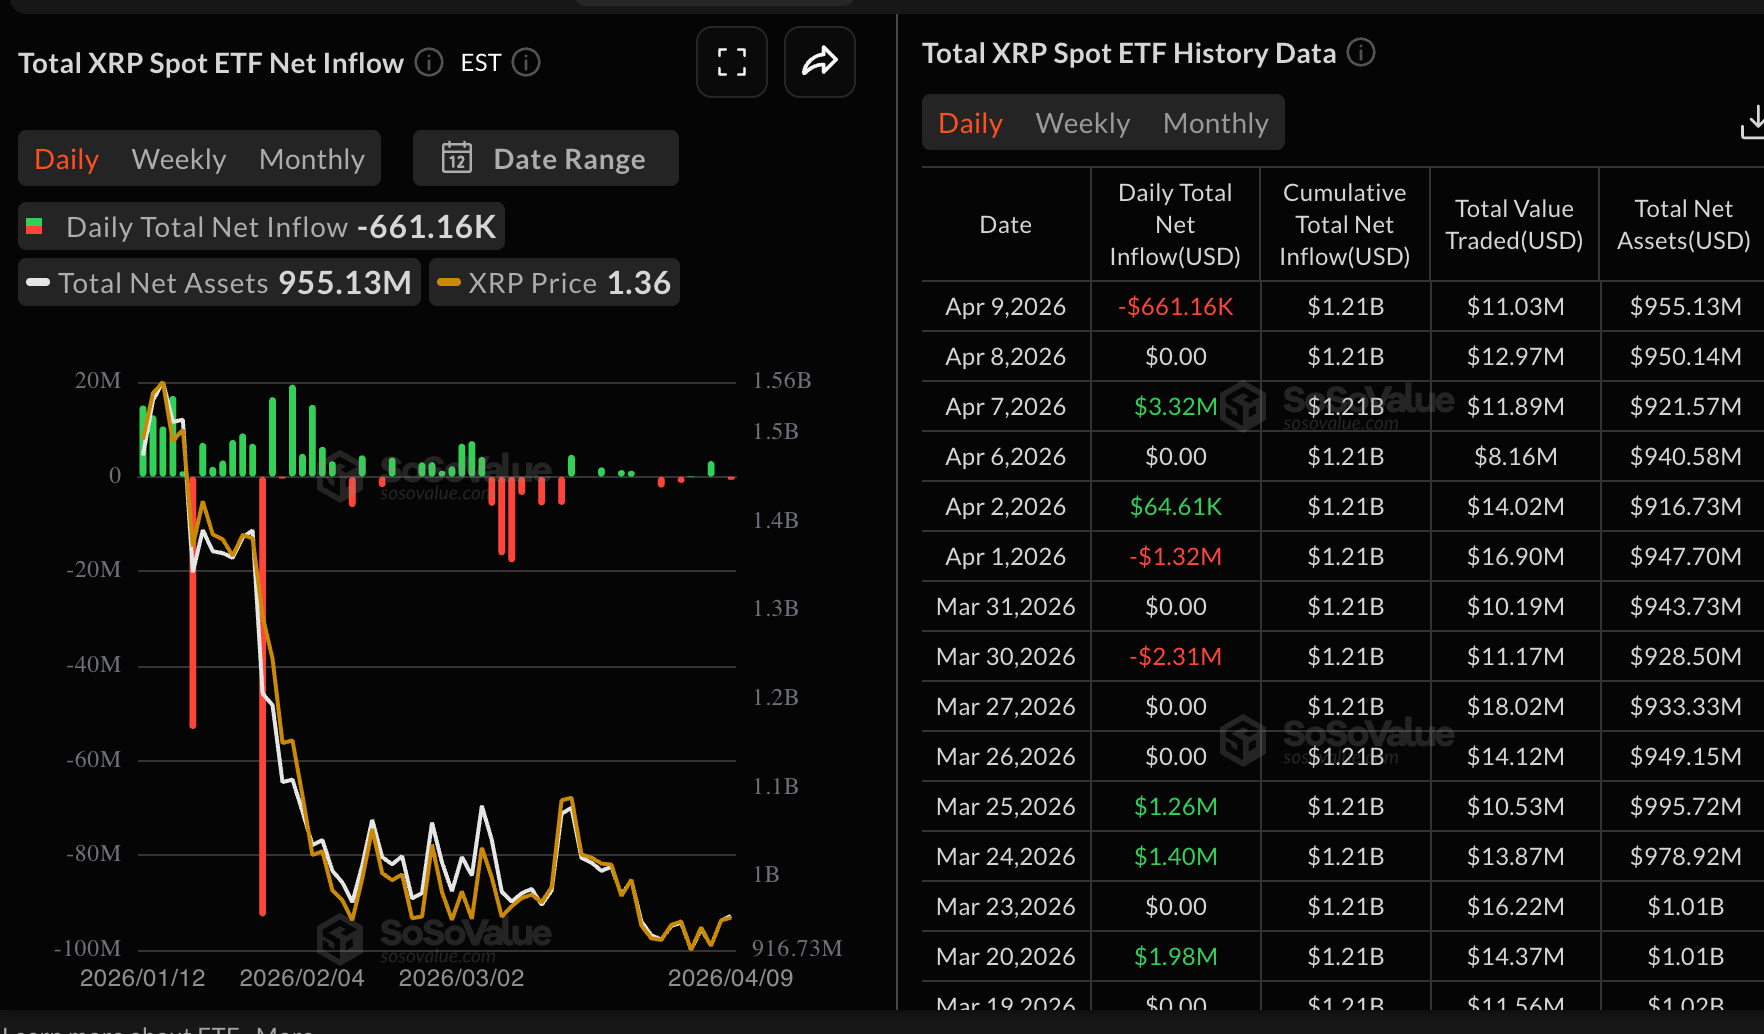
Chart of the day: Bitcoin extends sideways trading above key support
Bitcoin is trading at $71,616 and holds above the 50-day Exponential Moving Average (EMA) at $70,587. Still, the price is capped well below the 100-day EMA at $75,438 and the 200-day EMA near $83,808. This configuration suggests a limited or neutral-to-bearish bias, with price caught between short-term support and heavier medium-term supply overhead.
Momentum is constructive, as the Moving Average Convergence Divergence (MACD) indicator remains in positive territory with a healthy histogram on the daily chart, while the Relative Strength Index (RSI) hovers around 58, hinting that buyers retain some control but lack a clean structural breakout.
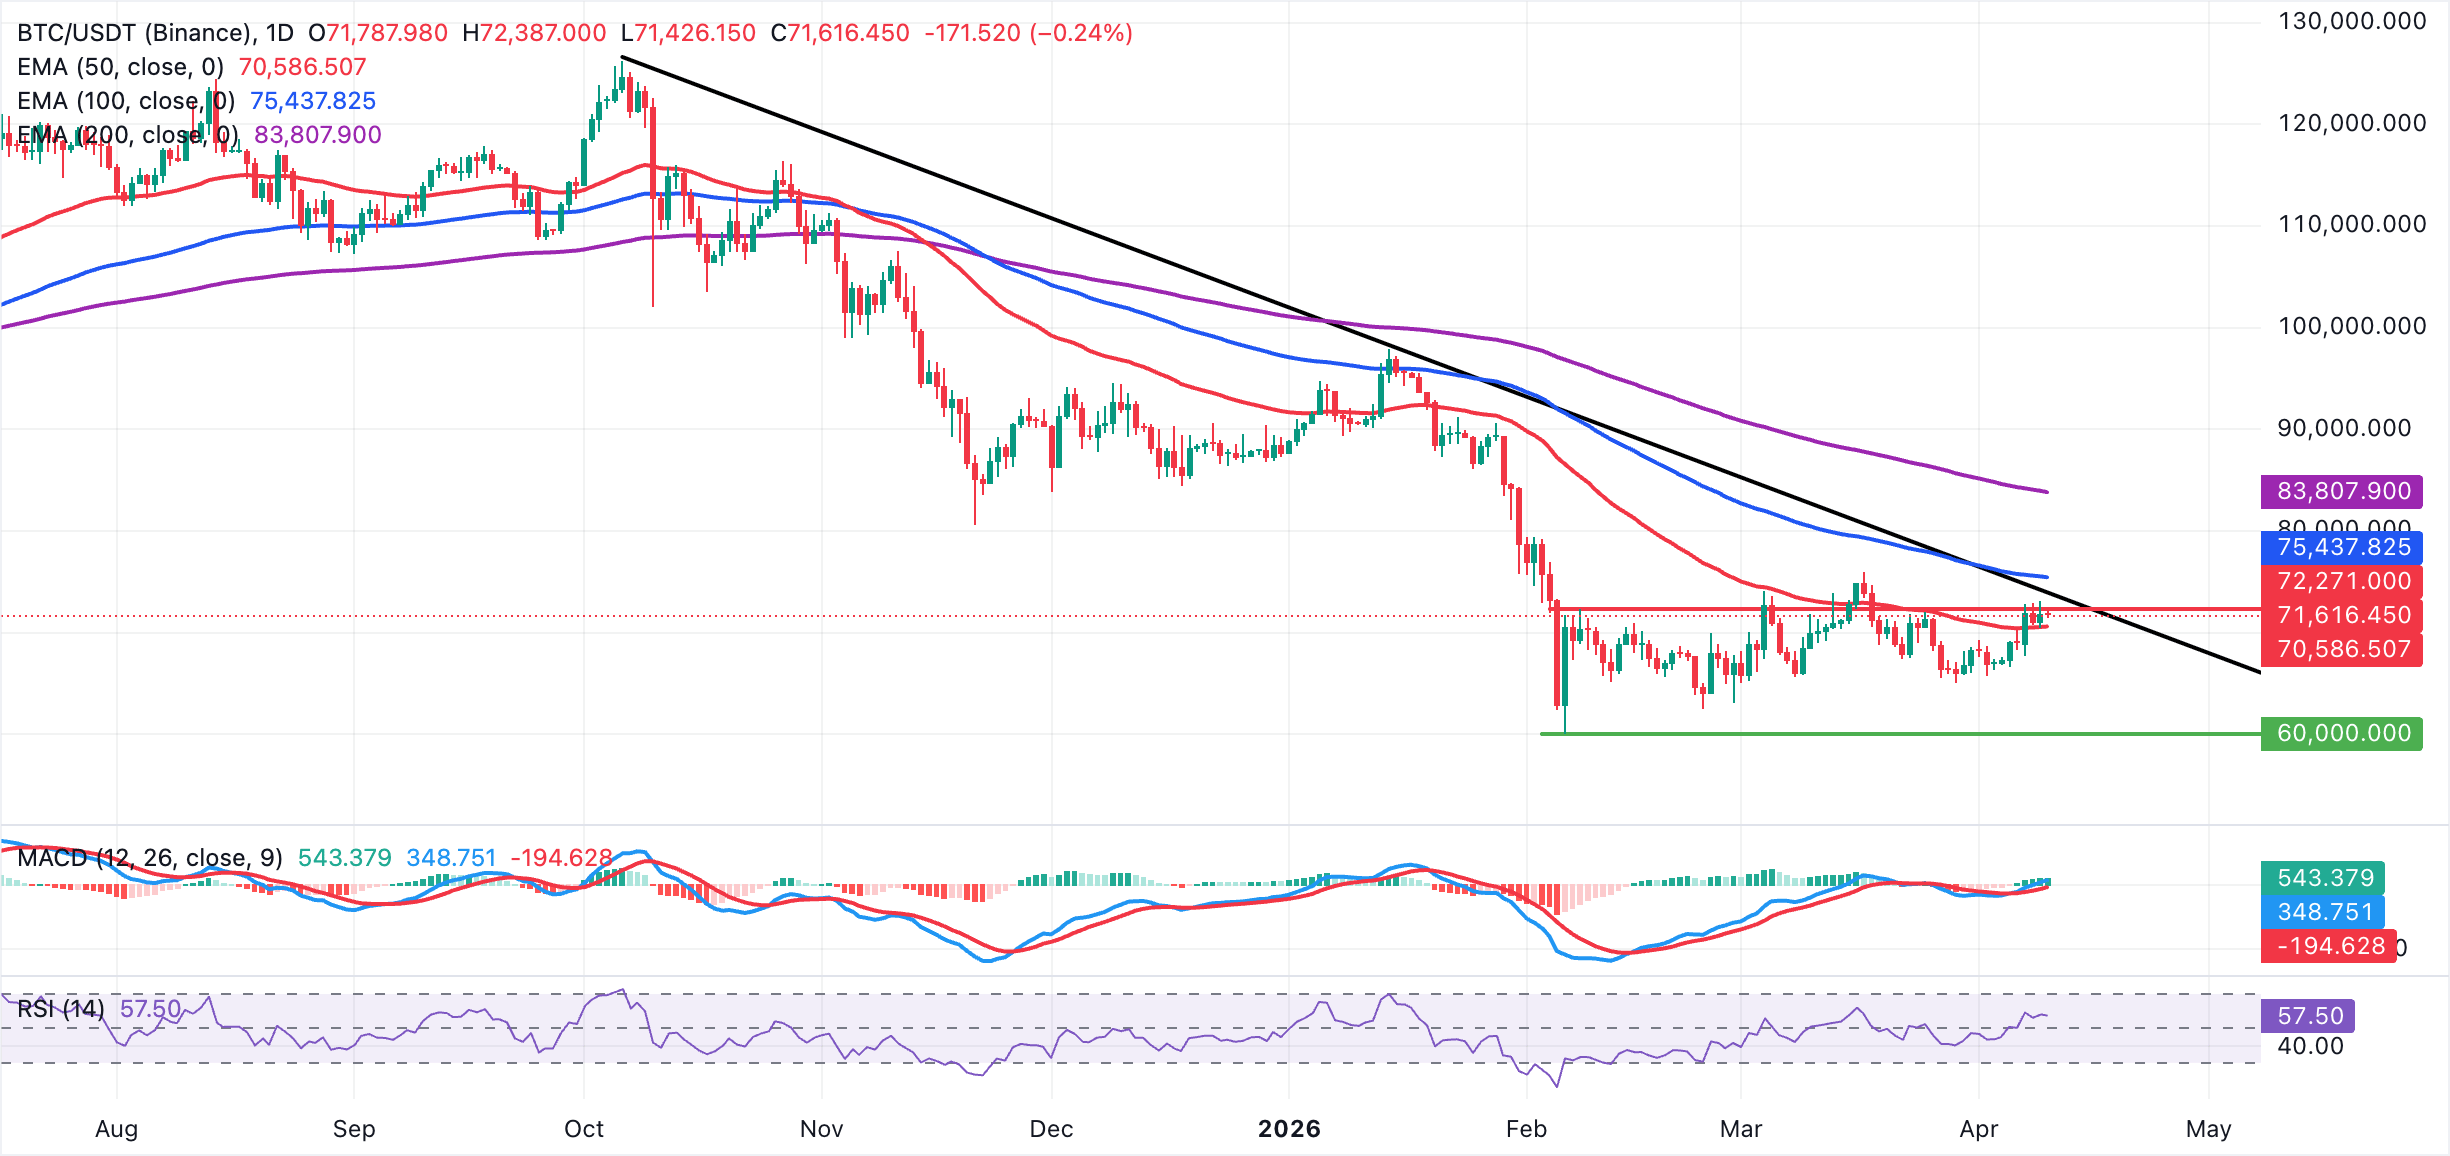
On the topside, Bitcoin's initial resistance is seen near the downward trendline around $73,830, which now serves as the first important barrier, followed by the 100-day EMA at $75,438 and then the more distant 200-day EMA at $83,808. On the downside, the 50-day EMA at $70,587 marks immediate support. A daily close beneath this floor would likely expose a deeper pullback below $70,000, while sustained trading above it would keep the door open for another attempt to challenge the $73,830 zone.
Altcoins update: Ethereum and XRP upside limited
Ethereum trades at $2,182 at the time of writing on Friday, holding within a constrained outlook with the price sitting above the 50-day EMA at $2,153 but remains well beneath the 100-day EMA at $2,360 and the 200-day EMA at $2,689. This configuration suggests only a tentative recovery within a broader corrective phase, even as the MACD indicator holds in positive territory on the daily chart and the RSI near 56 hints at steady, but not overextended, bullish momentum.
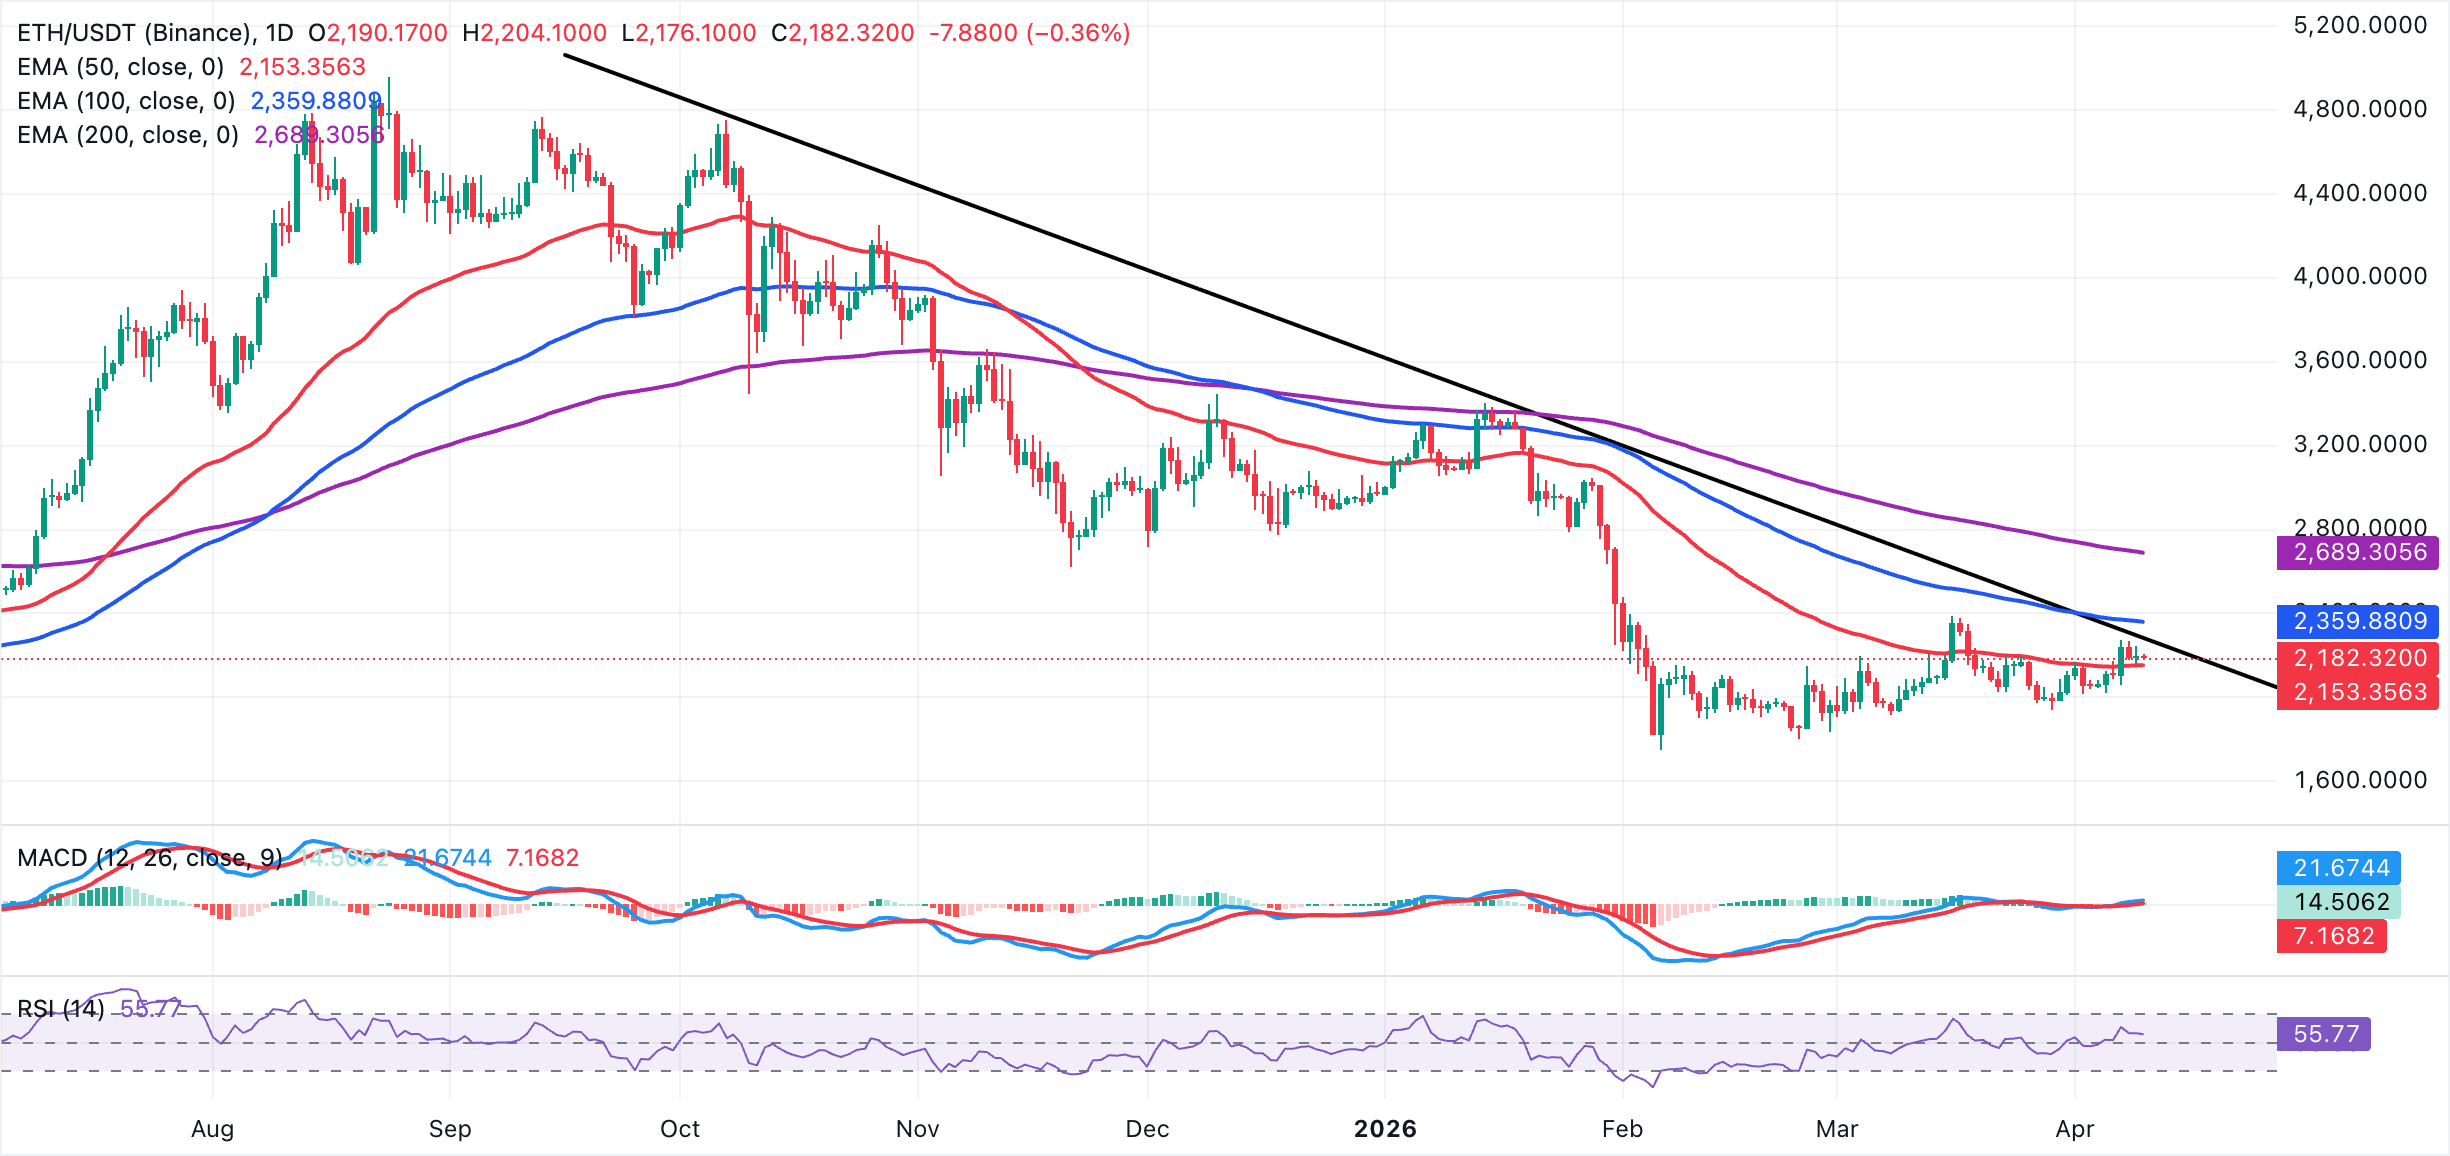
On the topside, ETH's immediate resistance lies in the descending trendline area around $2,278, where sellers could first reassert control, followed by the 100-day EMA at $2,360. A sustained break above this latter barrier would be needed to ease the broader bearish pressure and expose the distant 200-day EMA near $2,689. On the downside, the 50-day EMA at $2,153 provides initial support, where a daily close back below this level would weaken the current bounce and open the door to a deeper pullback toward prior lows. On the other hand, holding above it keeps scope for another test of the $2,278 area.
As for XRP, the price hovers around $1.34, maintaining a bearish near-term bias that holds below major moving averages. The 50-day EMA at $1.42, the 100-day EMA at $1.57, and the 200-day EMA near $1.83 all sit overhead, suggesting rallies are likely to be capped while the pair remains entrenched beneath this layered dynamic resistance.
Momentum is mixed, with the MACD indicator hovering marginally below zero on the daily chart and the RSI slipping around 45, hinting that upside attempts lack strong conviction despite a slight improvement in MACD.
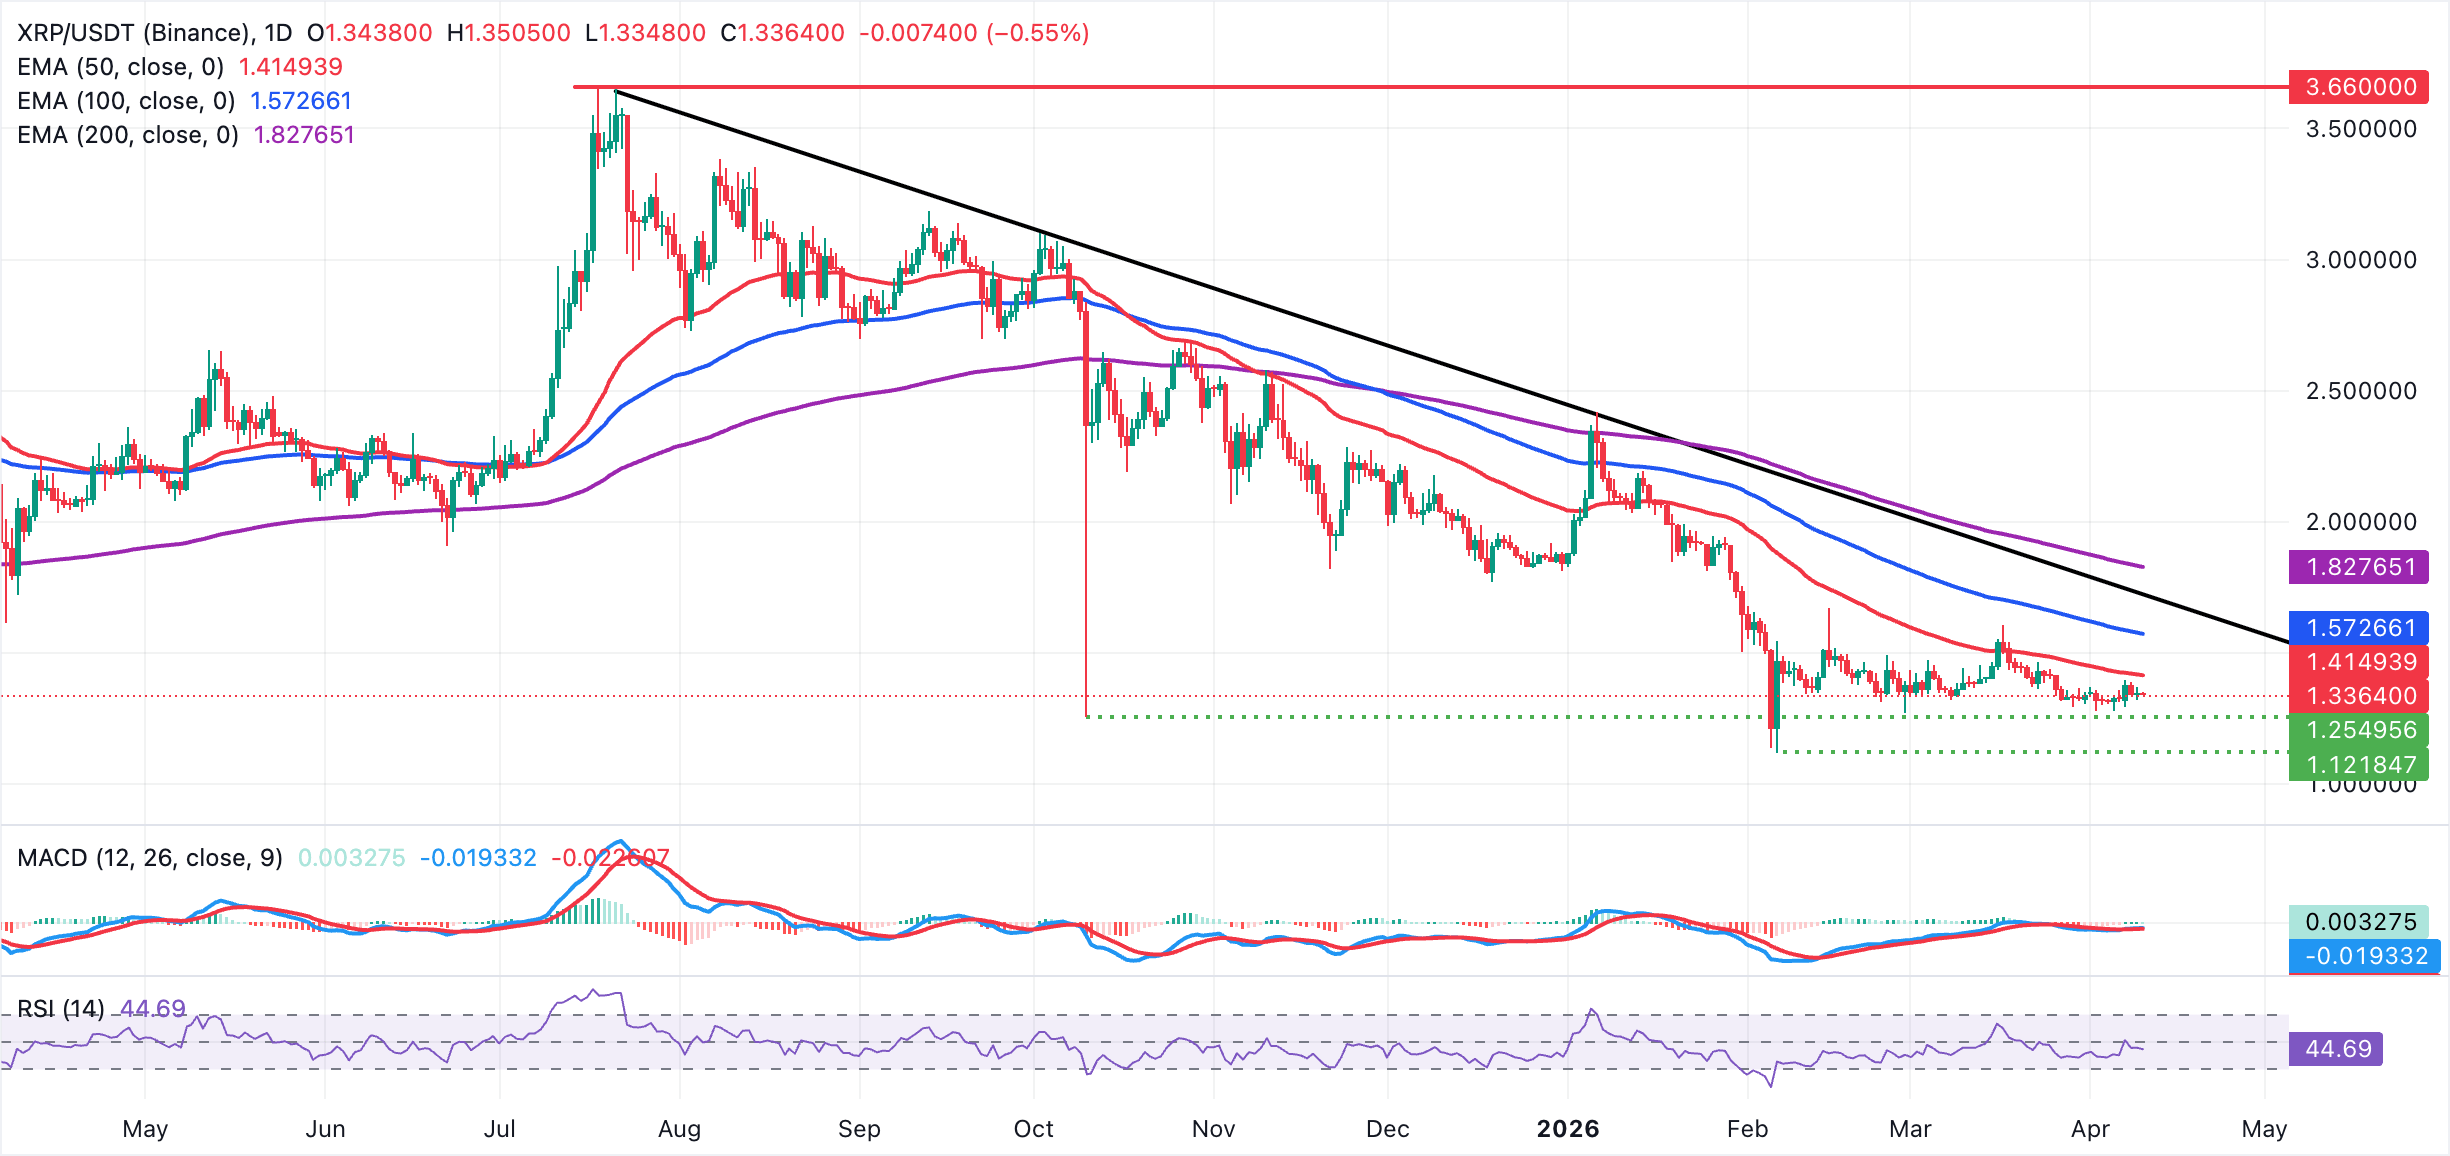
On the topside, XRP's initial resistance is at the pivotal $1.40 level, where the first major supply zone is likely to form. A daily close above that barrier would open the way toward the 50-day EMA at $1.42, followed by the 100-day EMA at $1.57, with the descending trendline acting as a more distant hurdle.
With no clear structural supports defined in the current dataset, failure to build a base above $1.33 would keep XRP vulnerable to further downside extension, leaving traders focused on how the price reacts to the nearby overhead EMAs to gauge whether the prevailing bearish structure can begin to ease.
Crypto ETF FAQs
An Exchange-Traded Fund (ETF) is an investment vehicle or an index that tracks the price of an underlying asset. ETFs can not only track a single asset, but a group of assets and sectors. For example, a Bitcoin ETF tracks Bitcoin’s price. ETF is a tool used by investors to gain exposure to a certain asset.
Yes. The first Bitcoin futures ETF in the US was approved by the US Securities & Exchange Commission in October 2021. A total of seven Bitcoin futures ETFs have been approved, with more than 20 still waiting for the regulator’s permission. The SEC says that the cryptocurrency industry is new and subject to manipulation, which is why it has been delaying crypto-related futures ETFs for the last few years.
Yes. The SEC approved in January 2024 the listing and trading of several Bitcoin spot Exchange-Traded Funds, opening the door to institutional capital and mainstream investors to trade the main crypto currency. The decision was hailed by the industry as a game changer.
The main advantage of crypto ETFs is the possibility of gaining exposure to a cryptocurrency without ownership, reducing the risk and cost of holding the asset. Other pros are a lower learning curve and higher security for investors since ETFs take charge of securing the underlying asset holdings. As for the main drawbacks, the main one is that as an investor you can’t have direct ownership of the asset, or, as they say in crypto, “not your keys, not your coins.” Other disadvantages are higher costs associated with holding crypto since ETFs charge fees for active management. Finally, even though investing in ETFs reduces the risk of holding an asset, price swings in the underlying cryptocurrency are likely to be reflected in the investment vehicle too.
(The technical analysis of this story was written with the help of an AI tool.)
추천 기사


