


Crypto Today: Bitcoin, Ethereum recover as XRP remains supported by ETF inflows
- Bitcoin edges up above $89,000 despite declining institutional demand, as evidenced by ETF outflows.
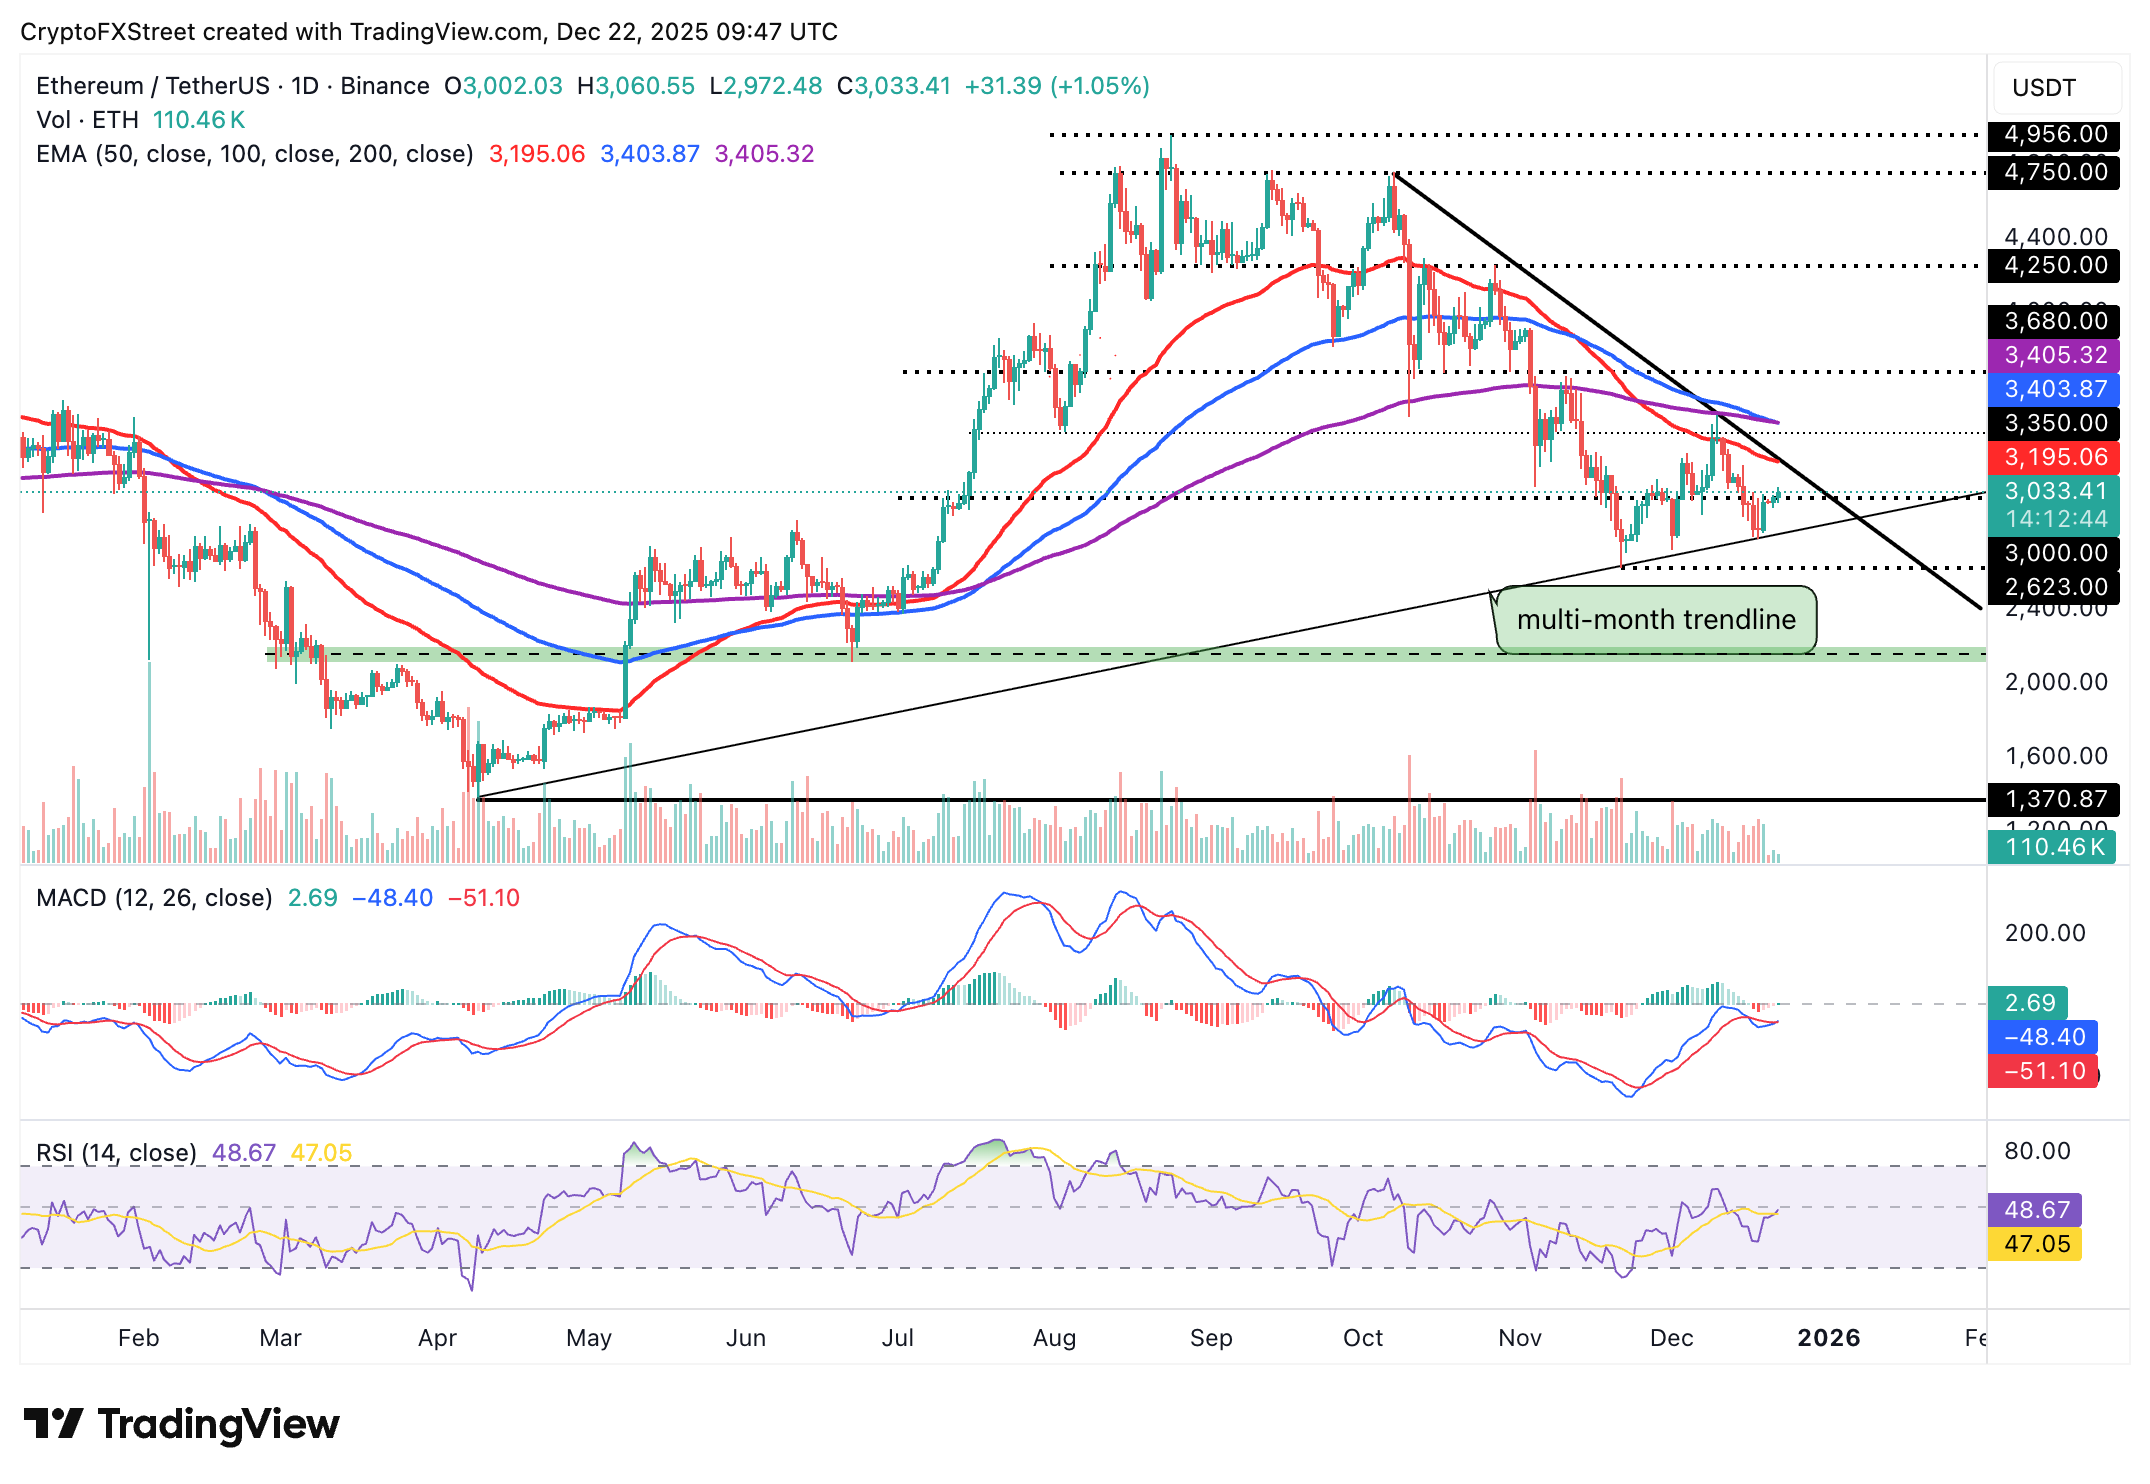
- Ethereum regains momentum above $3,000 but still holds below the 50-day EMA.
- XRP eyes short-term breakout beyond $2.00, supported by steady inflows into US-listed spot ETFs.
Bitcoin (BTC) is trending up toward the pivotal $90,000 level at the time of writing on Monday, which marks four consecutive days of gains. Altcoins, including Ethereum (ETH) and Ripple (XRP), are also rebounding above key short-term support levels. ETH is above $3,000, while XRP consolidates above $1.90 but remains capped below $2.00.
Data spotlight: Selective ETF demand keeps XRP in inflows as BTC and ETH post outflows
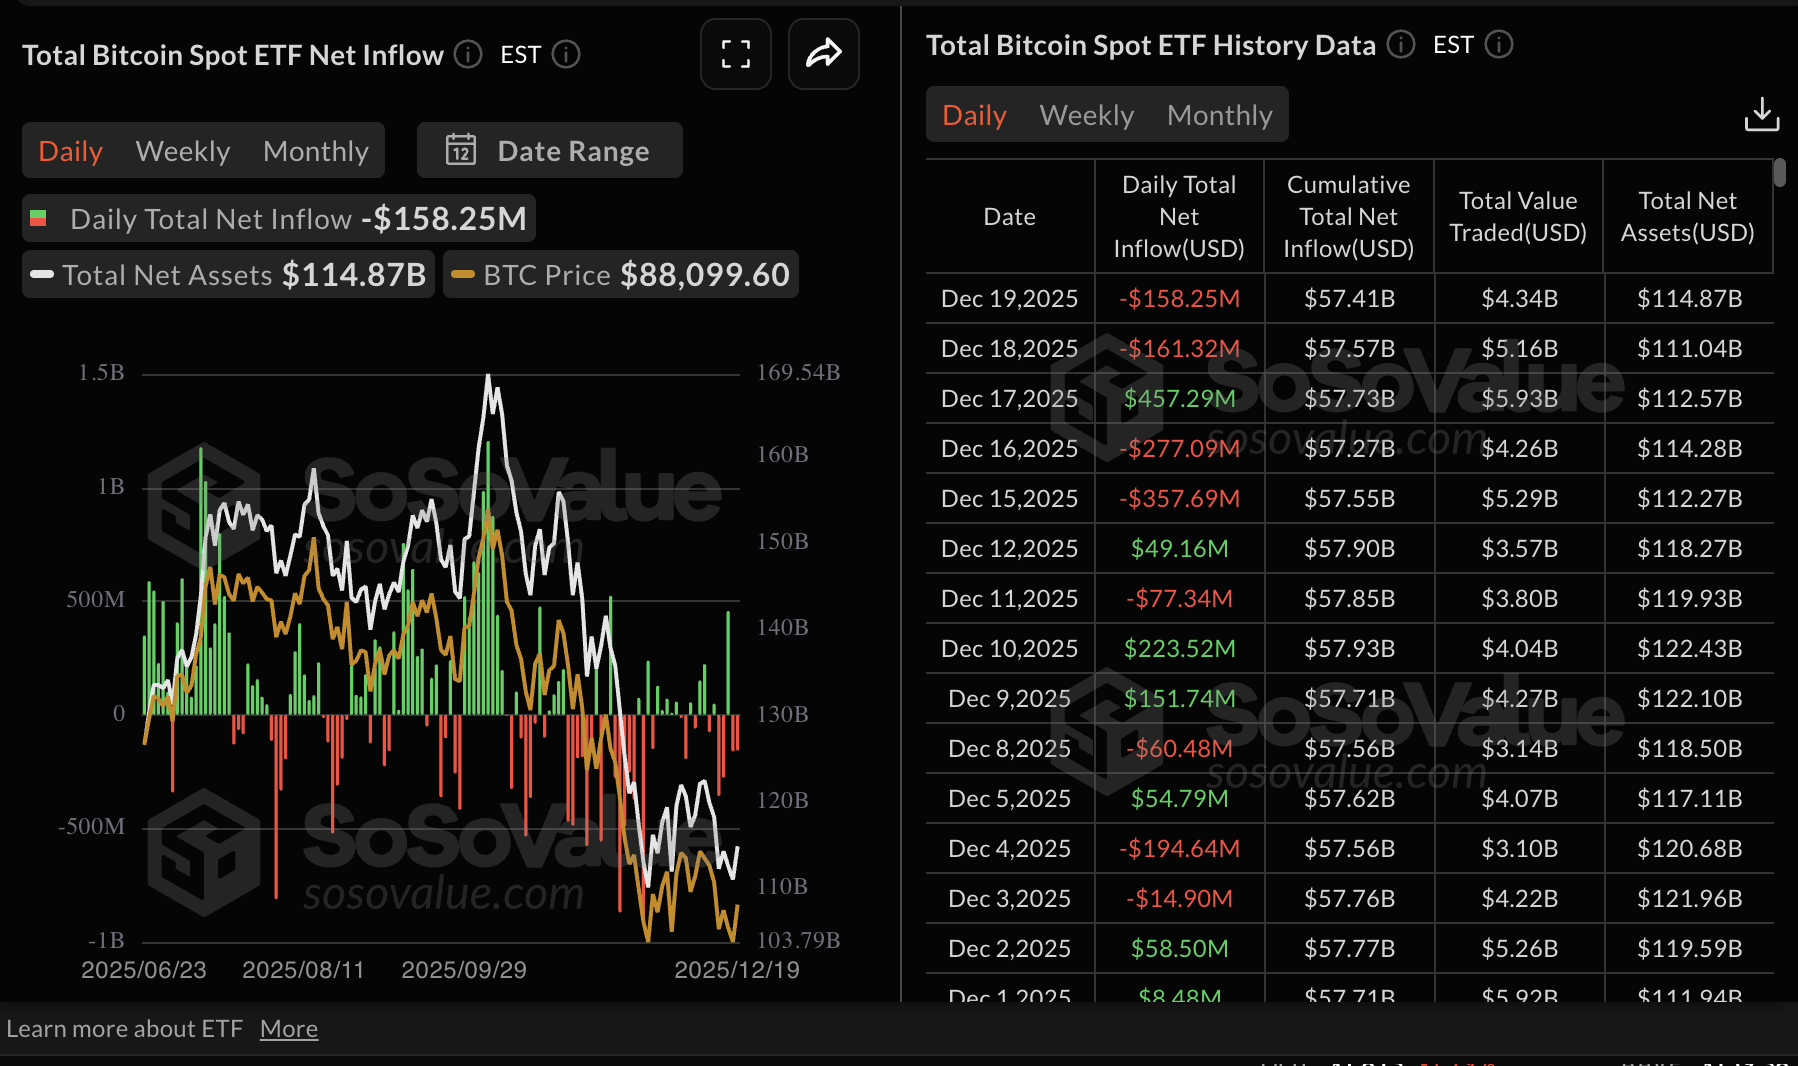
Bitcoin has continued to face a significant slump in institutional interest, with demand for spot Exchange Traded Funds (ETFs) taking a backseat. US-listed Bitcoin ETFs recorded approximately $158 million in outflows on Friday.
The cumulative net inflow now stands at $57.41 billion and net assets at approximately $114.87 billion, according to SoSoValue data. If outflows persist, market sentiment could deteriorate further, limiting price increases toward $100,000.
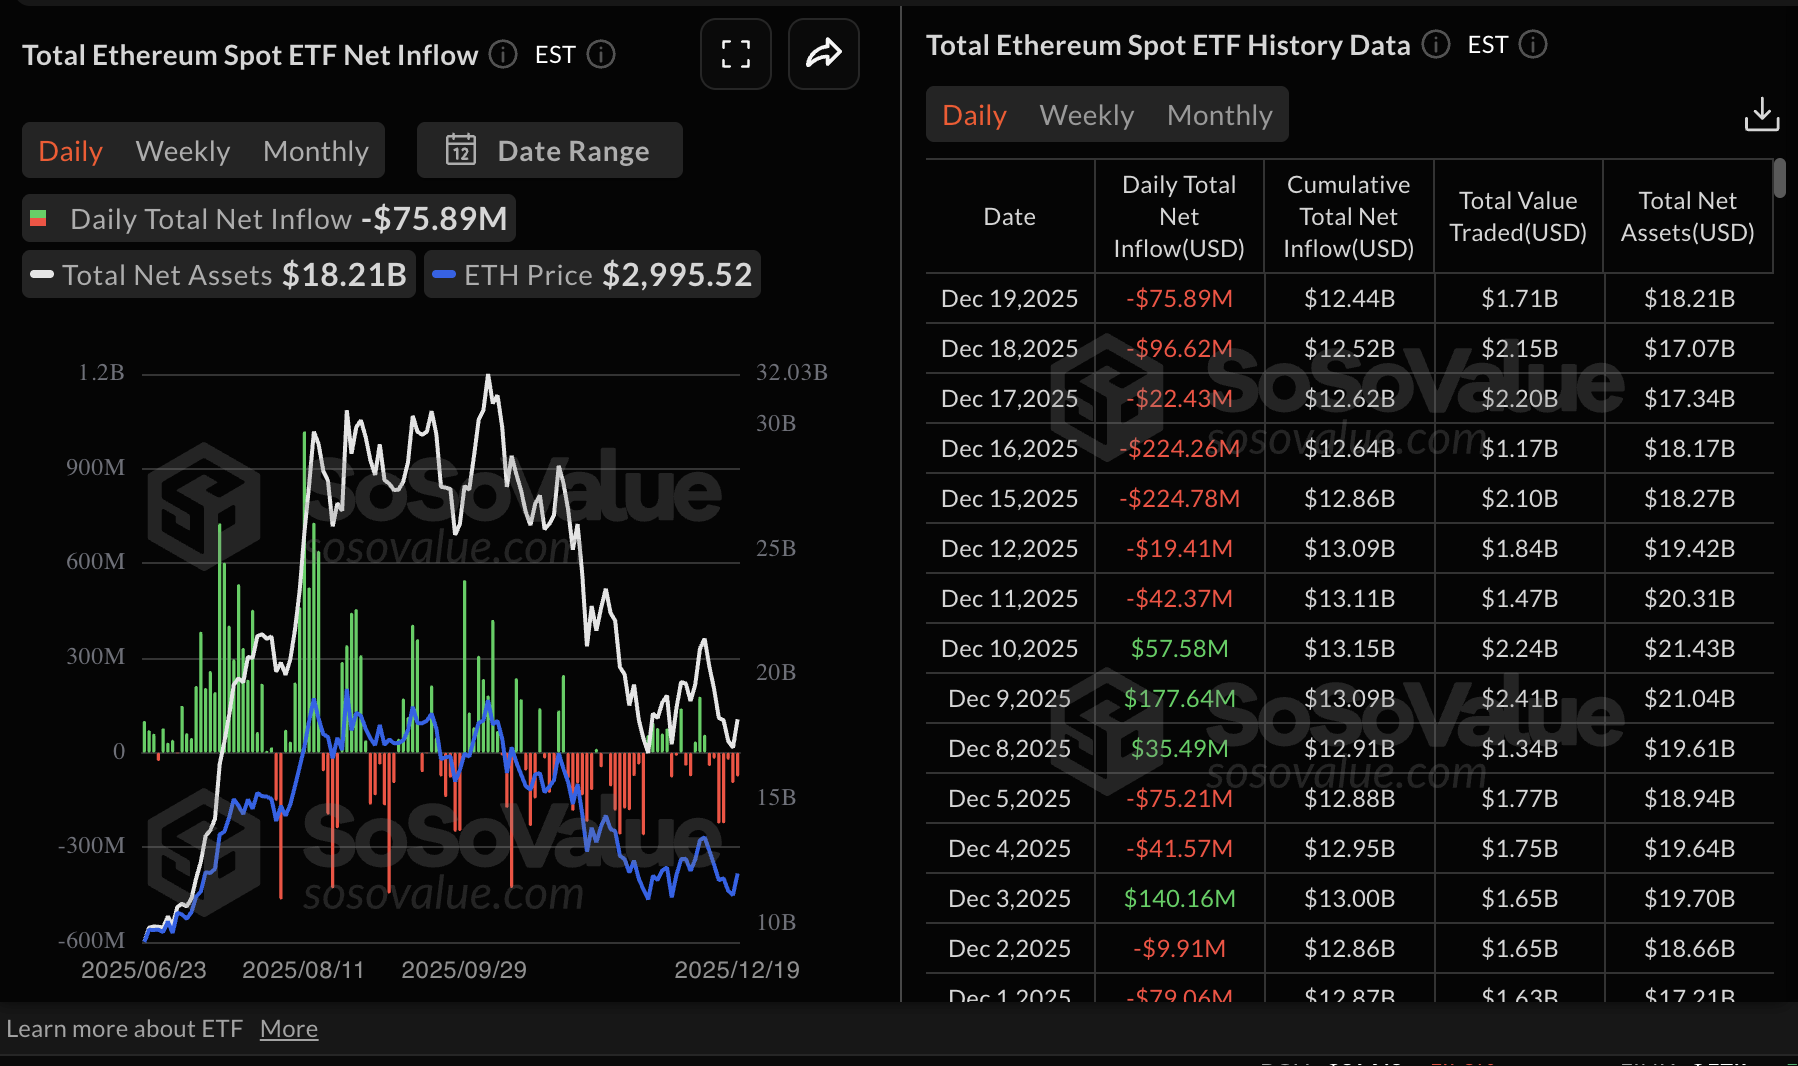
Ethereum ETFs also posted outflows of nearly $76 million on Friday. Ethereum has sustained seven consecutive days of outflows, reflecting the broader bearish sentiment in the cryptocurrency market. The cumulative net inflow stands at $12.44 billion with net assets at $18.21 billion.
XRP spot ETFs, on the other hand, continue to defy the odds by posting steady positive flows. The daily inflow into the five XRP ETF products in the US totalled approximately $13 million on Friday. XRP ETFs’ cumulative inflow volume stands at $1.07 billion, with net assets averaging $1.21 billion.
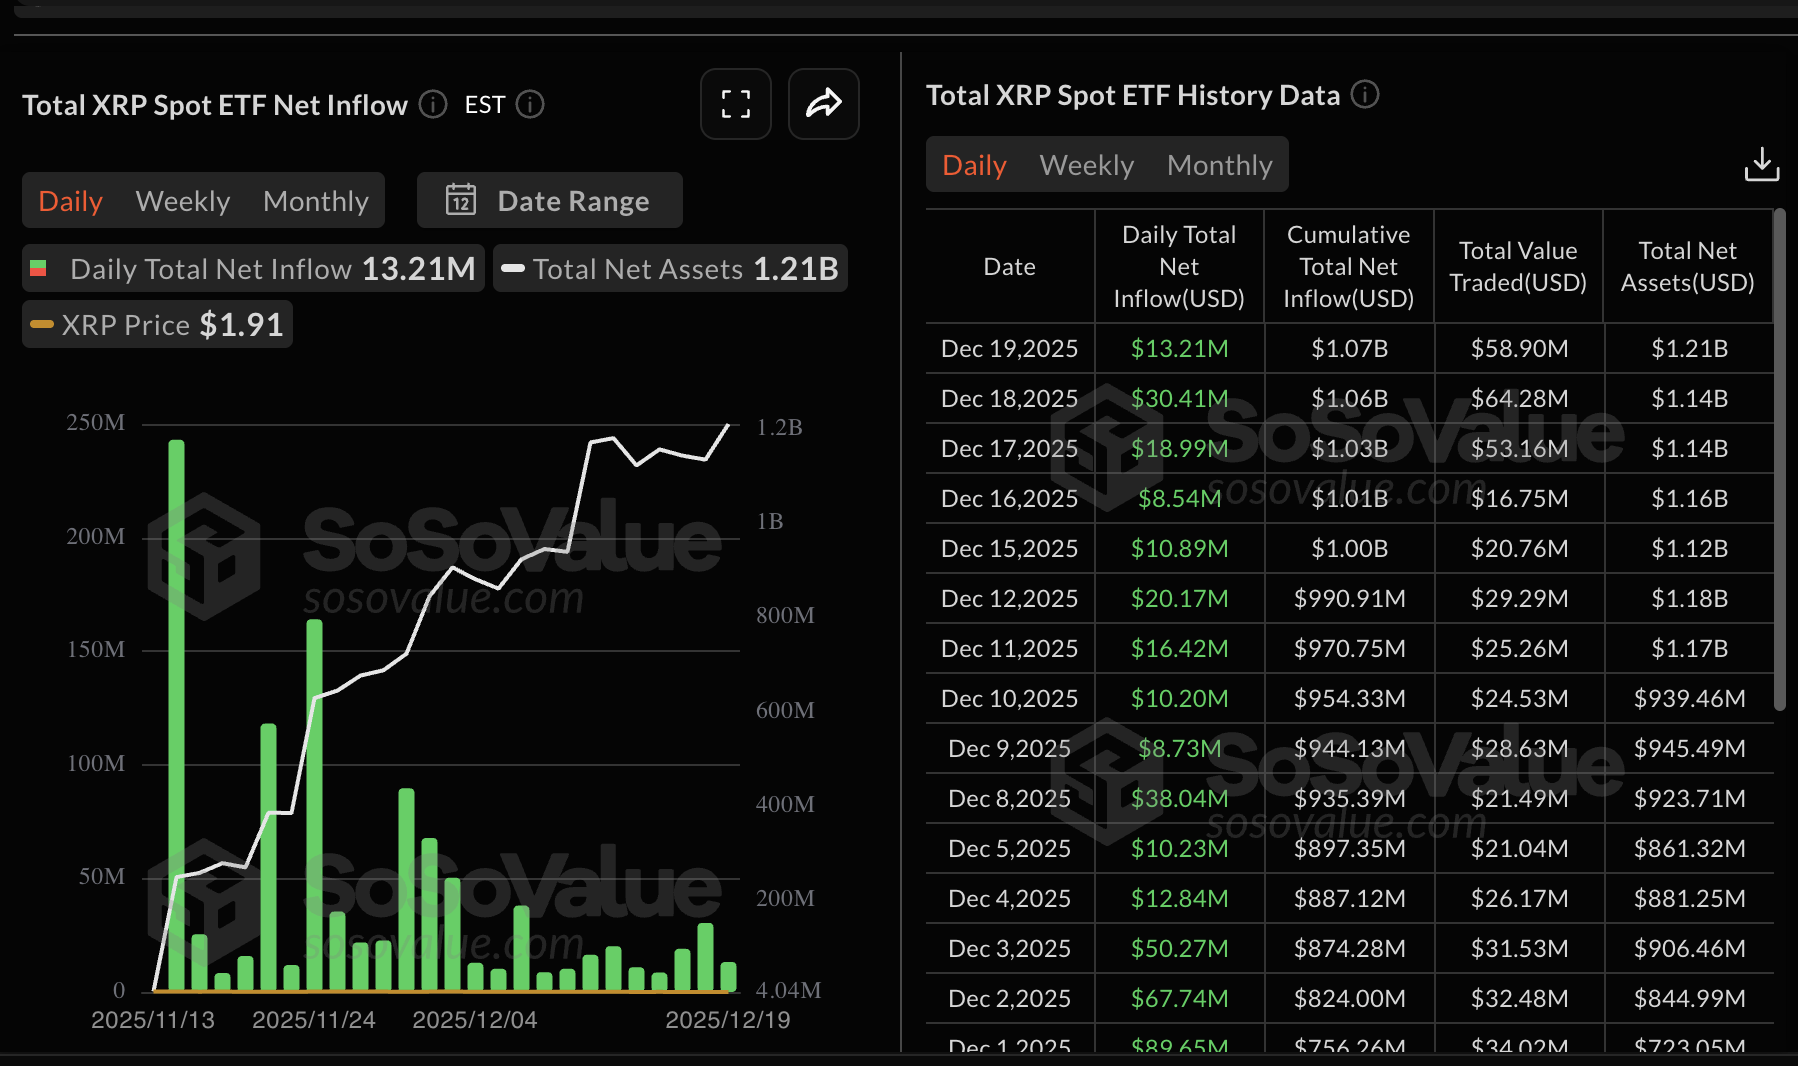
Chart of the day: Bitcoin steadies, eyeing $90,000 breakout
Bitcoin is trading above $89,000 at the time of writing on Monday, supported by an uptrending Relative Strength Index (RSI) at 48 on the daily chart. The same RSI looks poised to break above the 50 midline, which will likely boost momentum to support a breakout above $90,000.
The Moving Average Convergence Divergence (MACD) indicator maintains a positive divergence with the blue line above the red signal line on the same daily chart. If the green histogram bars continue expanding above the mean line, the path with the least resistance may remain upward.
A close above the 50-day Exponential Moving Average (EMA) at $93,608 would open the door for an extended breakout to the 100-day EMA at $99,239. The 200-day EMA at $101,987 may cap rebounds above $100,000.
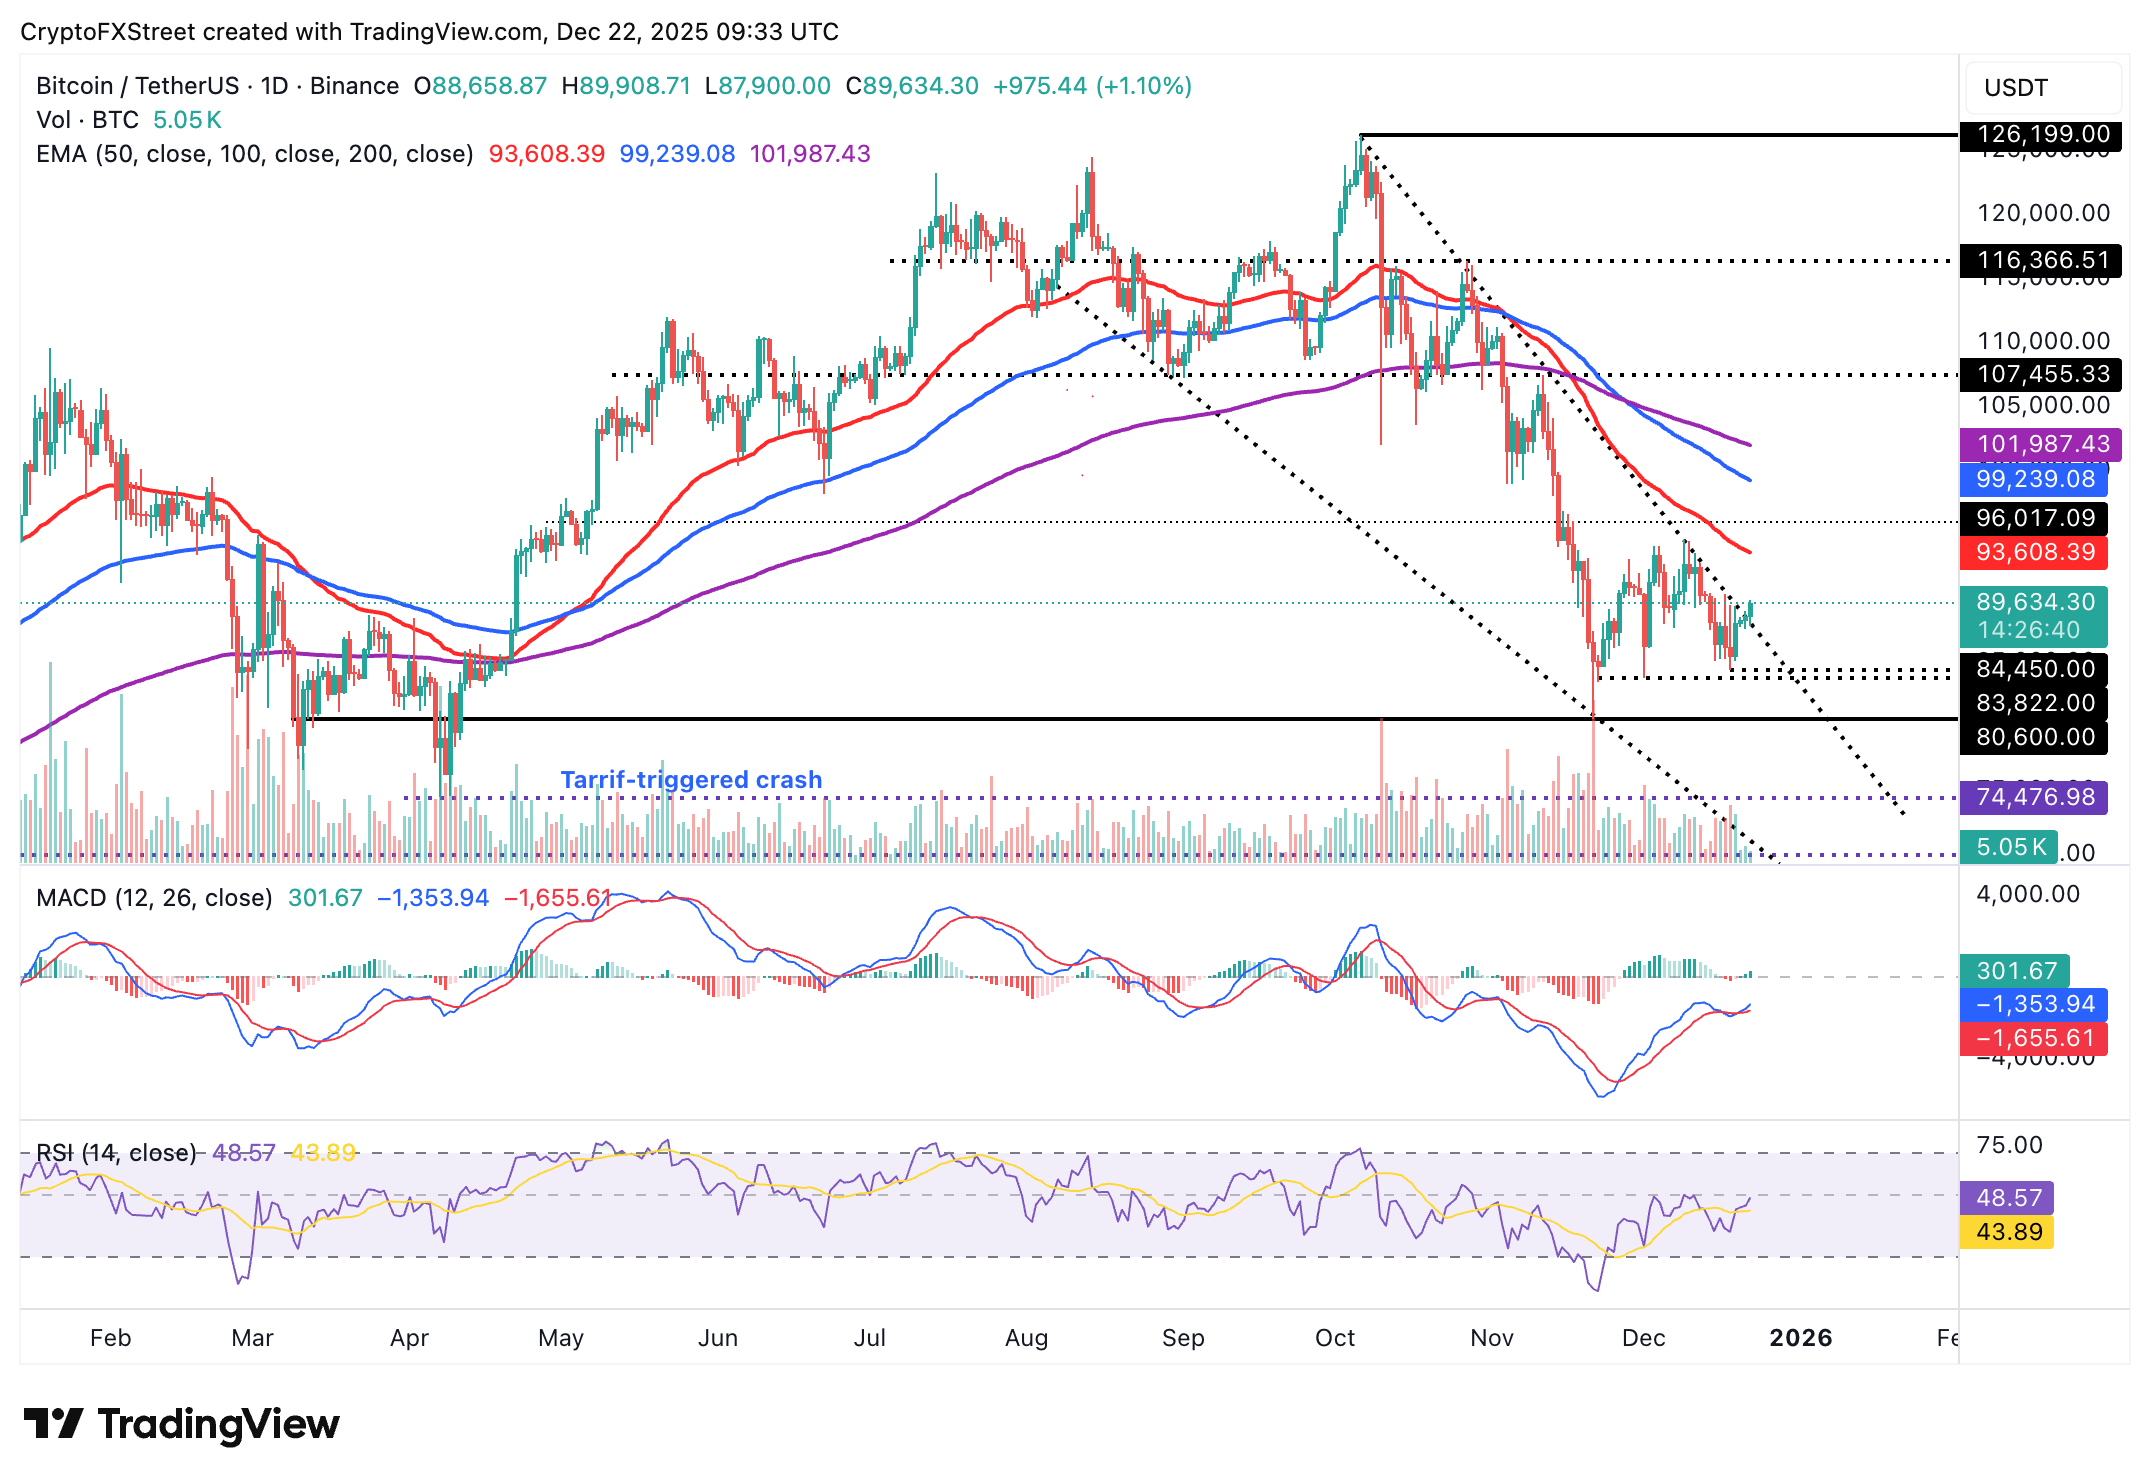
Still, the moving averages are generally sloping downward, which emphasises the bearish outlook. Hence, a close below $90,000 may trigger another sell-off, with support at $83,822-$84,450 within reach.
Altcoins update: Ethereum rises as XRP consolidates
Ethereum is trading above $3,000 at the time of writing on Monday, backed by an uptrending RSI on the daily chart. The RSI looks poised to break into the bullish region, a move that may boost momentum and steady ETH’s uptrend.
The MACD indicator on the same chart has confirmed a buy signal, as the blue line has crossed above the red signal line. Still, traders should temper their bullish expectations, considering the MACD remains in the bearish region and the green histogram above the mean is flat.
A break above the 50-day EMA at $3,195 would go a long way to confirm the bullish outlook, and plausibly increase the odds of an extended price increase above the confluence resistance created by the 100-day EMA and the 200-day EMA around $3,403.
On the other hand, failure to breach the 50-day EMA hurdle could keep Ethereum susceptible to headwinds and increase downside risks below $3,000.
As for XRP, it is struggling to hold short-term support at $1.90 despite steady institutional interest, as reflected by steady inflows into US-listed ETFs. The cross-border remittance token remains below the 50-day EMA at $2.13, the 100-day EMA at $2.31 and the 200-day EMA at $2.41, all of which slope downward, affirming the bearish outlook.
The RSI is stable at 41 on the daily chart, highlighting a bearish-leaning trend. A close above the short-term support at $1.90 may uphold XRP’s consolidation before the next breakout attempt.
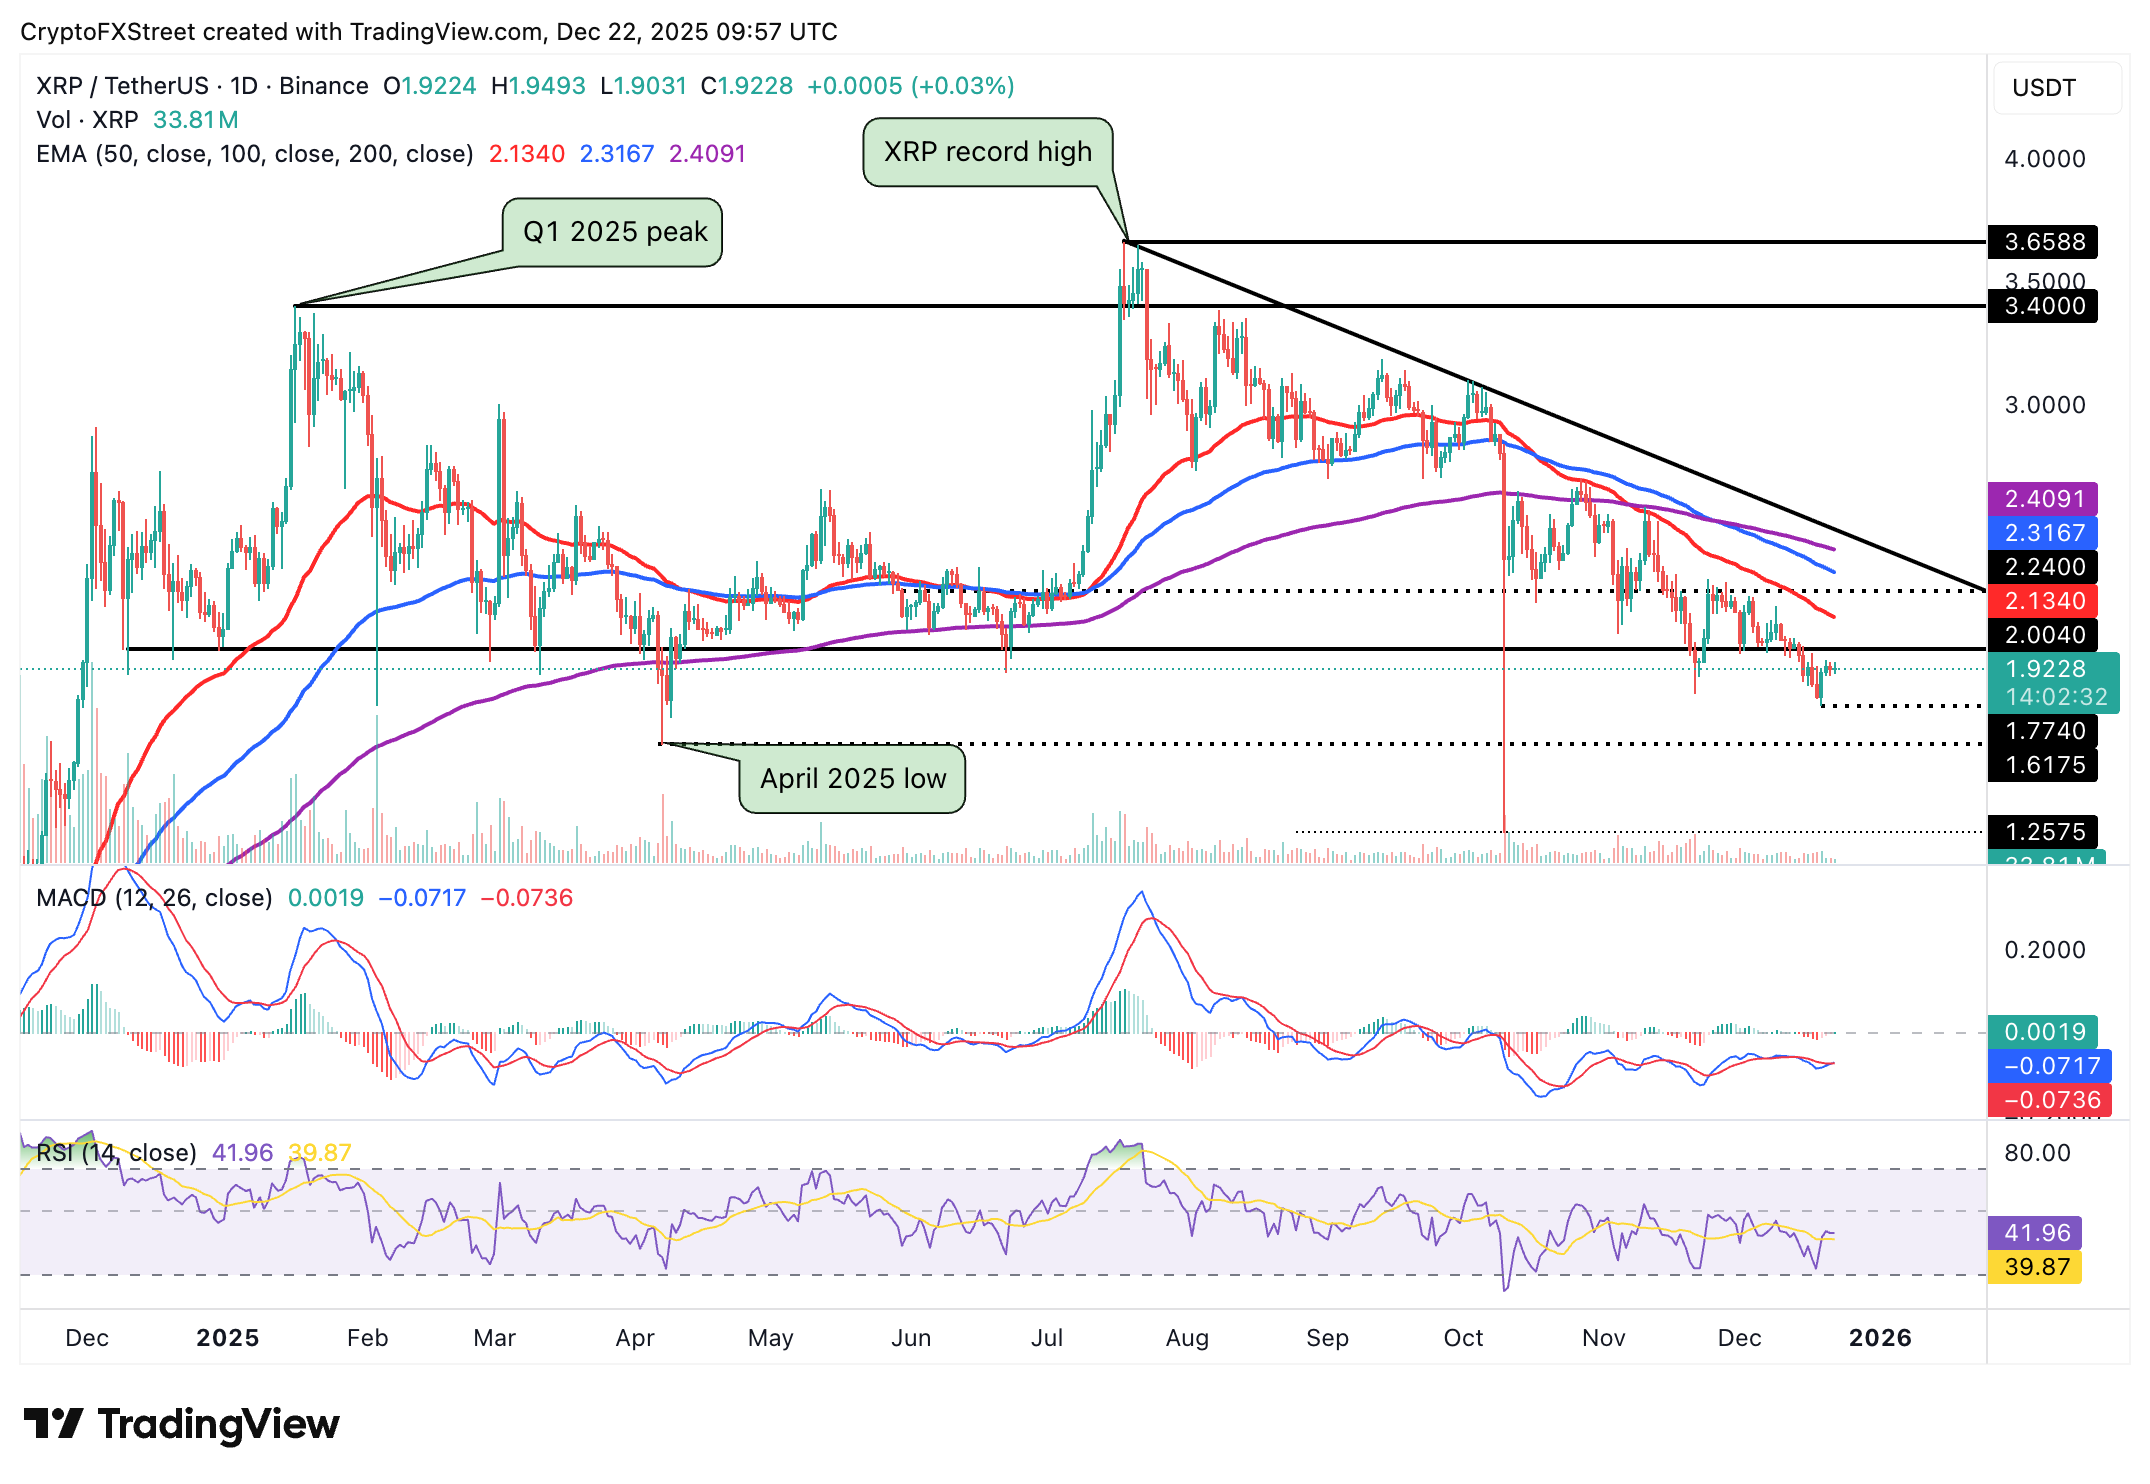
On the contrary, the MACD indicator on the same chart shows the bulls have a slight edge, as the blue line is above the red signal line. The MACD should steadily rise into the bullish region as green histogram bars expand above the mean line to ascertain XRP’s recovery potential past $2.00.
Crypto ETF FAQs
An Exchange-Traded Fund (ETF) is an investment vehicle or an index that tracks the price of an underlying asset. ETFs can not only track a single asset, but a group of assets and sectors. For example, a Bitcoin ETF tracks Bitcoin’s price. ETF is a tool used by investors to gain exposure to a certain asset.
Yes. The first Bitcoin futures ETF in the US was approved by the US Securities & Exchange Commission in October 2021. A total of seven Bitcoin futures ETFs have been approved, with more than 20 still waiting for the regulator’s permission. The SEC says that the cryptocurrency industry is new and subject to manipulation, which is why it has been delaying crypto-related futures ETFs for the last few years.
Yes. The SEC approved in January 2024 the listing and trading of several Bitcoin spot Exchange-Traded Funds, opening the door to institutional capital and mainstream investors to trade the main crypto currency. The decision was hailed by the industry as a game changer.
The main advantage of crypto ETFs is the possibility of gaining exposure to a cryptocurrency without ownership, reducing the risk and cost of holding the asset. Other pros are a lower learning curve and higher security for investors since ETFs take charge of securing the underlying asset holdings. As for the main drawbacks, the main one is that as an investor you can’t have direct ownership of the asset, or, as they say in crypto, “not your keys, not your coins.” Other disadvantages are higher costs associated with holding crypto since ETFs charge fees for active management. Finally, even though investing in ETFs reduces the risk of holding an asset, price swings in the underlying cryptocurrency are likely to be reflected in the investment vehicle too.
추천 기사


