
Bitcoin Price Forecast: BTC extends sell-off, approaching December lows
- Bitcoin price trades below $86,000 on Tuesday, extending its decline to five consecutive days.
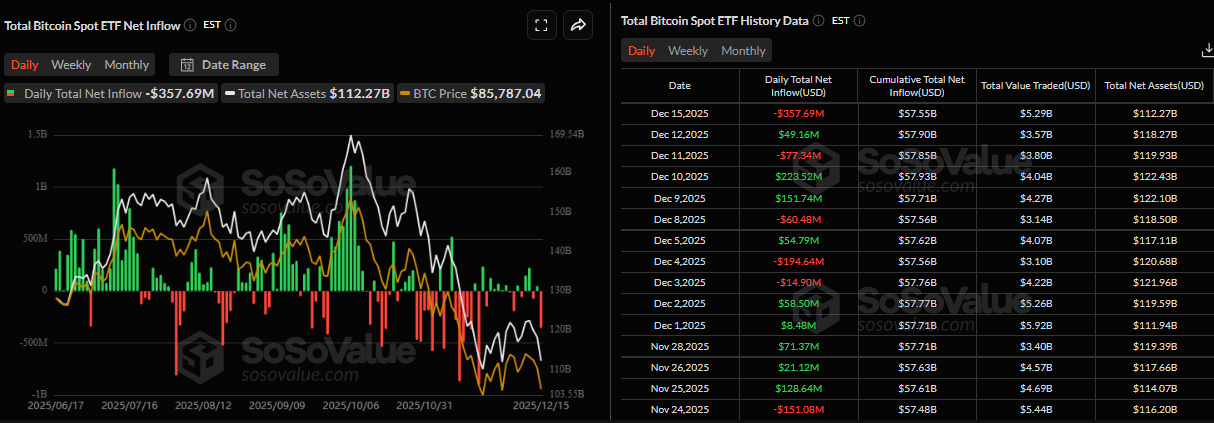
- Spot Bitcoin ETFs record a $358 million outflow, while Strategy adds 10,645 BTC to its reserves.
- A recent boost of liquidity in the US, together with Fed bond purchases, could provide near-term support for BTC.
Bitcoin (BTC) continues its price correction, trading below $86,000 at the time of writing on Tuesday, marking its fifth consecutive day of decline. Mixed sentiment is seen among institutional investors, as Spot Bitcoin Exchange Traded Funds record outflows while Strategy adds BTC to its reserves. Despite weakness in current price action, improving liquidity conditions in the US could help limit further near-term downside.
Mixed sentiment among institutional investors
Institutional demand started the week on a negative note. SoSoValue data show that Spot Bitcoin ETFs recorded an outflow of $357.69 million on Monday, the largest single-day outflow since November 20. If these outflows continue and intensify, the Bitcoin price could see further correction.
However, on the corporate front, Strategy Executive Chairman Michael Saylor announced on Monday that his company Strategy Inc. (MSTR) purchased 10,645 Bitcoin for $980 million. This purchase followed last week’s buy-in of 10,624 BTC, highlighting the firm’s continued aggressive accumulation strategy and long-term conviction in Bitcoin despite ongoing market weakness.

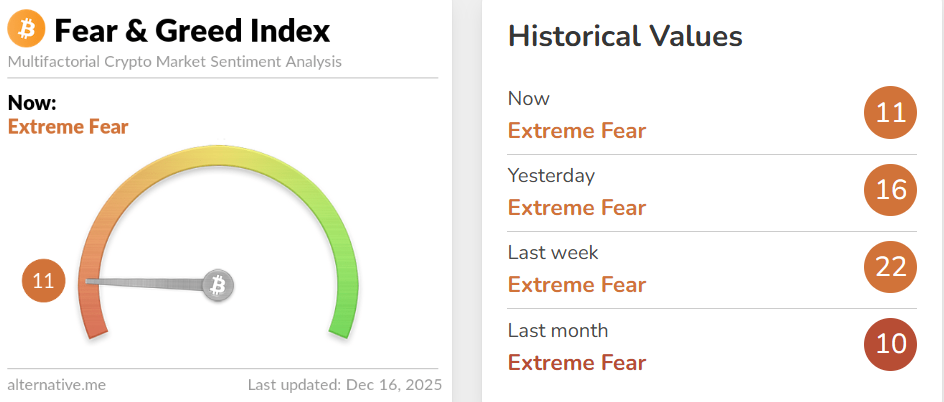
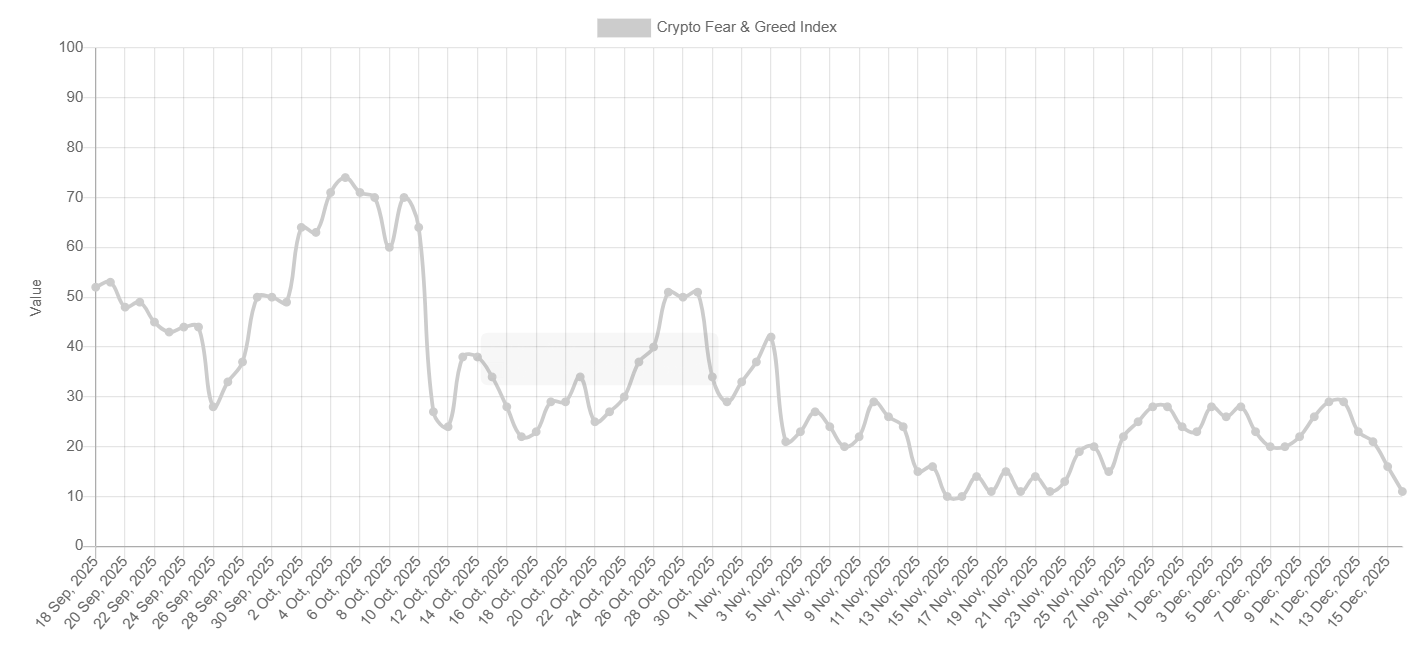
Extreme fear among BTC traders
The Fear and Greed Index has fallen to 11 on Tuesday, nearing the end of November lows, indicating a sharp shift toward extreme fear as market participants brace for further downside.
Some signs of optimism
Beyond mixed sentiment among institutional investors and extreme fear among traders, The Kobeissi Letter X post on Tuesday hints at signs of optimism for BTC.
The report explained that the Treasury General Account (TGA) dropped to $78 billion over the last week, the largest liquidity injection since June, as shown in the chart below. The analyst noted that the TGA is the US government’s primary cash account at the Federal Reserve (Fed), and that when it declines, cash flows directly into the financial system, boosting liquidity.
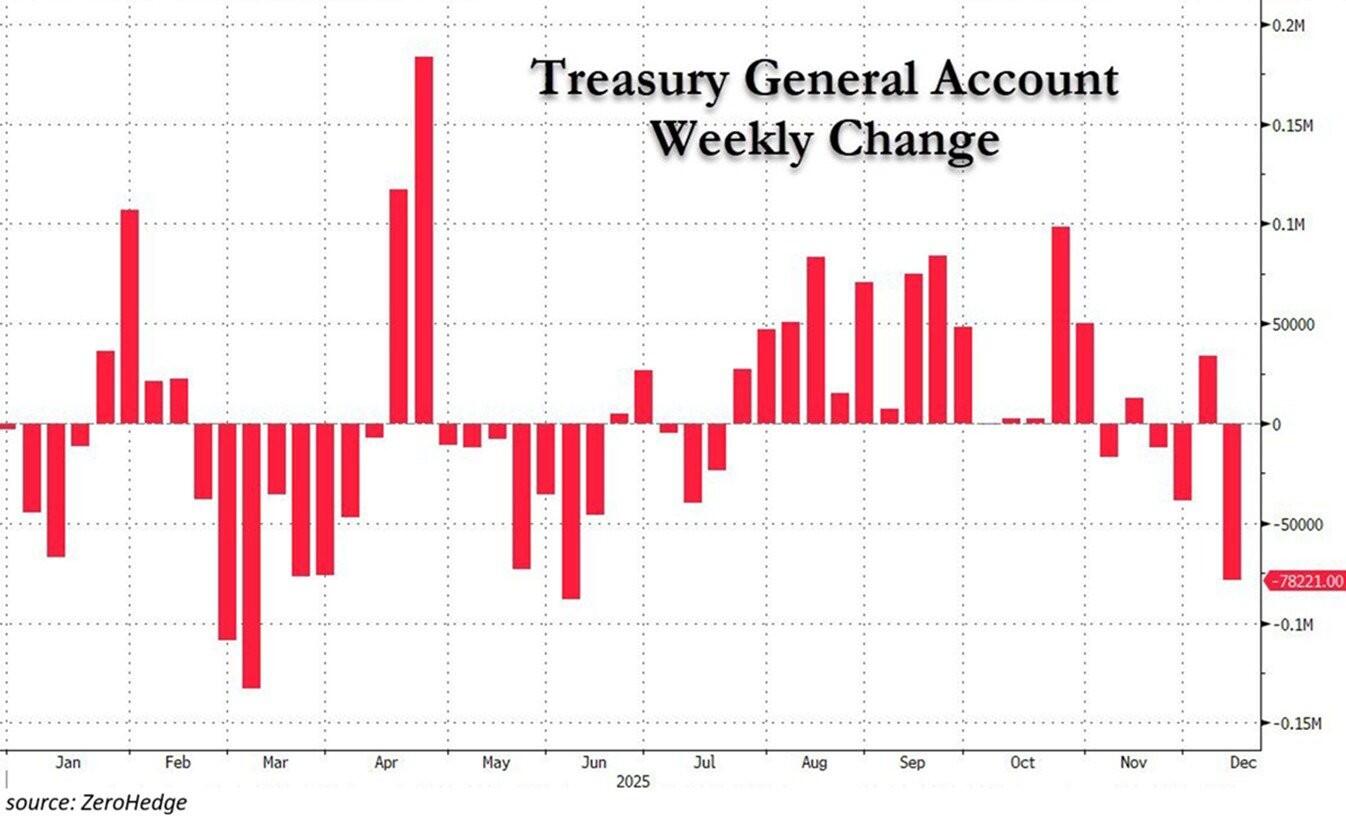
Furthermore, the Federal Reserve is injecting $40 billion through bond purchases and will reinvest $14.4 billion in principal payments from its Mortgage-Backed Securities (MBS) to purchase Treasury bills over the same period, thereby amplifying overall liquidity conditions.
This wave of net liquidity injection into financial markets will make borrowing cheaper and encourage risk-on sentiment, particularly in assets such as stocks and cryptocurrencies, providing near-term support for BTC.
Bitcoin Price Forecast: BTC momentum indicators suggest deeper correction
Bitcoin price was rejected from a descending trendline (drawn by connecting multiple highs since early October) on Friday and has declined nearly 7% since then, retesting the $85,569 support level of Monday. This trendline coincided with the 61.8% Fibonacci retracement level at $94,253 (drawn from the April low of $74,508 to the all-time high of $126,199 set in October), making it a key resistance zone. As of Tuesday, BTC continues to trade down at around $86,100.
If BTC continues its correction and closes below $85,569 on a daily basis, which aligns with the 78.6% Fibonacci retracement, it could extend the decline toward the psychological $80,000 level.
The Relative Strength Index (RSI) on the daily chart is at 36, below its neutral level of 50, indicating bearish momentum gaining traction. Moreover, the Moving Average Convergence Divergence (MACD) indicator is showing a bearish crossover on Tuesday, further supporting the negative outlook.
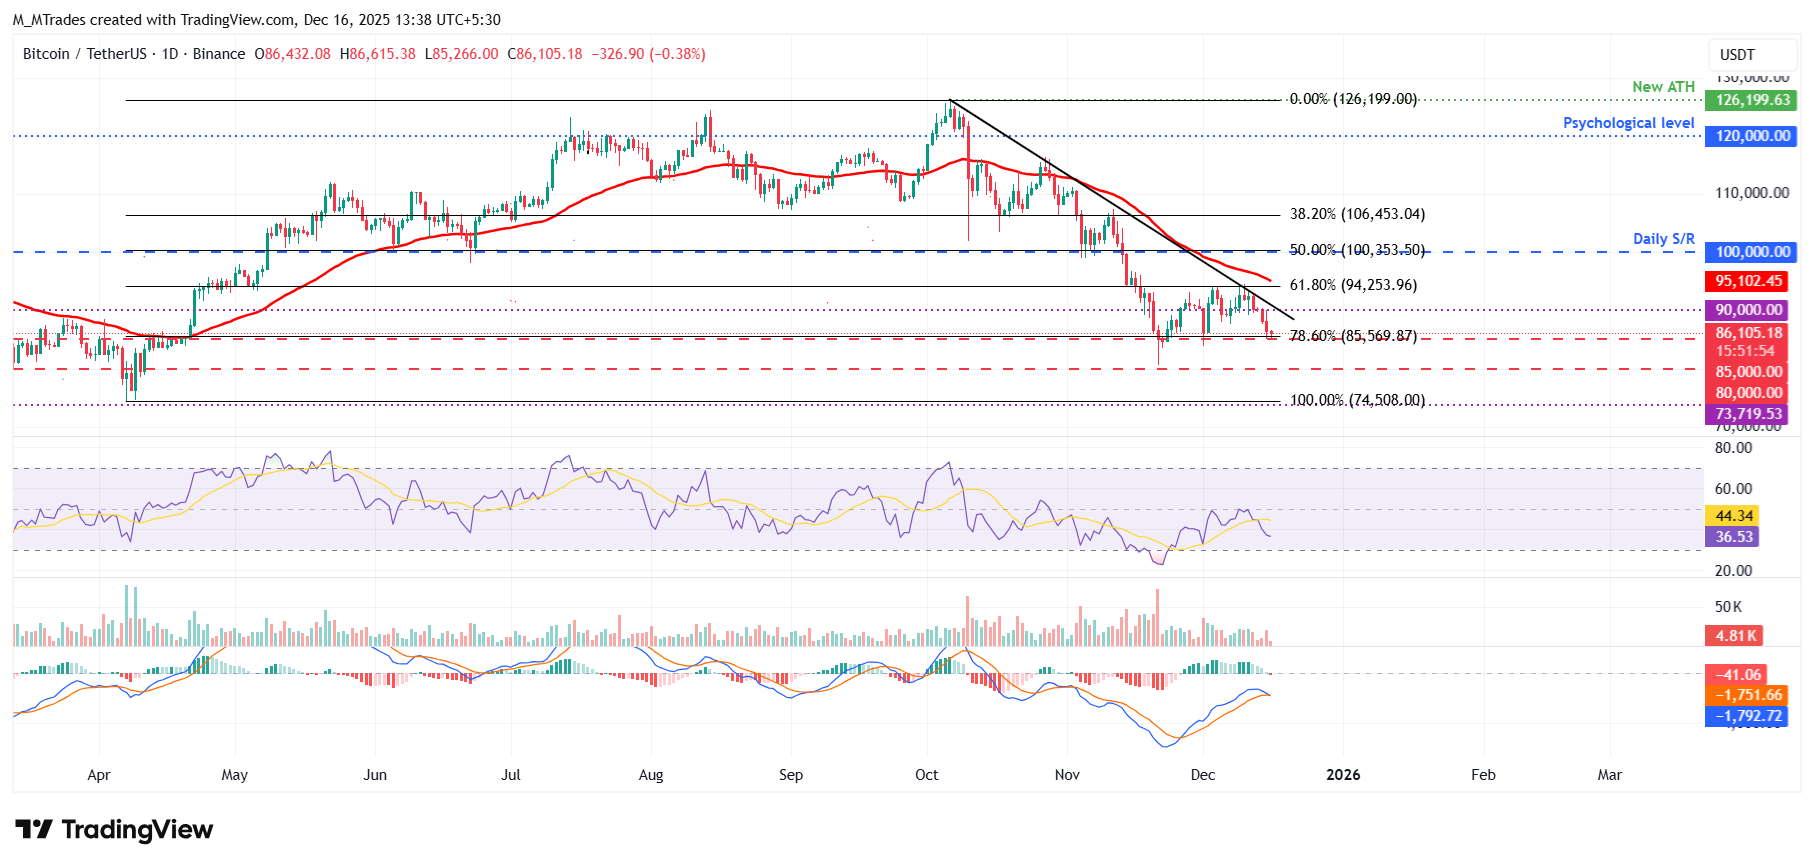
If BTC recovers, it could extend the advance toward the 61.8% Fibonacci retracement level at $94,253.
Bitcoin, altcoins, stablecoins FAQs
Bitcoin is the largest cryptocurrency by market capitalization, a virtual currency designed to serve as money. This form of payment cannot be controlled by any one person, group, or entity, which eliminates the need for third-party participation during financial transactions.
Altcoins are any cryptocurrency apart from Bitcoin, but some also regard Ethereum as a non-altcoin because it is from these two cryptocurrencies that forking happens. If this is true, then Litecoin is the first altcoin, forked from the Bitcoin protocol and, therefore, an “improved” version of it.
Stablecoins are cryptocurrencies designed to have a stable price, with their value backed by a reserve of the asset it represents. To achieve this, the value of any one stablecoin is pegged to a commodity or financial instrument, such as the US Dollar (USD), with its supply regulated by an algorithm or demand. The main goal of stablecoins is to provide an on/off-ramp for investors willing to trade and invest in cryptocurrencies. Stablecoins also allow investors to store value since cryptocurrencies, in general, are subject to volatility.
Bitcoin dominance is the ratio of Bitcoin's market capitalization to the total market capitalization of all cryptocurrencies combined. It provides a clear picture of Bitcoin’s interest among investors. A high BTC dominance typically happens before and during a bull run, in which investors resort to investing in relatively stable and high market capitalization cryptocurrency like Bitcoin. A drop in BTC dominance usually means that investors are moving their capital and/or profits to altcoins in a quest for higher returns, which usually triggers an explosion of altcoin rallies.
추천 기사


