
Pump.fun Price Forecast: PUMP shows bullish signs despite falling revenue, DEX volume
- Pump.fun extends recovery for the second day in tandem with the broader cryptocurrency market.
- The MACD is poised to trigger a buy signal while the RSI rises, supporting bullish momentum.
- The meme coin launchpad's volume and revenue freefall mirror risk-off sentiment.
Pump.fun (PUMP) edges higher, trading marginally above $0.0040 after pulling back from an intraday high of $0.0042 on Friday. The meme coin launchpad native token builds on a bullish wave in the broader cryptocurrency market, which propelled Bitcoin (BTC) above $111,000 earlier in the day.
Pump.fun launchpad revenue, DEX volume shrink
Pump.fun's dominance in the meme coin launchpad sector largely stems from the platform's user-friendly features, fast transaction speeds, and low transaction fees. The platform's revenue exceeded $44 million in January but declined in the following months through to August before picking up pace in September, following the launch of PUMP, the native token.
According to DefiLlama, Pump.fun's revenue increased to $12.2 million for the week ending September 14. The surge coincided with PUMP's price hitting a new record high of $0.0089.
However, the trend has since been downhill, with the revenue count averaging $3.7 million so far this week. The steep decline comes amid a wider correction in the cryptocurrency market, driven by risk-off sentiment stemming from macroeconomic uncertainty, the prolonged United States (US) government shutdown and the lack of price catalysts within the cryptocurrency industry.
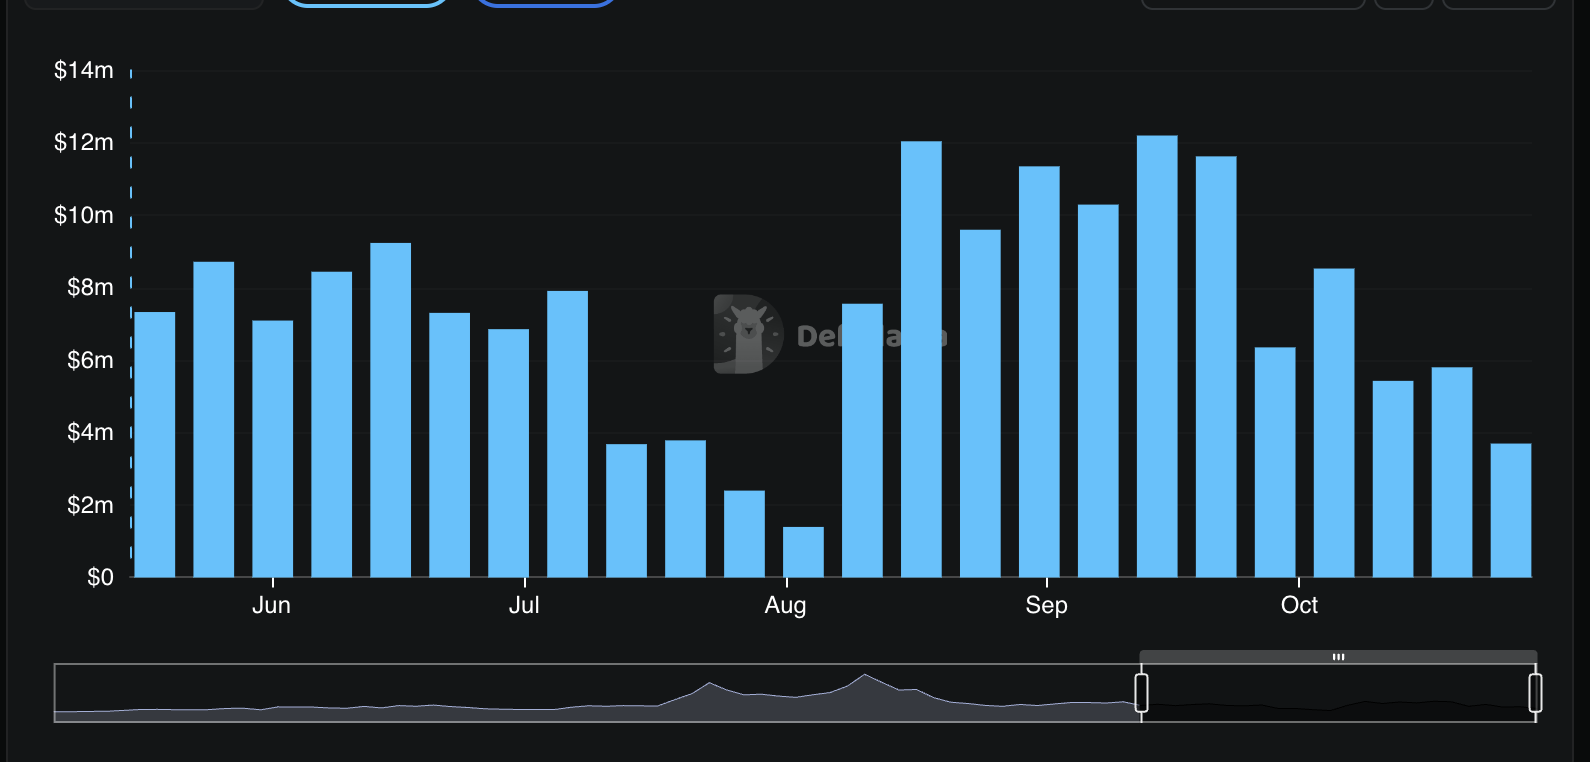
Pump.fun revenue | Source: DefiLlama
Pump.fun's Decentralized Exchange (DEX) trading volume also peaked at $976 million in the week ending September 21, the highest level in the third quarter, followed by a steady decline to approximately $276 million this week. The drop in DEX volume highlights slowing activity in the meme coin sector, often driven by sentiment and euphoria. If the trend persists in the coming days and weeks, it could become increasingly difficult to sustain the PUMP price recovery, further dampening investor interest.
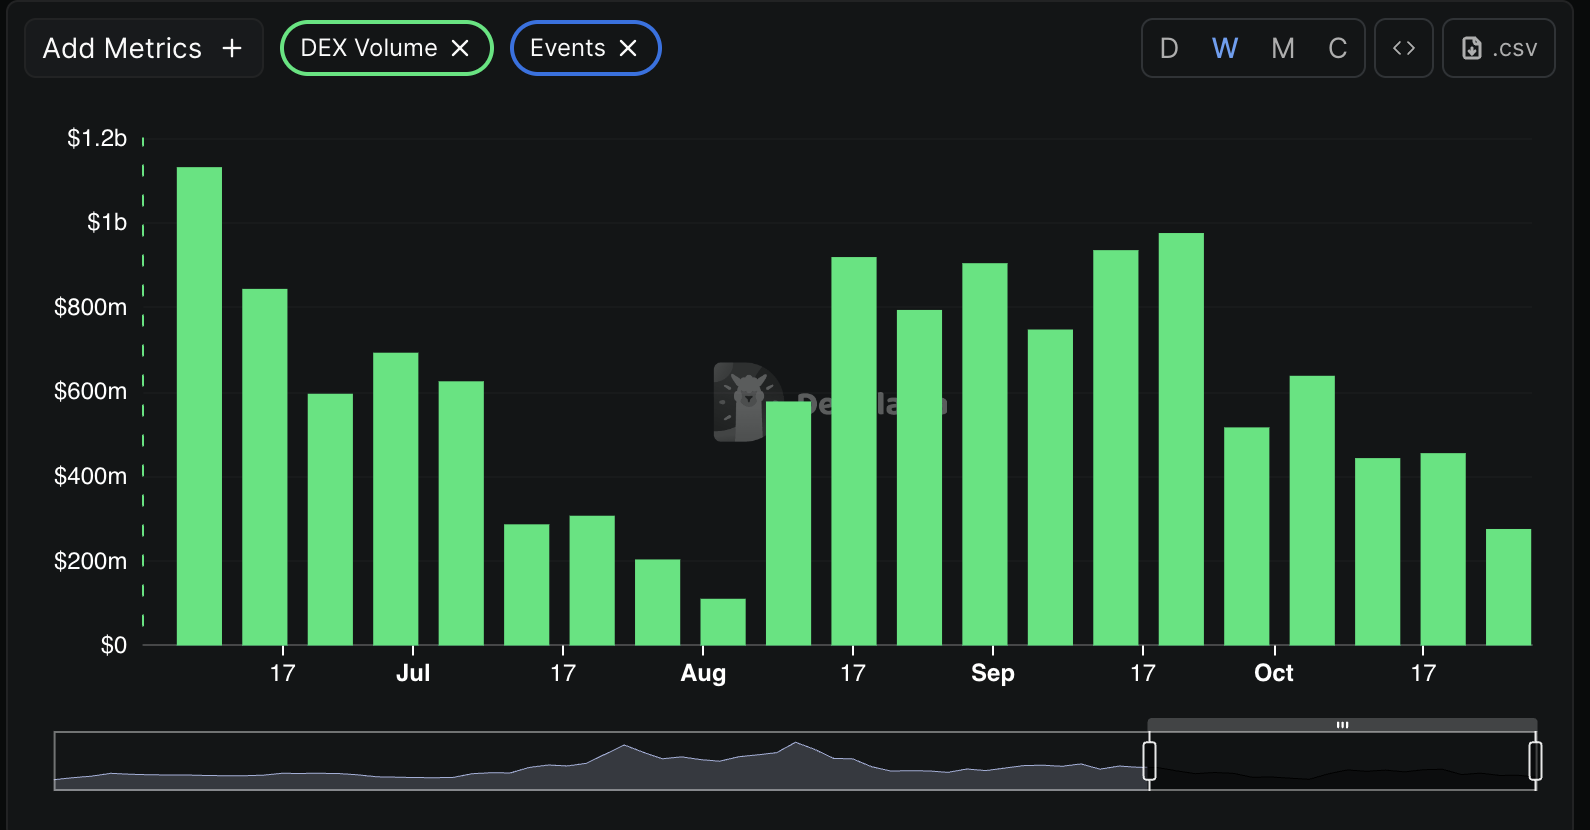
Pump.fun DEX Volume | Source: DefiLlama
Technical outlook: PUMP bulls regain control
Pump.fun is trading above $0.0040, marking the second consecutive day of gains amid improving sentiment in the broader cryptocurrency market. The upward-trending Relative Strength Index (RSI) at 42 indicates easing of bearish momentum. Recovery above the midline further affirms the bullish outlook, increasing the odds of a steady uptrend.
Traders should watch for a potential buy signal from the Moving Average (EMA) on the daily chart. This signal occurs when the blue line crosses above the red signal line as the indicator generally rises, encouraging investors to increase their risk exposure.
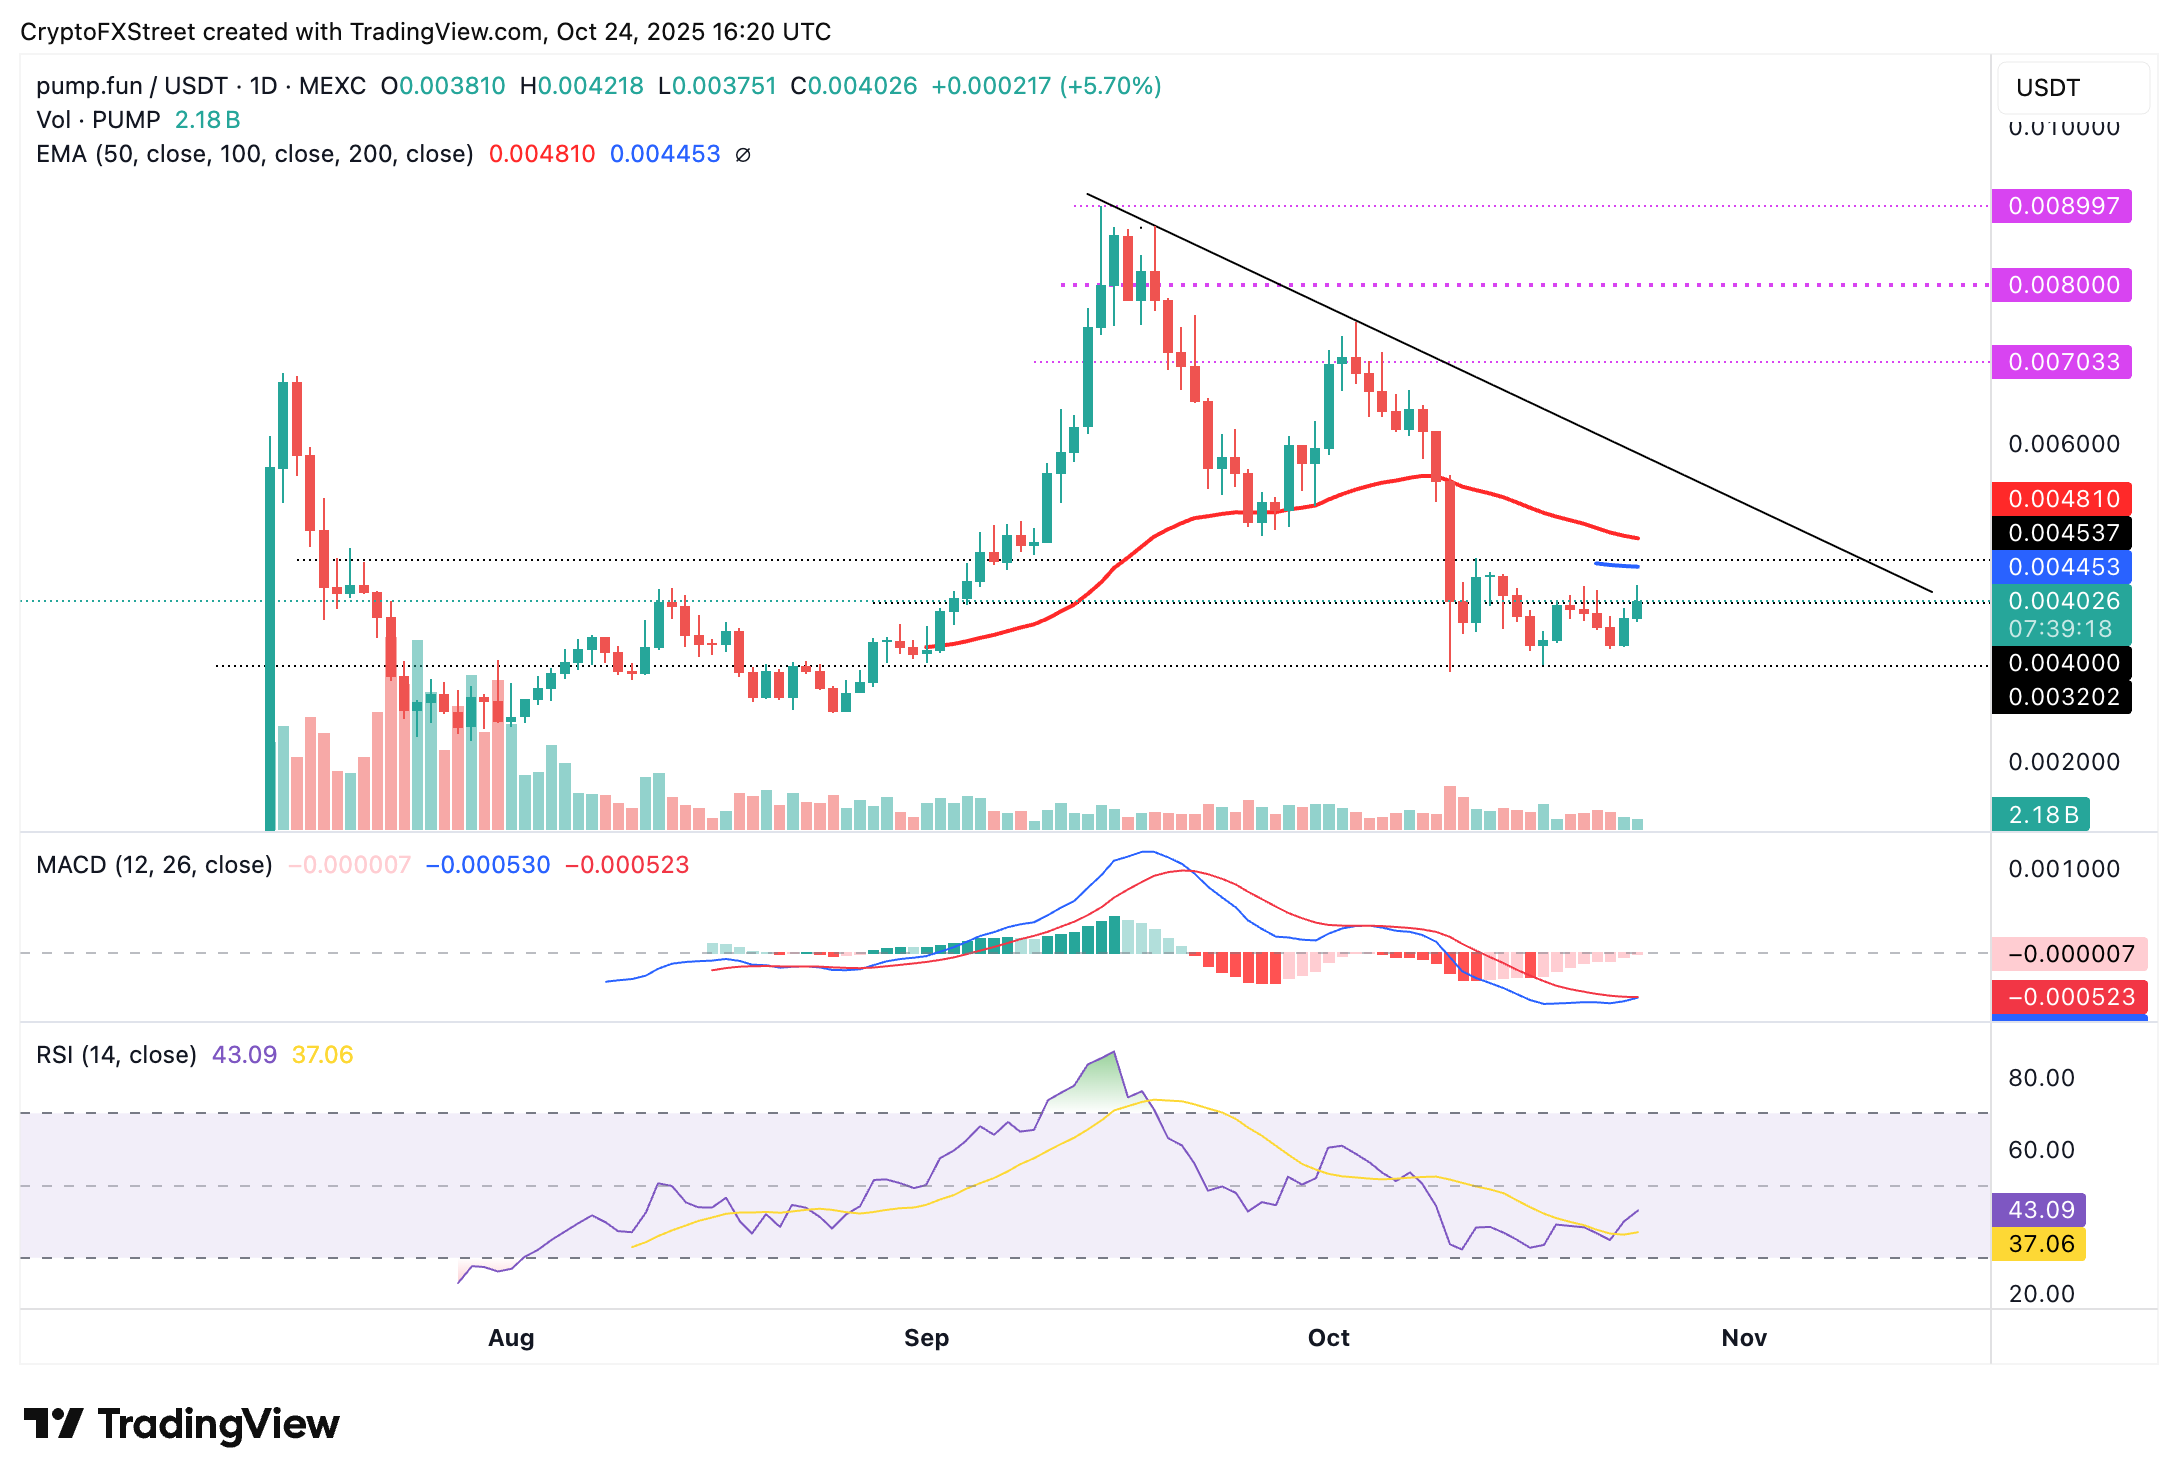
PUMP/USDT daily chart
The next key level is the 200-day Exponential Moving Average (EMA) at $0.0043. A break above this resistance would reinforce the bullish outlook, but traders should remain cautiously optimistic amid potential early profit-taking. The previous support at $0.0032 is in line to absorb selling pressure if the decline resumes.
Cryptocurrency metrics FAQs
The developer or creator of each cryptocurrency decides on the total number of tokens that can be minted or issued. Only a certain number of these assets can be minted by mining, staking or other mechanisms. This is defined by the algorithm of the underlying blockchain technology. On the other hand, circulating supply can also be decreased via actions such as burning tokens, or mistakenly sending assets to addresses of other incompatible blockchains.
Market capitalization is the result of multiplying the circulating supply of a certain asset by the asset’s current market value.
Trading volume refers to the total number of tokens for a specific asset that has been transacted or exchanged between buyers and sellers within set trading hours, for example, 24 hours. It is used to gauge market sentiment, this metric combines all volumes on centralized exchanges and decentralized exchanges. Increasing trading volume often denotes the demand for a certain asset as more people are buying and selling the cryptocurrency.
Funding rates are a concept designed to encourage traders to take positions and ensure perpetual contract prices match spot markets. It defines a mechanism by exchanges to ensure that future prices and index prices periodic payments regularly converge. When the funding rate is positive, the price of the perpetual contract is higher than the mark price. This means traders who are bullish and have opened long positions pay traders who are in short positions. On the other hand, a negative funding rate means perpetual prices are below the mark price, and hence traders with short positions pay traders who have opened long positions.
추천 기사


