
Crypto Today: Bitcoin, Ethereum, XRP eye October lows as sell-off intensifies
- Bitcoin extends decline below $105,000 as risk-off sentiment persists in October.
- Ethereum struggles to hold $3,700 support, reflecting weak retail and institutional hands.
- XRP risks falling to $2.00 amid a weak technical structure and negative market sentiment.
Bitcoin (BTC) is experiencing its second bearish Friday in a row, trading below $105,000 at the time of writing as sentiment remains bearish in the broader cryptocurrency market.
Altcoins are bearing the biggest brunt, with Ethereum (ETH) dropping to $3,700 and Ripple (XRP) sliding below a key support at $2.22. The total market capitalization is down 6% over the past 24 hours to $3.76 trillion after peaking at $4.38 trillion on October 7, according to CoinGecko.
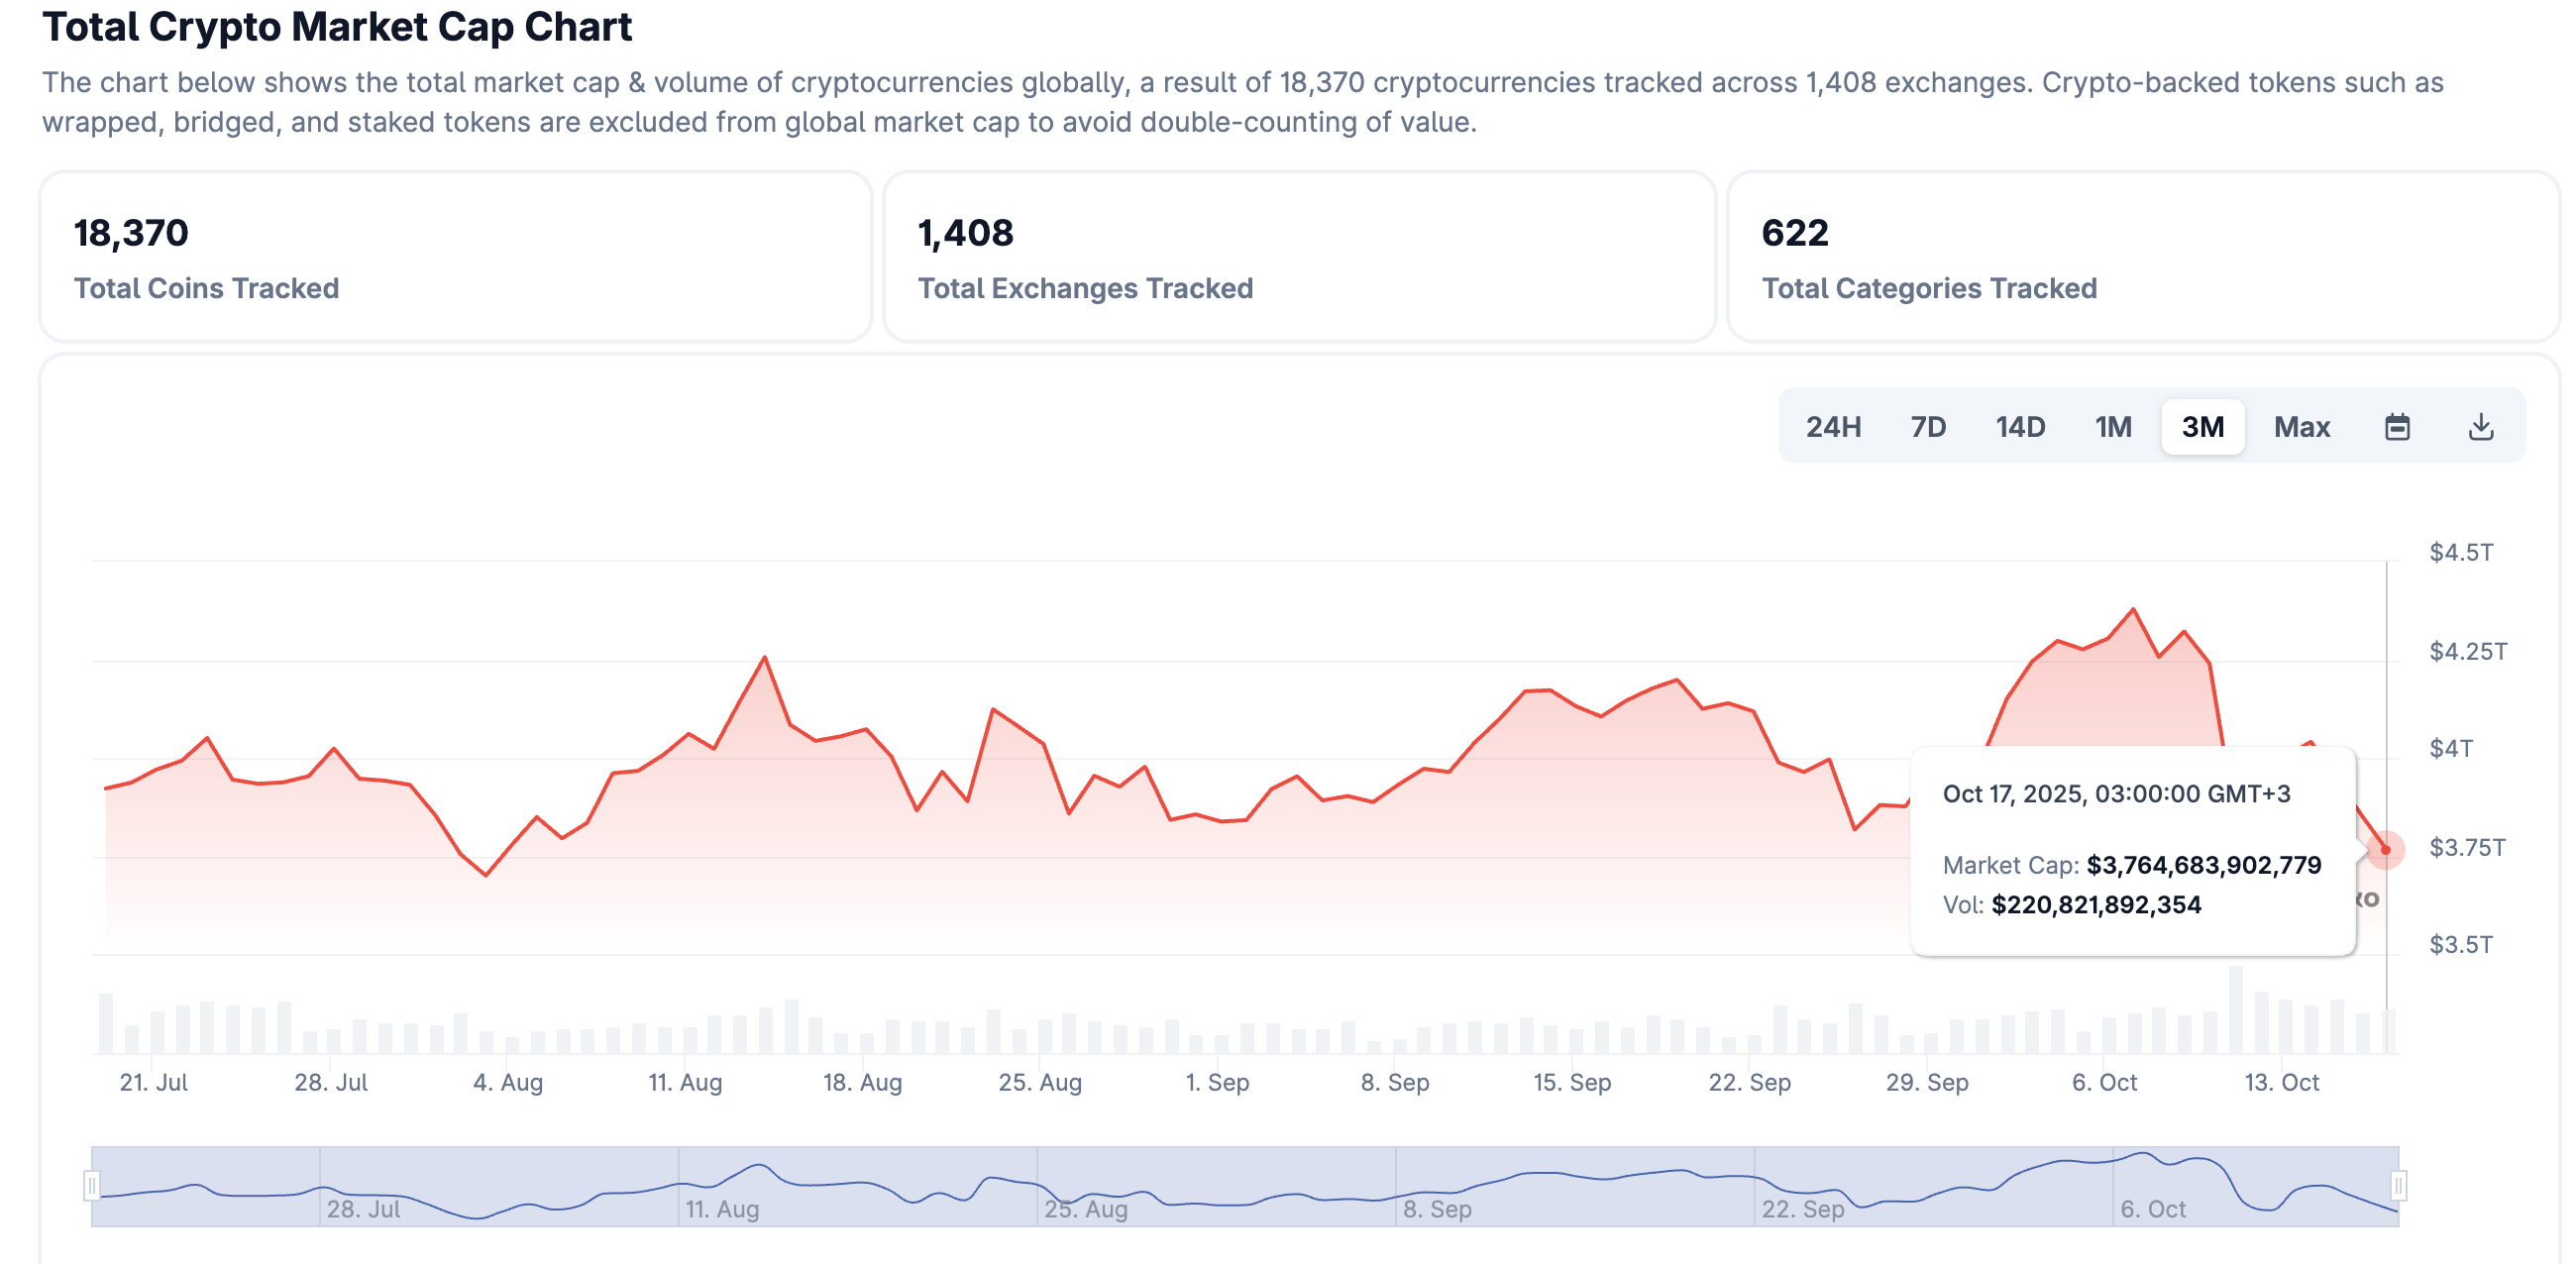
Crypto market capitalization | Source: CoinGecko
Data spotlight: Institutional and retail interest dips as crypto sell-off continues
Demand for crypto assets and related financial products such as Exchange Traded Funds (ETFs) has remained significantly suppressed since last week’s deleveraging event, which left many positions liquidated.
US-based Bitcoin ETFs extended the bearish streak, with $536 million in outflows on Thursday, the highest since August 19. On Wednesday, BTC ETFs recorded $104 million in net outflows, reinforcing the bearish outlook. If investors continue staying on the sidelines, overhead pressure will make sustaining recovery difficult, leaving the BTC price more susceptible to further decline.
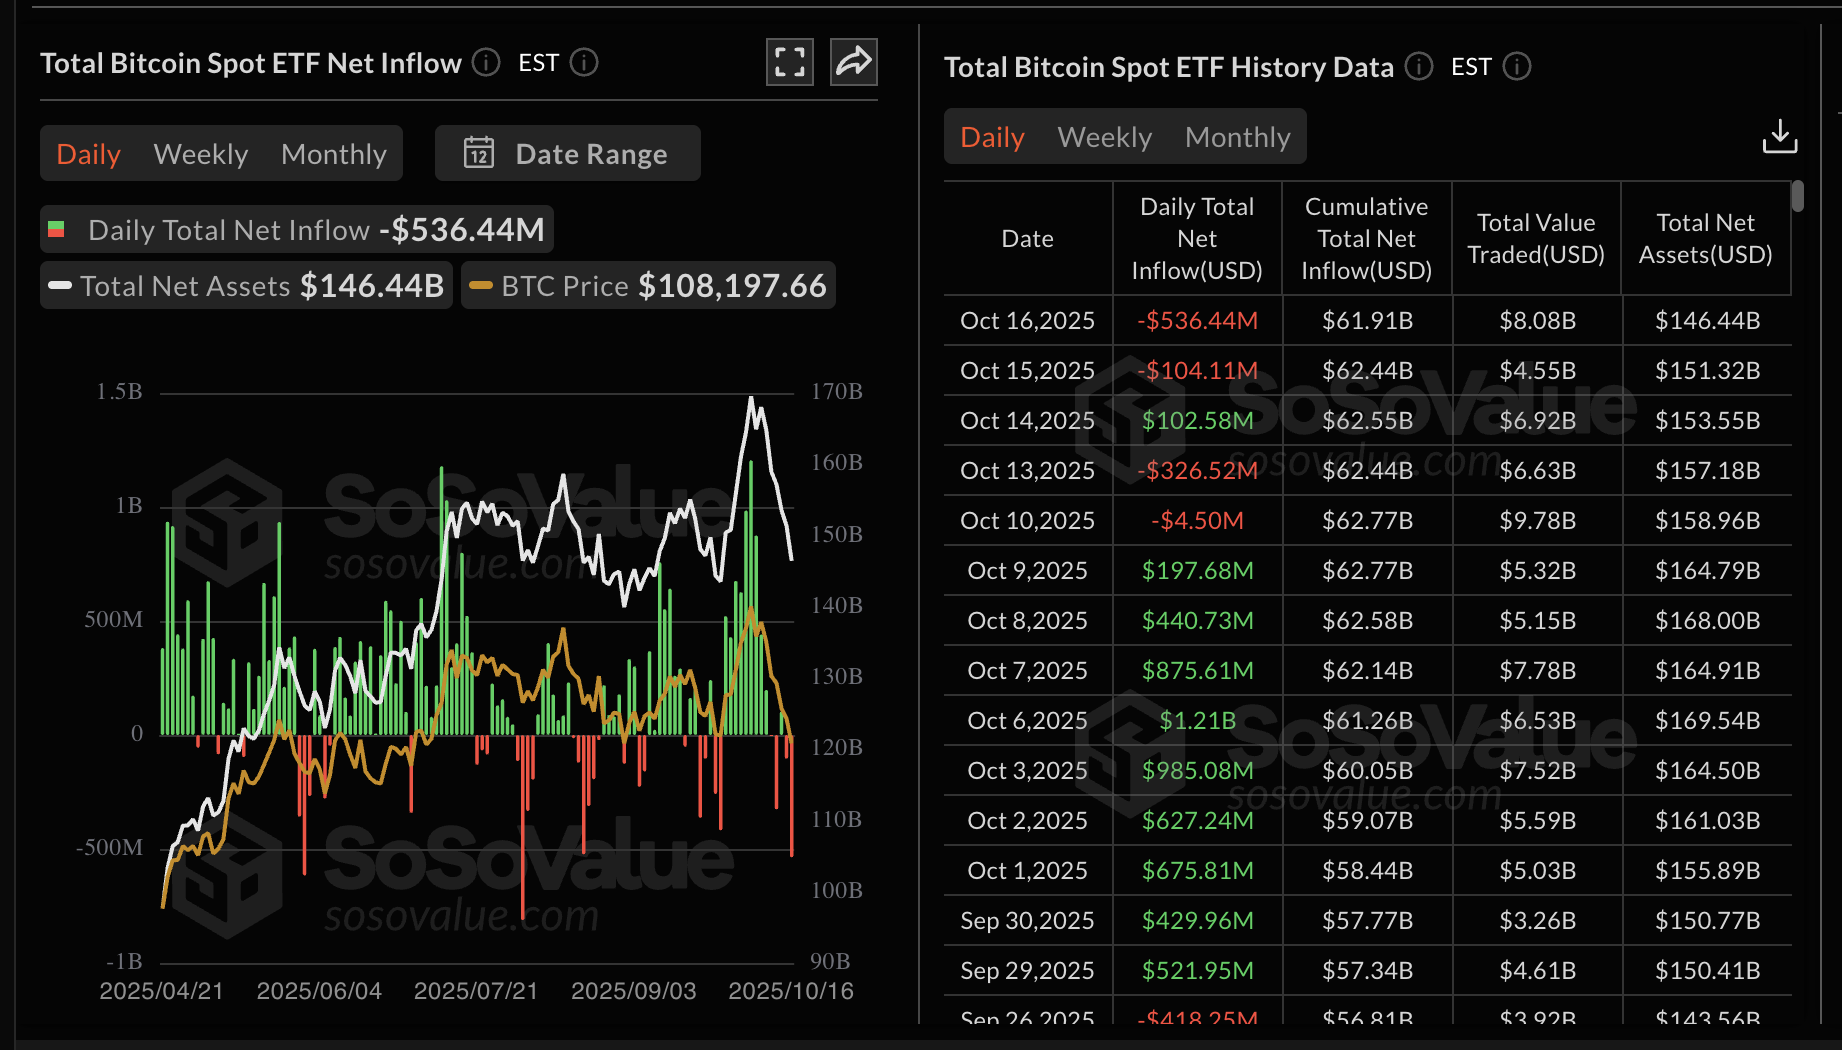
Bitcoin ETF stats | Source: SoSoValue
Ethereum ETFs are also feeling the heat, with outflows on Thursday averaging $57 million, according to SoSoValue data. BlackRock’s ETHA was the only product that experienced inflows, totaling $47 million, while Grayscale’s ETHE posted outflows of $69 million.
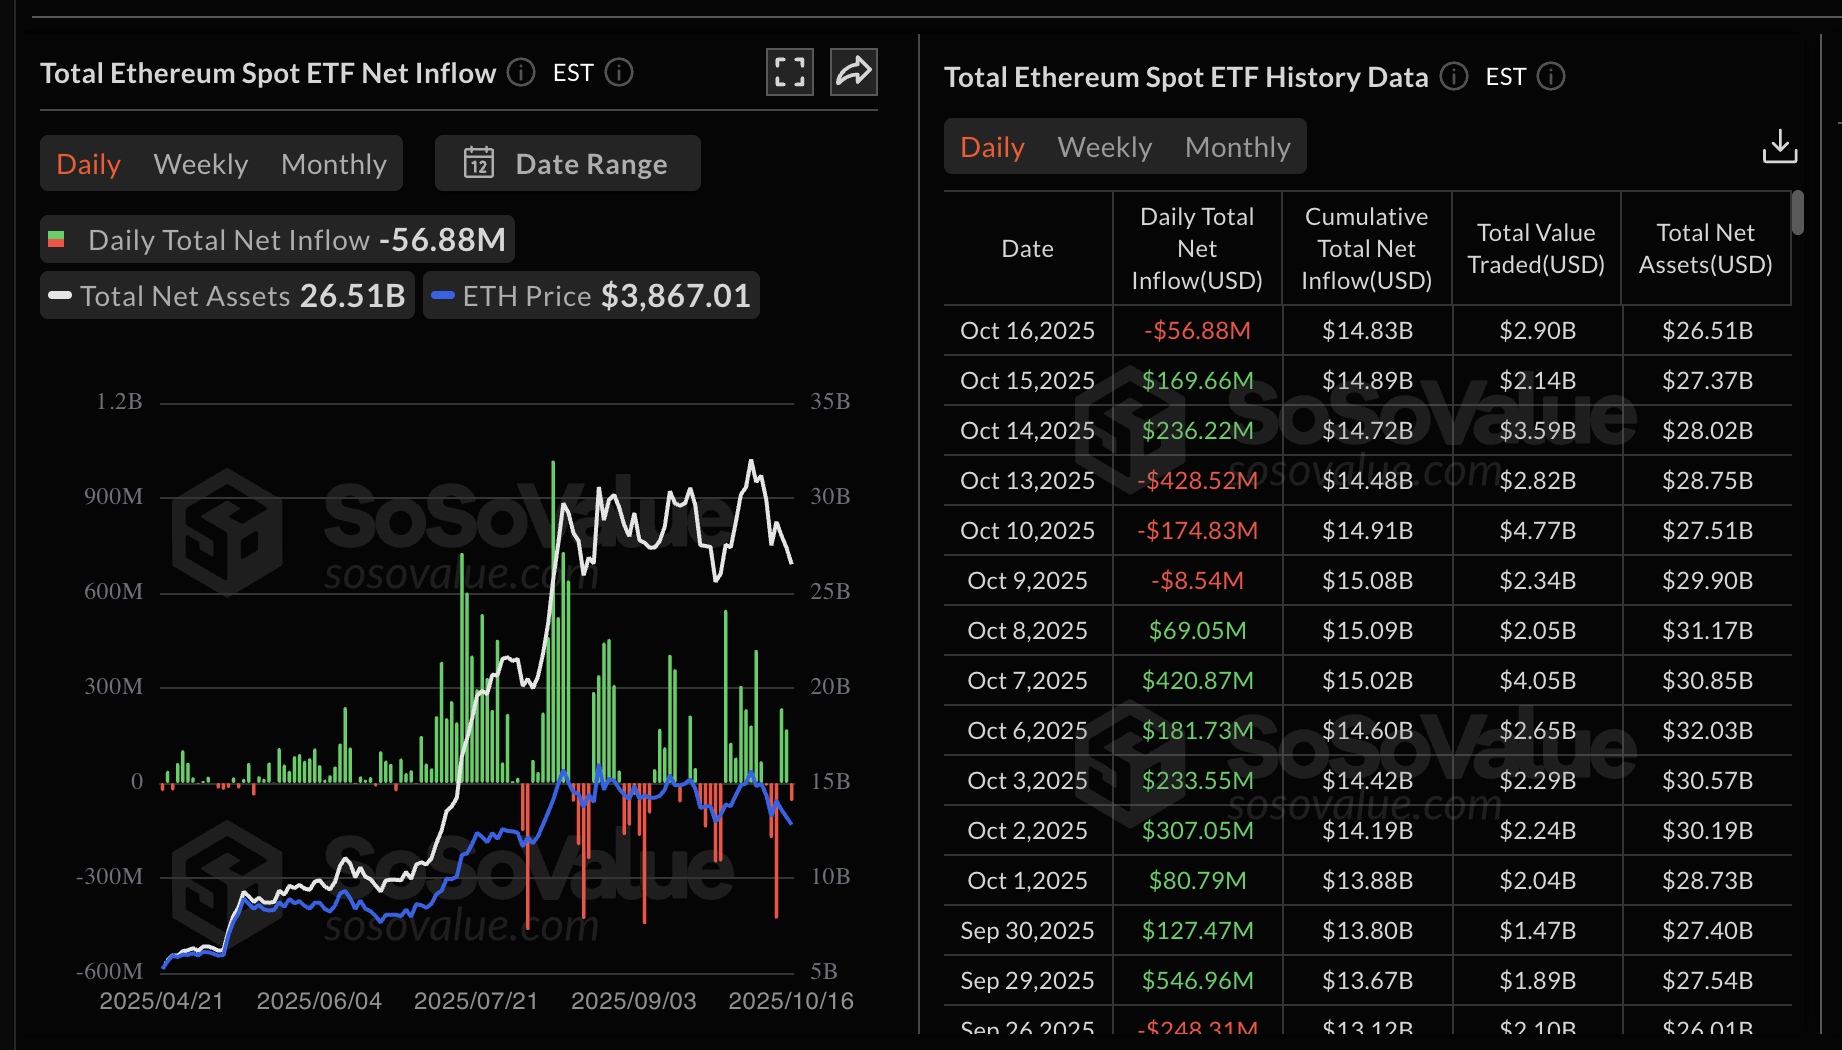
Ethereum ETF stats | Source: SoSoValue
Meanwhile, demand for XRP remains suppressed, as evidenced by a massive drop in the futures Open Interest (OI), which averages $3.81 million on Friday. The OI is a measure of the notional value of outstanding futures contracts. It peaked at $10.94 billion after XRP achieved a new record high of $3.66 in mid-July. The persistent decline in OI suggests that the pool of XRP buyers is shrinking amid increasing bearish pressure.
Chart of the day: Can Bitcoin bulls defend critical support?
Bitcoin is trading at around $105,000 at the time of writing on Friday, as bears strengthen their grip. The decline accelerated after Bitcoin lost the 200-day Exponential Moving Average (EMA), which is currently at $108,029.
A weak technical structure contributes to selling pressure, mirroring the Moving Average Convergence Divergence (MACD) indicator, which has maintained a sell signal in the daily time frame since October 10.
The red histogram bars, expanding below the mean line, point to intense headwinds. More so, the downtrend could accelerate as the Relative Strength Index (RSI) approaches oversold territory.
If the Bitcoin price closes below the $105,000 short-term support, the down leg could stretch to test October lows of $102,000. Still, traders should look out for a reversal above the 200-day EMA resistance at $108,029, which could usher in a bullish move beyond the $110,000 psychological level.
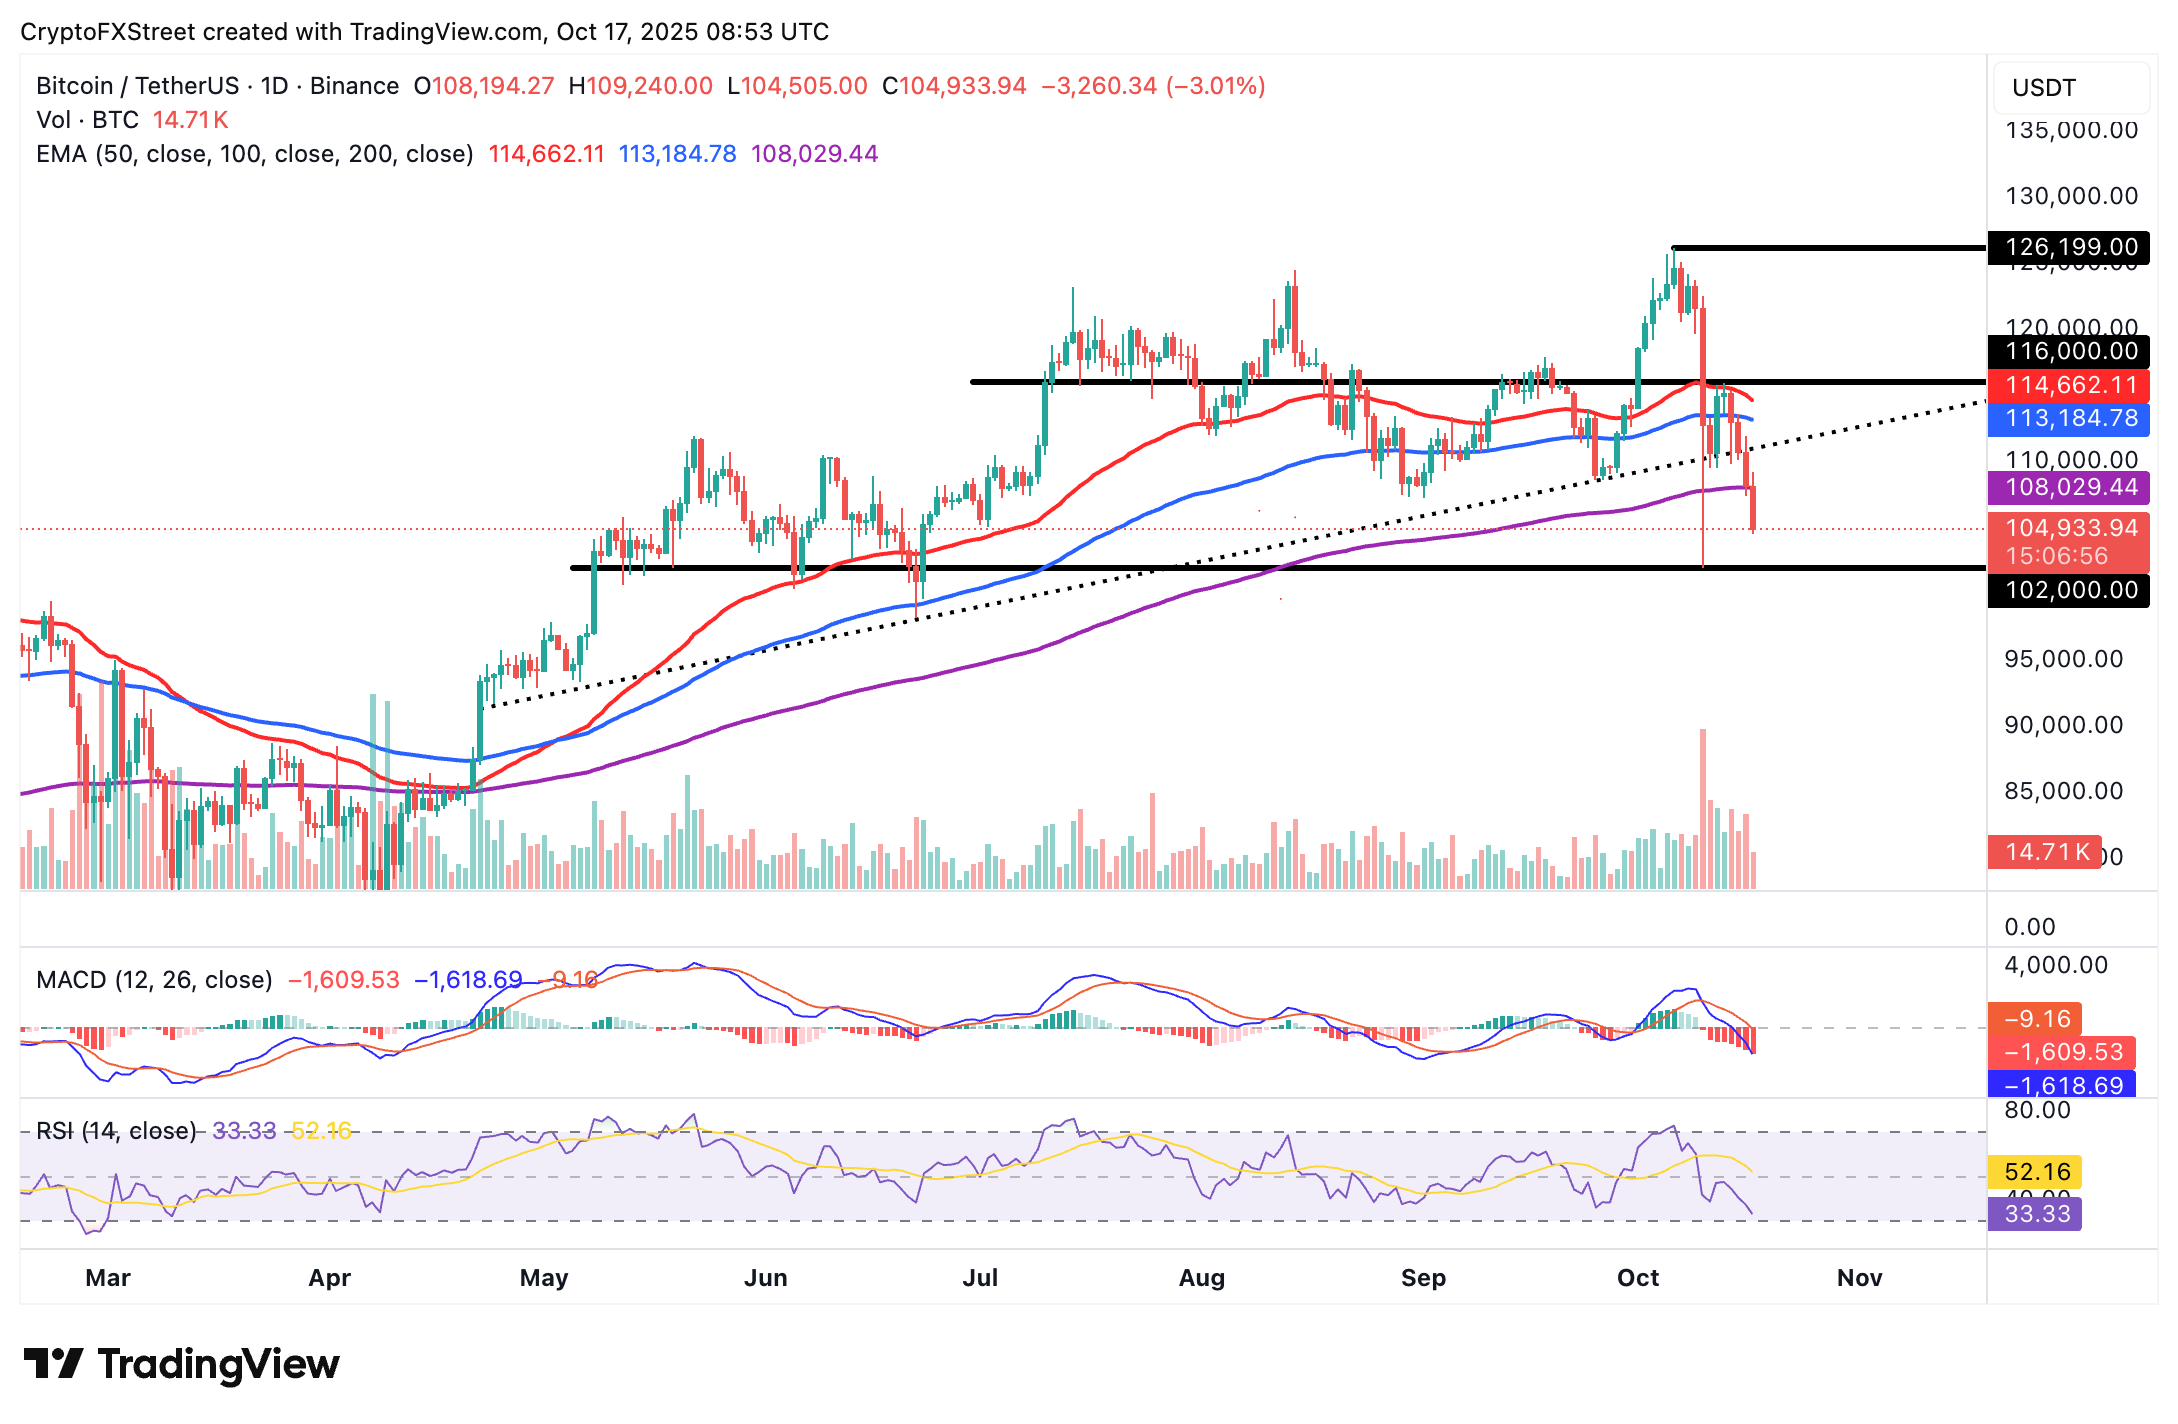
BTC/USDT daily chart
Altcoins update: Ethereum, XRP risk falling off the cliff’s edge
Ethereum is exchanging hands above short-term support at $3,700 following four consecutive days of declines. The daily chart below highlights a weak technical structure, characterized by multiple sell signals, including the MACD indicator. If sentiment remains negative and bulls refrain from buying the dip, a deep correction could occur, pushing the price of Ethereum toward the 200-day EMA at $3,550, which lies above its October lows of $3,430.
Traders will look out for a potential rebound above the 100-day EMA at $3,971 to ascertain ETH’s recovery above the $4,000 level.
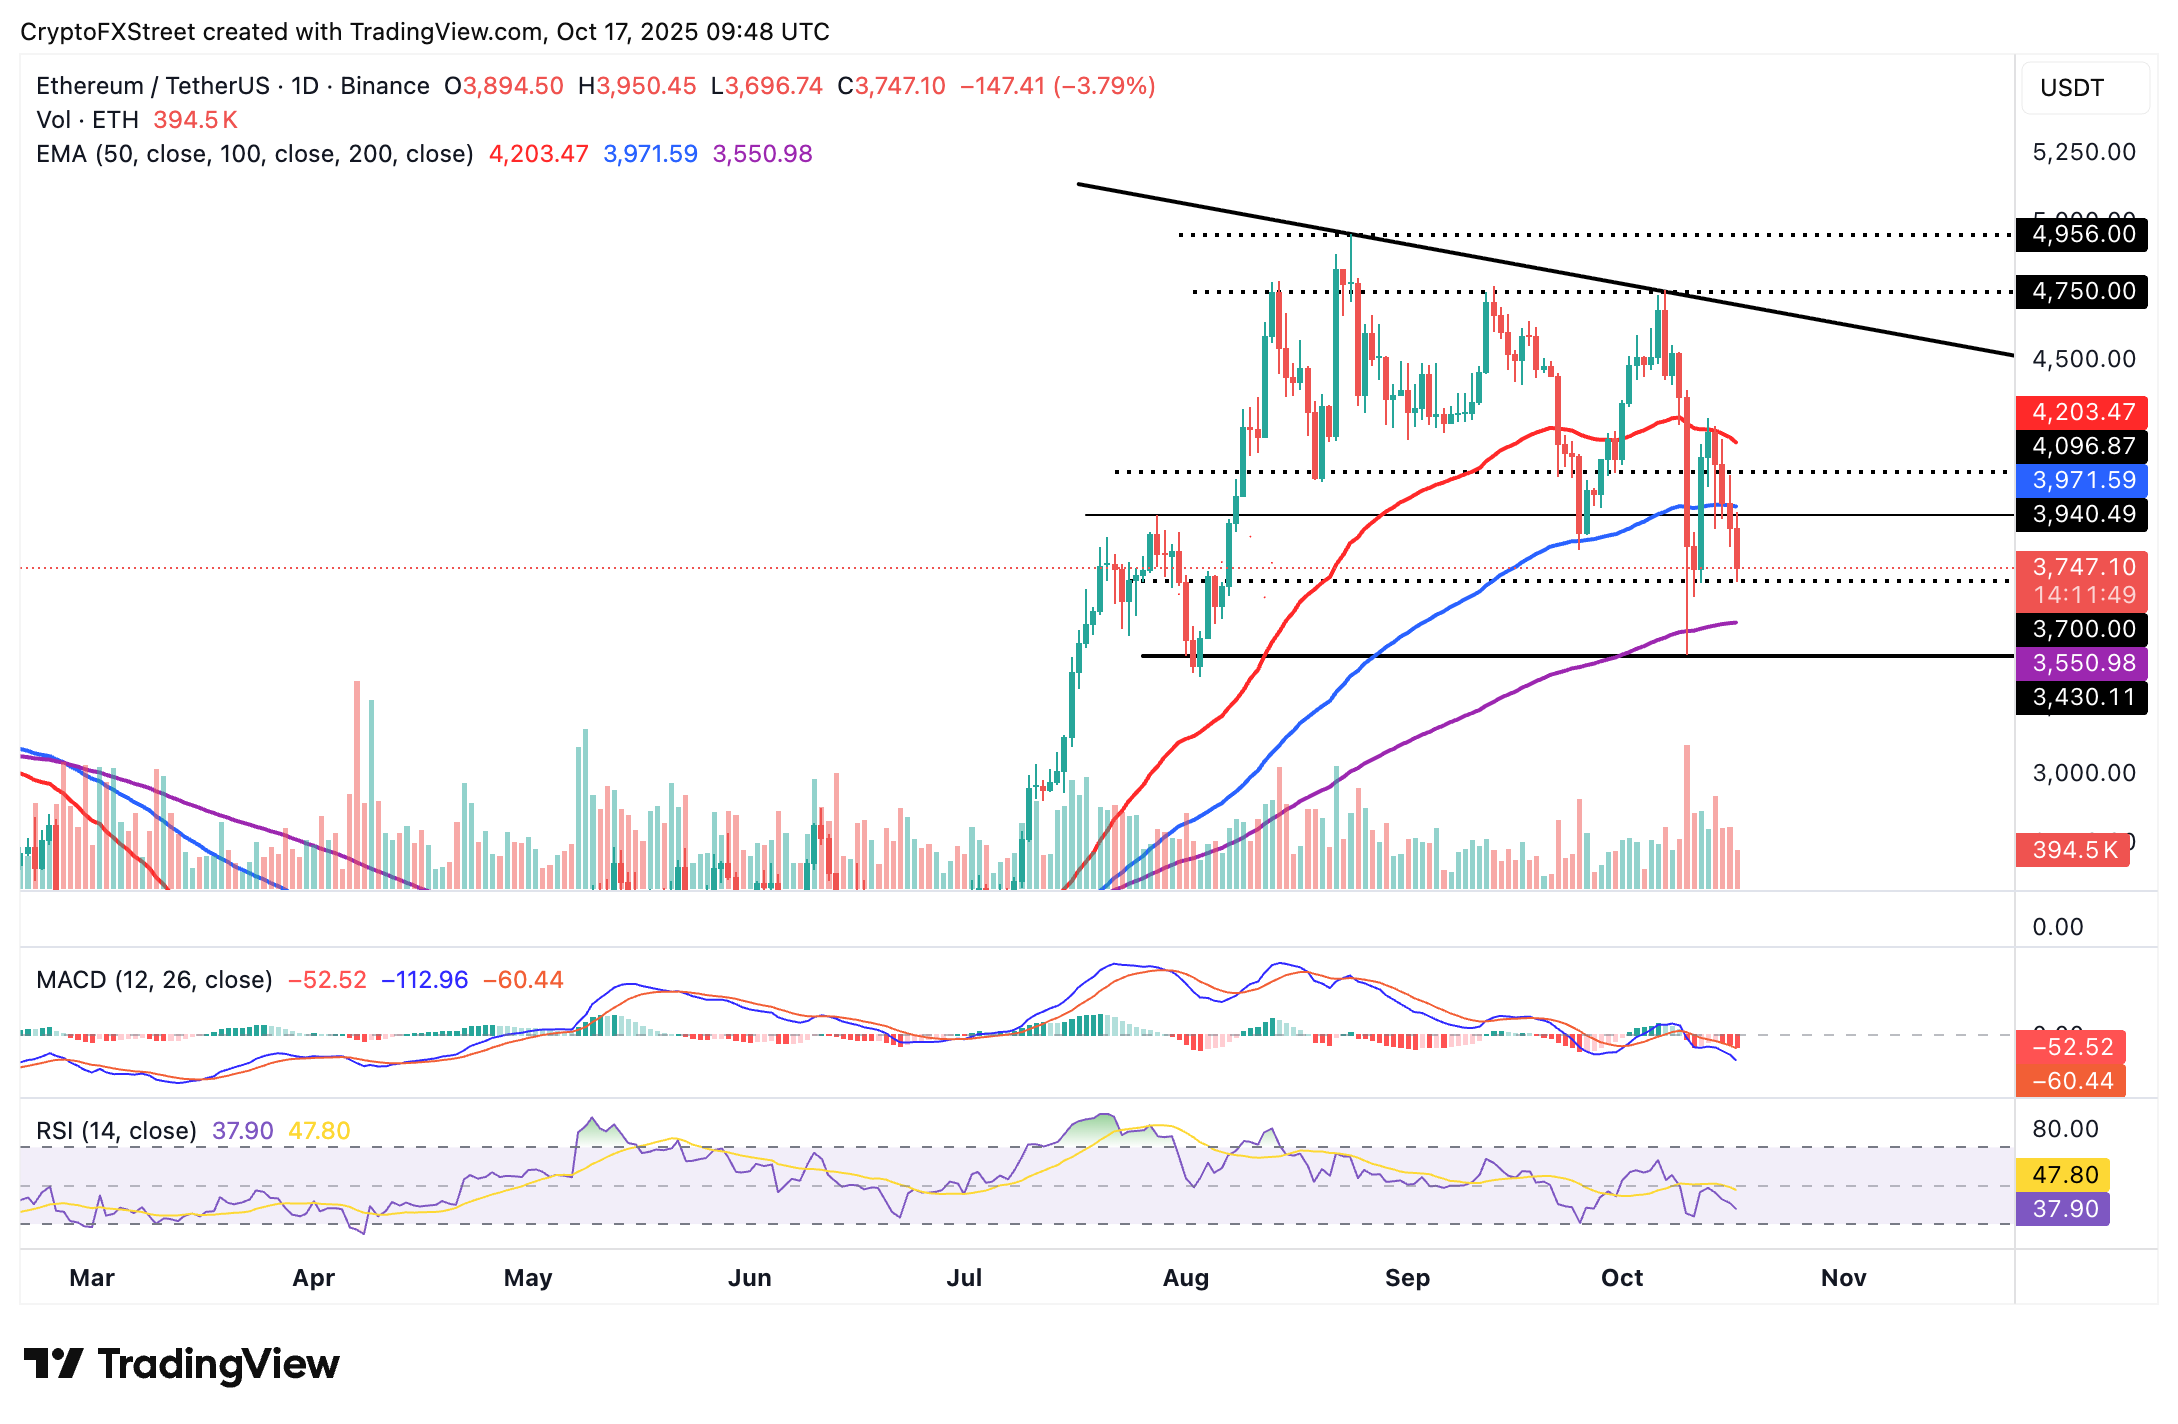
ETH/USDT daily chart
As for XRP, bears are largely in control as bulls struggle to hold support at $2.22 intact. Technical indicators lean bearishly, including a sell signal from the MACD, sustained since Thursday, and a downward-trending RSI currently in the oversold region.
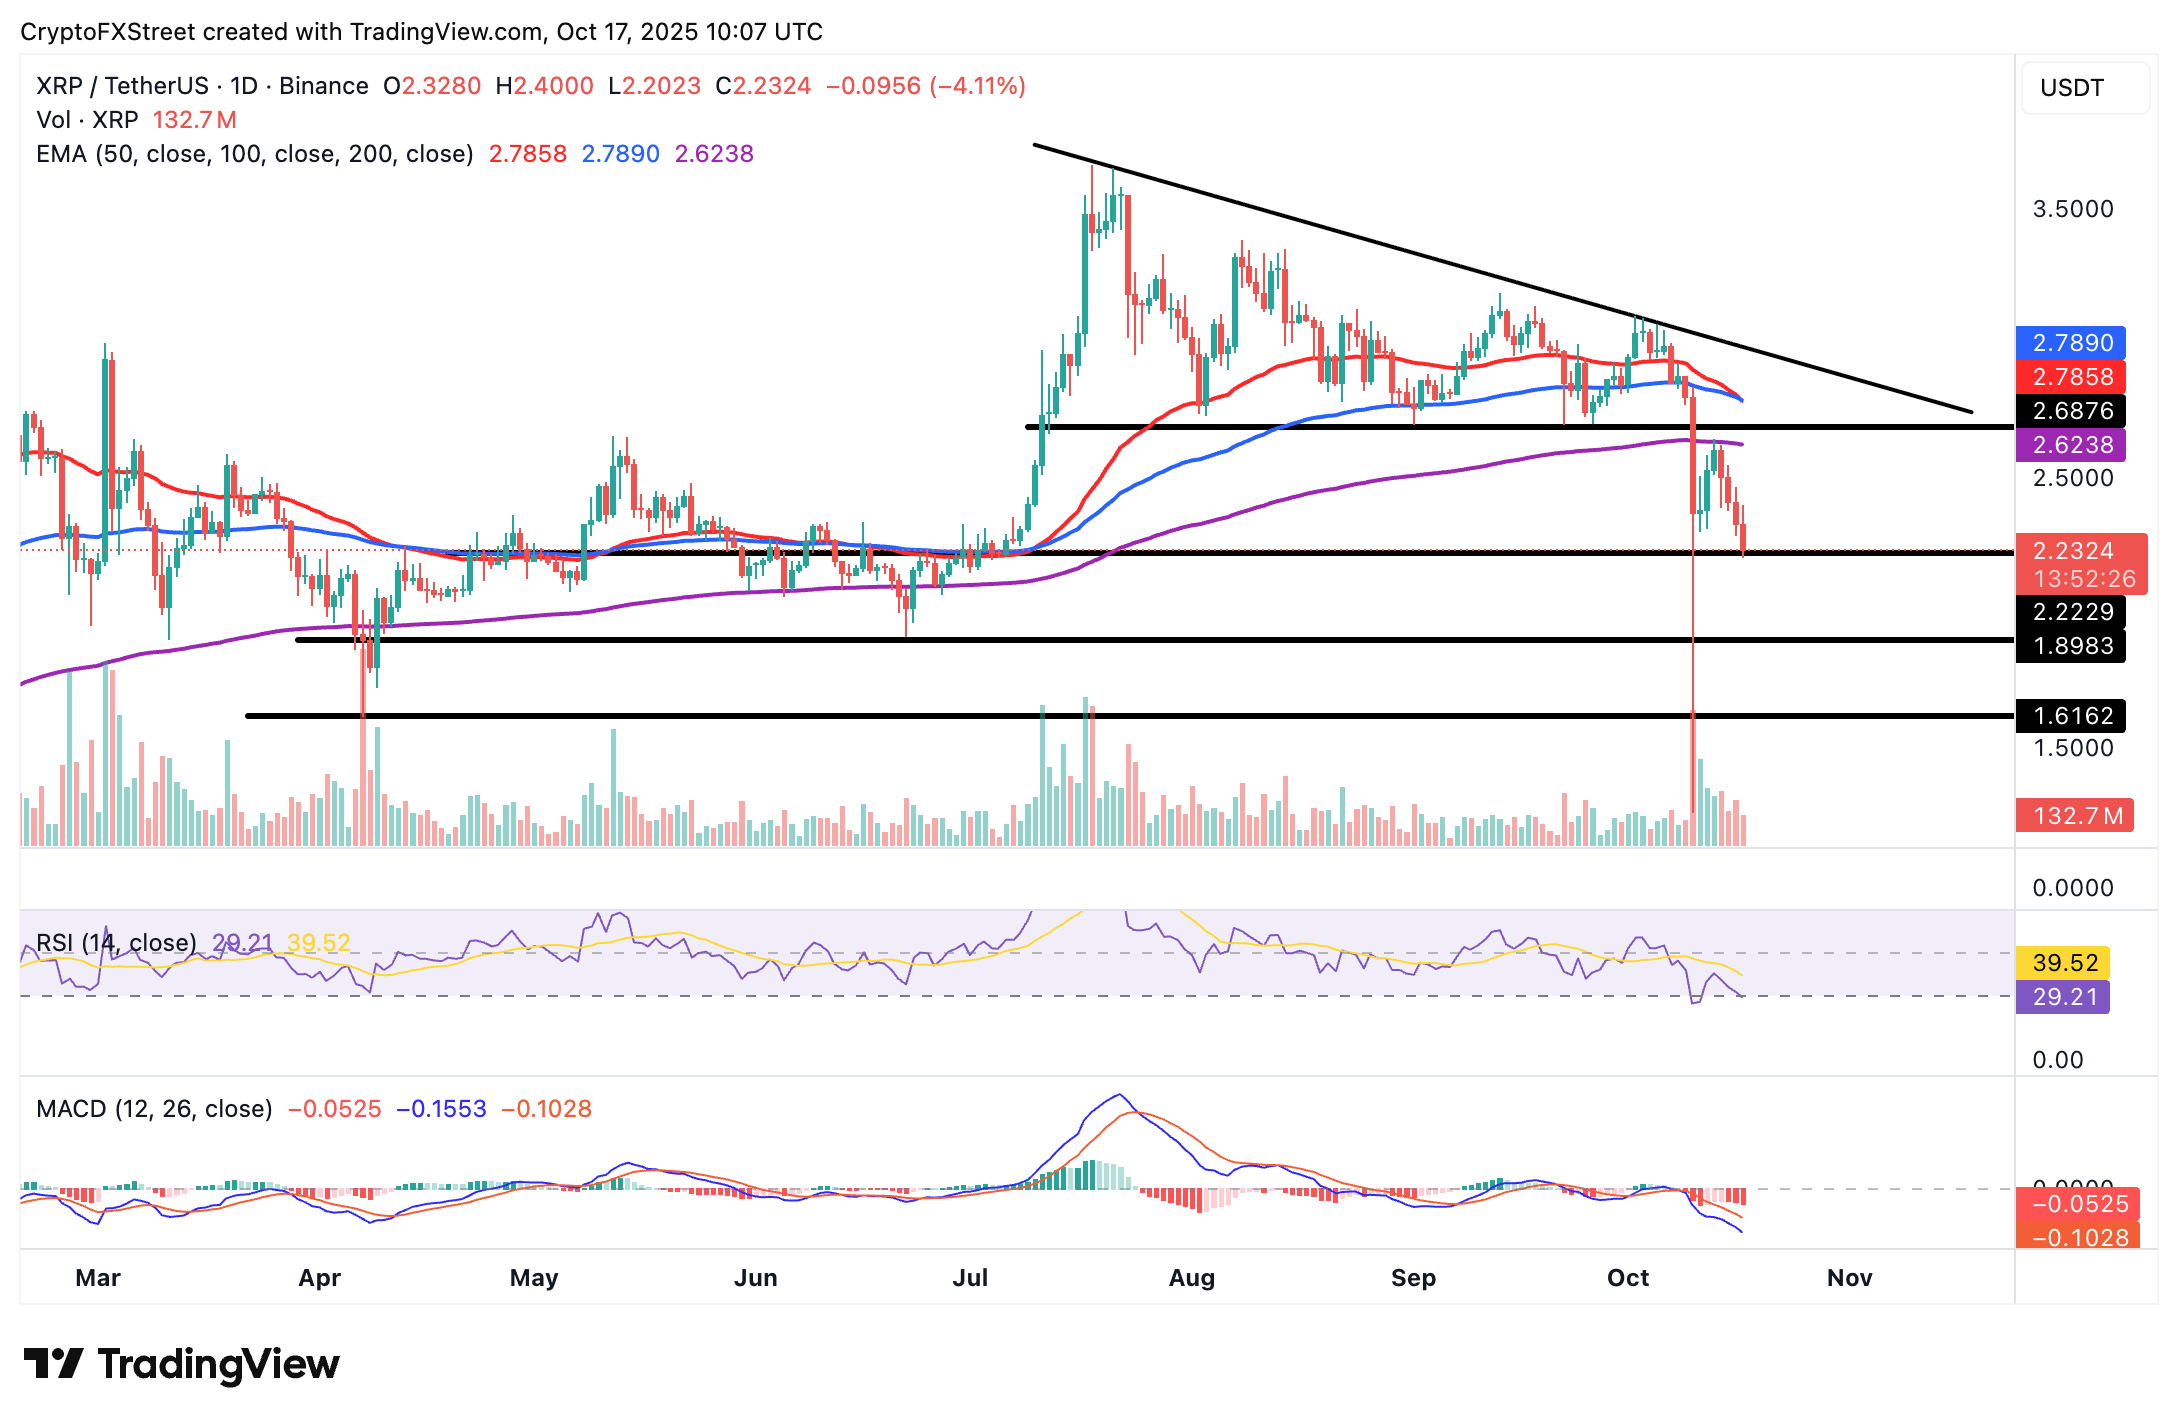
XRP/USDT daily chart
If the 50-day EMA at $2.78 crosses and closes below the 100-day EMA, it will confirm a Death Cross pattern and a persistent bearish outlook. Hence, traders should keep their eyes on the next key levels at $2.20, $1.90 and $1.61, all of which could absorb selling pressure.
Bitcoin, altcoins, stablecoins FAQs
Bitcoin is the largest cryptocurrency by market capitalization, a virtual currency designed to serve as money. This form of payment cannot be controlled by any one person, group, or entity, which eliminates the need for third-party participation during financial transactions.
Altcoins are any cryptocurrency apart from Bitcoin, but some also regard Ethereum as a non-altcoin because it is from these two cryptocurrencies that forking happens. If this is true, then Litecoin is the first altcoin, forked from the Bitcoin protocol and, therefore, an “improved” version of it.
Stablecoins are cryptocurrencies designed to have a stable price, with their value backed by a reserve of the asset it represents. To achieve this, the value of any one stablecoin is pegged to a commodity or financial instrument, such as the US Dollar (USD), with its supply regulated by an algorithm or demand. The main goal of stablecoins is to provide an on/off-ramp for investors willing to trade and invest in cryptocurrencies. Stablecoins also allow investors to store value since cryptocurrencies, in general, are subject to volatility.
Bitcoin dominance is the ratio of Bitcoin's market capitalization to the total market capitalization of all cryptocurrencies combined. It provides a clear picture of Bitcoin’s interest among investors. A high BTC dominance typically happens before and during a bull run, in which investors resort to investing in relatively stable and high market capitalization cryptocurrency like Bitcoin. A drop in BTC dominance usually means that investors are moving their capital and/or profits to altcoins in a quest for higher returns, which usually triggers an explosion of altcoin rallies.
추천 기사


