
Crypto Today: Bitcoin, Ethereum, XRP retreat amid profit-taking, risk-off sentiment
- Bitcoin pulls back on Thursday, erasing gains accrued the previous day, despite steady ETF inflows.
- Ethereum extends intraday correction, nearing the 50-day EMA support.
- XRP declines as a downward-trending RSI points to rising bearish momentum.
Bitcoin (BTC) is facing headwinds, correcting lower to nearly the $121,000 mark on Thursday, as prices in the broader cryptocurrency market generally retreat. Ethereum (ETH) and Ripple (XRP) are also in the red, trimming gains accrued during the previous day’s knee-jerk recovery.
Alternative.me Crypto Fear & Greed Index rises to 70, indicating a sentiment of greed in the cryptocurrency market, following Bitcoin’s surge to a new record high of $126,199. Monday.
Greed suggests that investors are euphoric amid the Fear Of Missing Out (FOMO). Still, there is the risk of increased profit-taking, as investors are quick to react to red numbers.
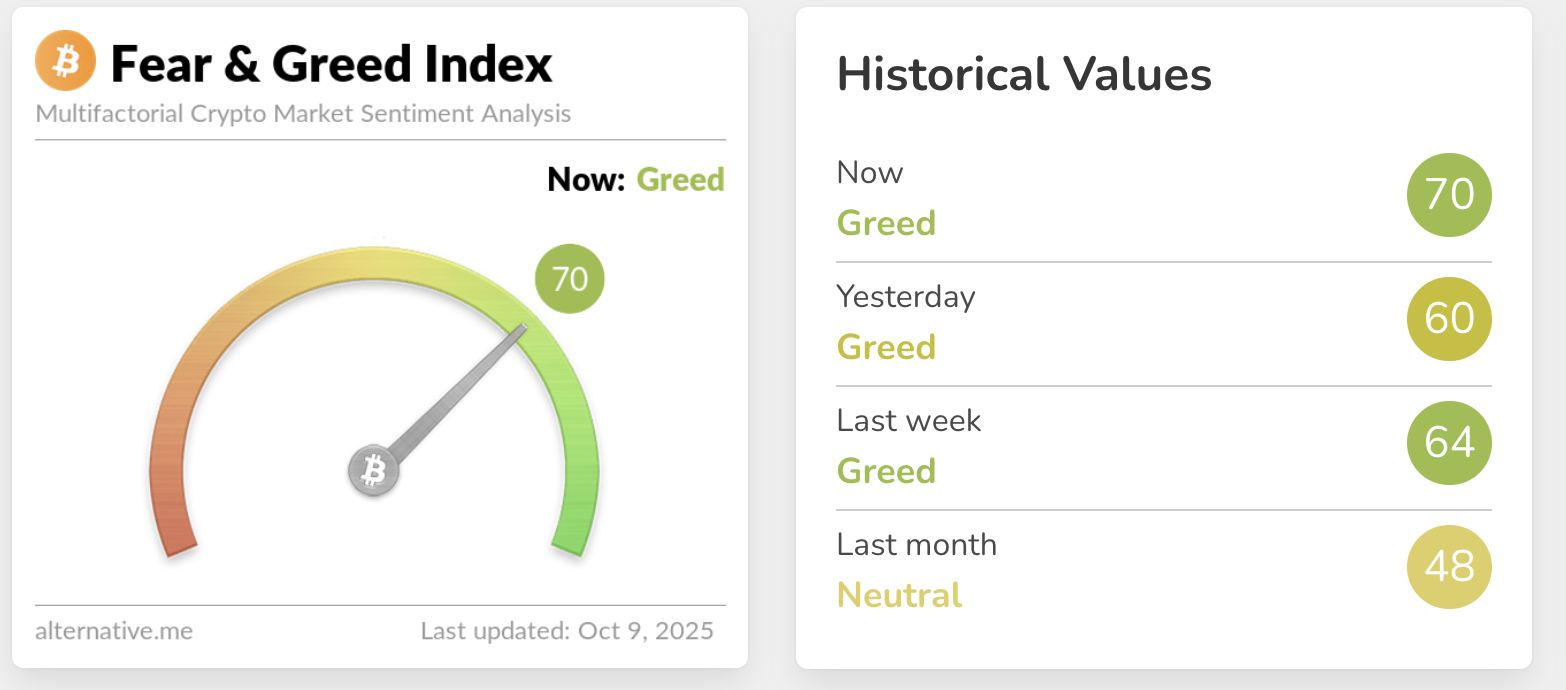
Fear & Greed Index | Source: Alternative.me
Data spotlight: Bitcoin’s uptrend wobbles despite ETF inflows
Bitcoin spot Exchange Traded Funds (ETFs) marked eight consecutive days of inflows on Wednesday, with $441 million, reflecting steady demand from institutional investors.
The cumulative total net inflow is near $63 billion, with net assets totaling $168 billion. ETFs have been a significant driver of Bitcoin’s rally, often signaling growing investor interest. If inflows continue trickling in, the odds of a rebound toward the all-time high will increase significantly.
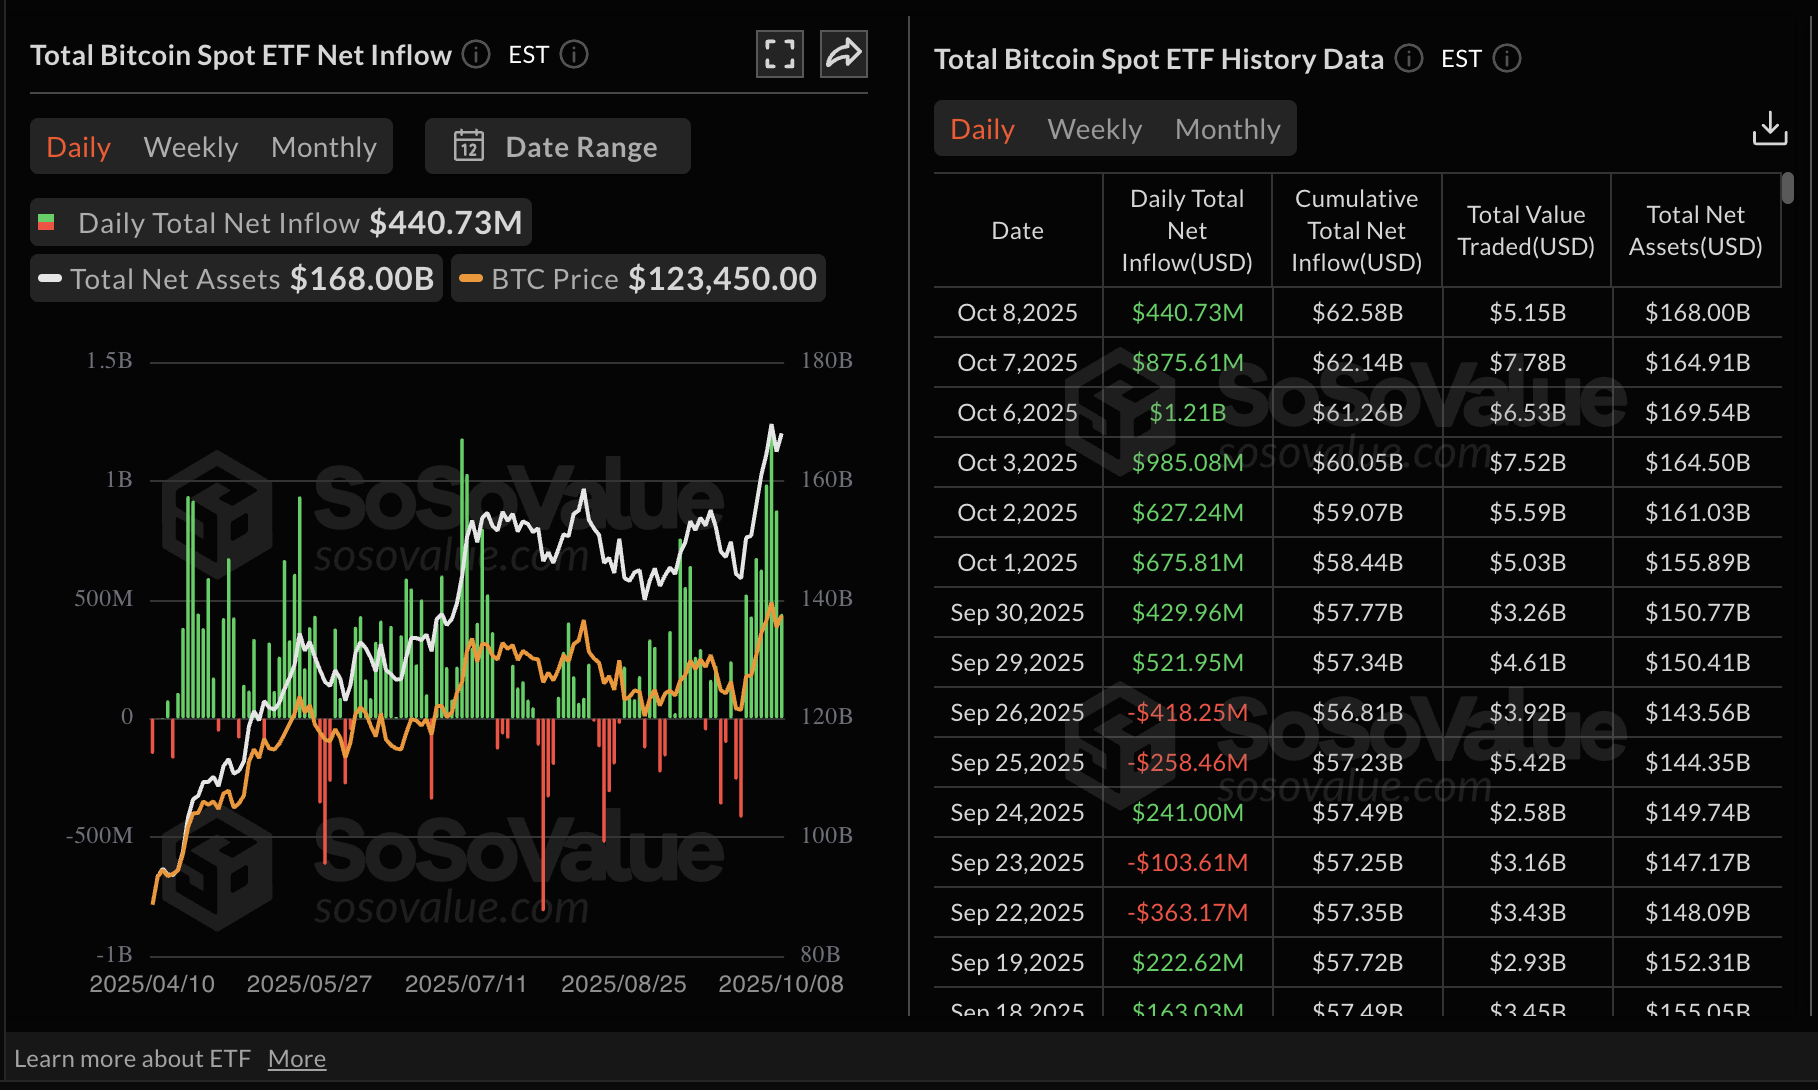
Bitcoin ETF stats | Source: SoSoValue
Institutional interest in Ethereum remains relatively stable, with the nine ETFs in the United States (US) experiencing $69 million in inflows on Wednesday compared to $421 million on Tuesday. Meanwhile, the cumulative total net inflow stands at approximately $15.1 billion with net assets at $31.17 billion, according to SoSoValue data.
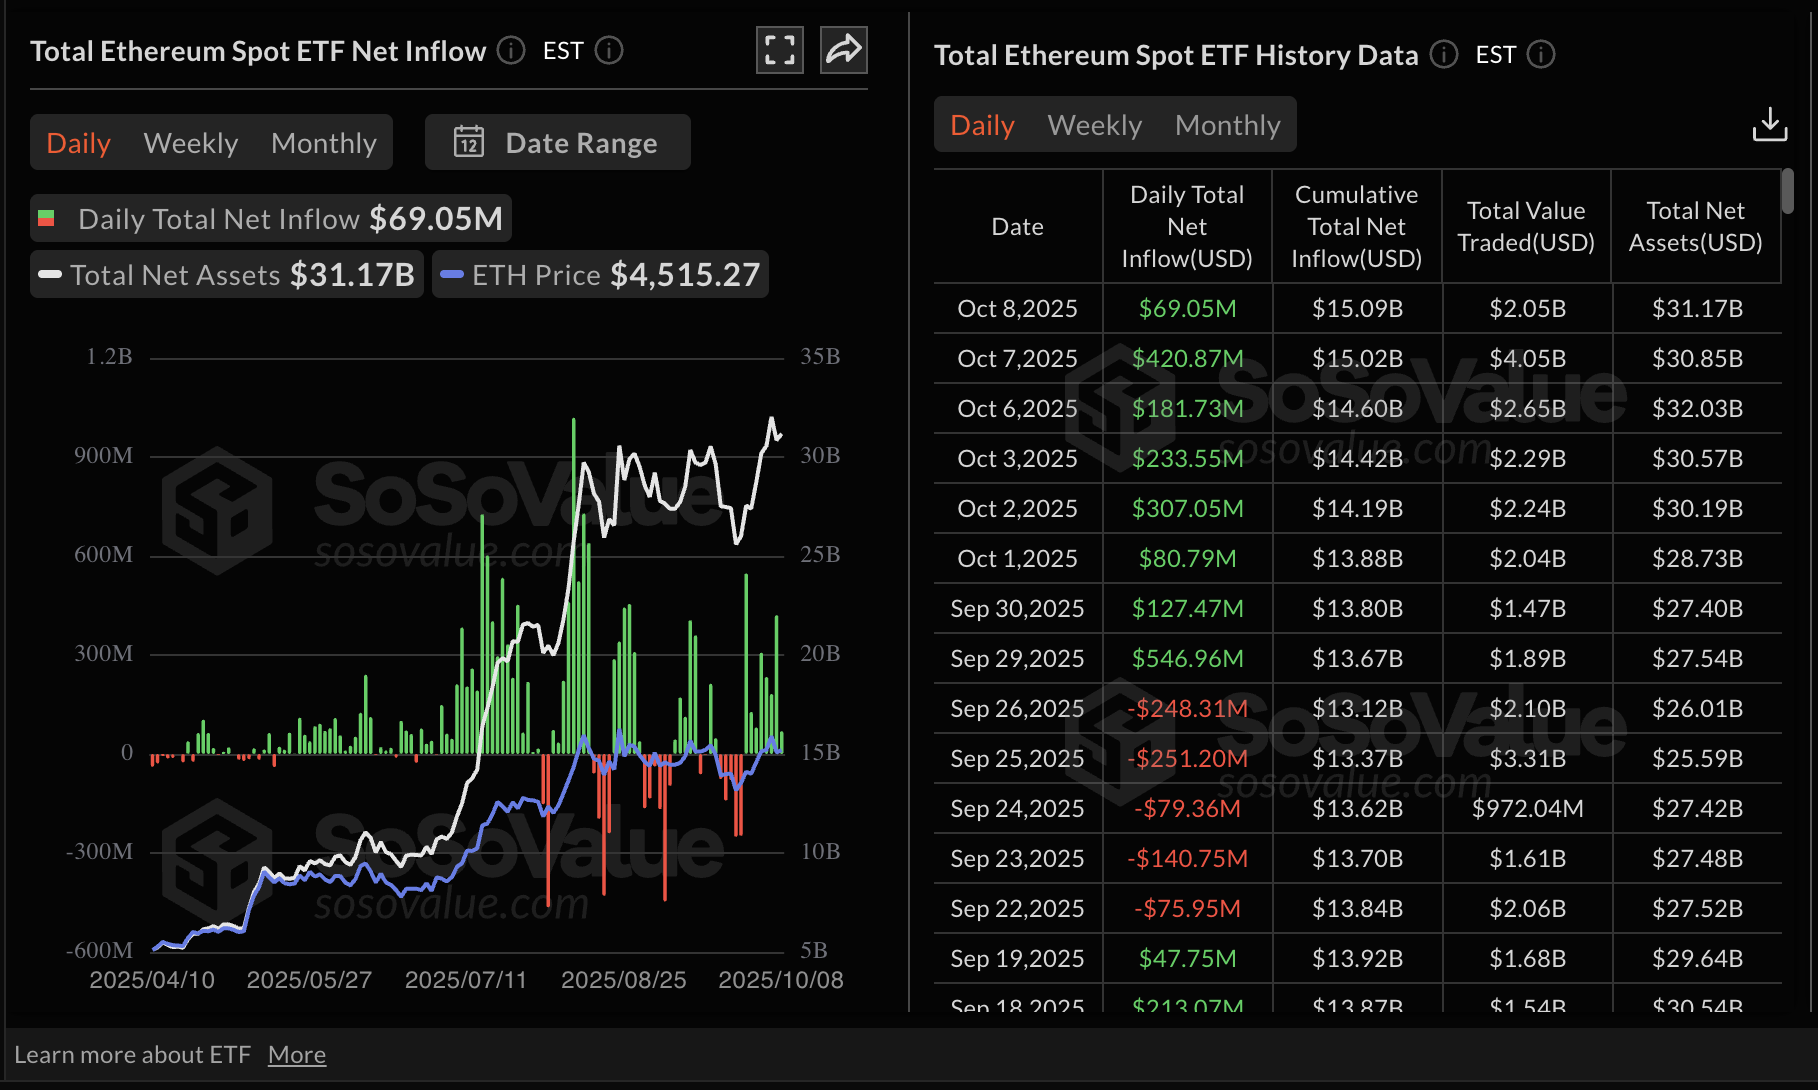
Ethereum ETF stats | Source: SoSoValue
Chart of the day: Bitcoin holds key support
Bitcoin declines on Thursday, testing a short-term support level near $121,000 in a wider cryptocurrency market correction amid profit-taking and risk-off sentiment.
The Relative Strength Index (RSI), currently falling to 60 on the daily chart, indicates that bullish momentum is easing. Lower RSI readings indicate that bears are gaining control, thereby increasing the likelihood of a further decline.
The round-number level of $120,000 serves as psychological support. If defended, Bitcoin could resume its uptrend to the record high and later enter a price discovery phase, marking a risk-on sentiment that is often anticipated in the fourth quarter.
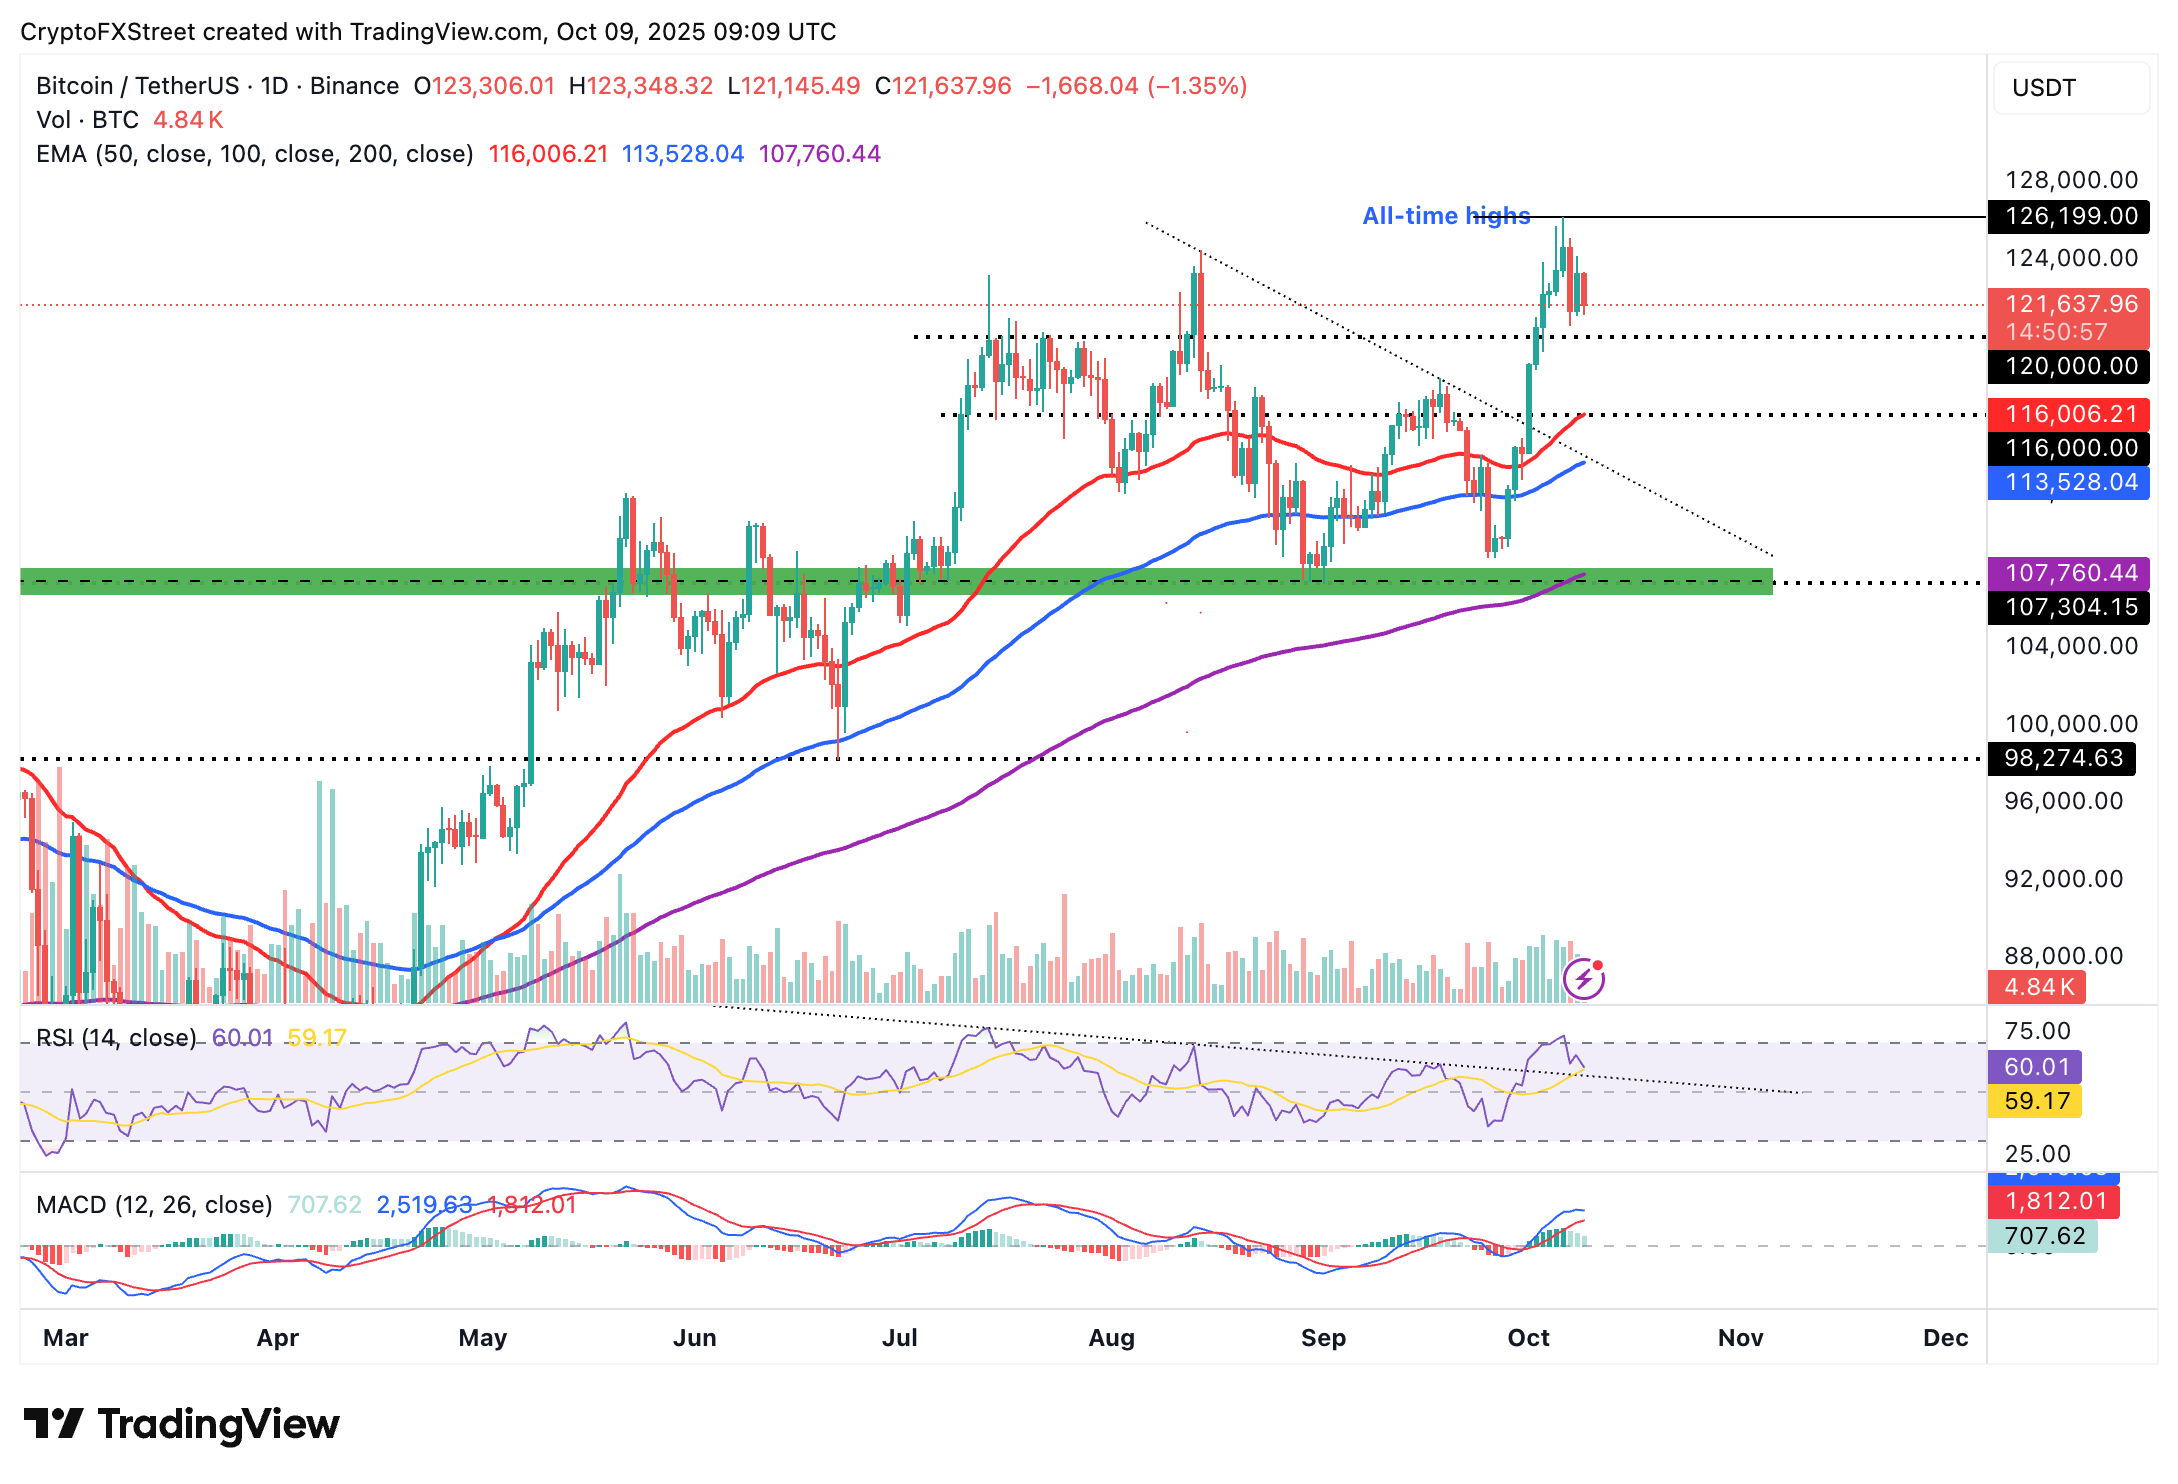
BTC/USDT daily chart
Still, if the $120,000 support is broken, profit-taking and overall risk-off sentiment could trigger an extended correction toward the 50-day Exponential Moving Average (EMA) at $116,006. Other key levels for traders to consider include the 100-day EMA at $113,528 and the 200-day EMA at $107,760, both of which could serve as tentative support areas.
Altcoins update: Ethereum, XRP test critical support
Ethereum bulls are eyeing a potential rebound as the smart contracts token approaches the 50-day EMA support provided at $4,292. A downward-trending RSI at 48 reinforces the short-term bearish grip.
An extended decline of the RSI below 50 would indicate strong bearish momentum, increasing the risk of a decline toward the pivotal $4,000 level.
The Moving Average Convergence Divergence (MACD) indicator on the daily chart sustains a buy signal triggered on October 2. However, a downward trend in the blue MACD line toward the red signal line hints at a potential sell signal. Therefore, traders should be cautiously optimistic, as a sell signal encourages investors to reduce risk exposure, which could contribute to selling pressure.
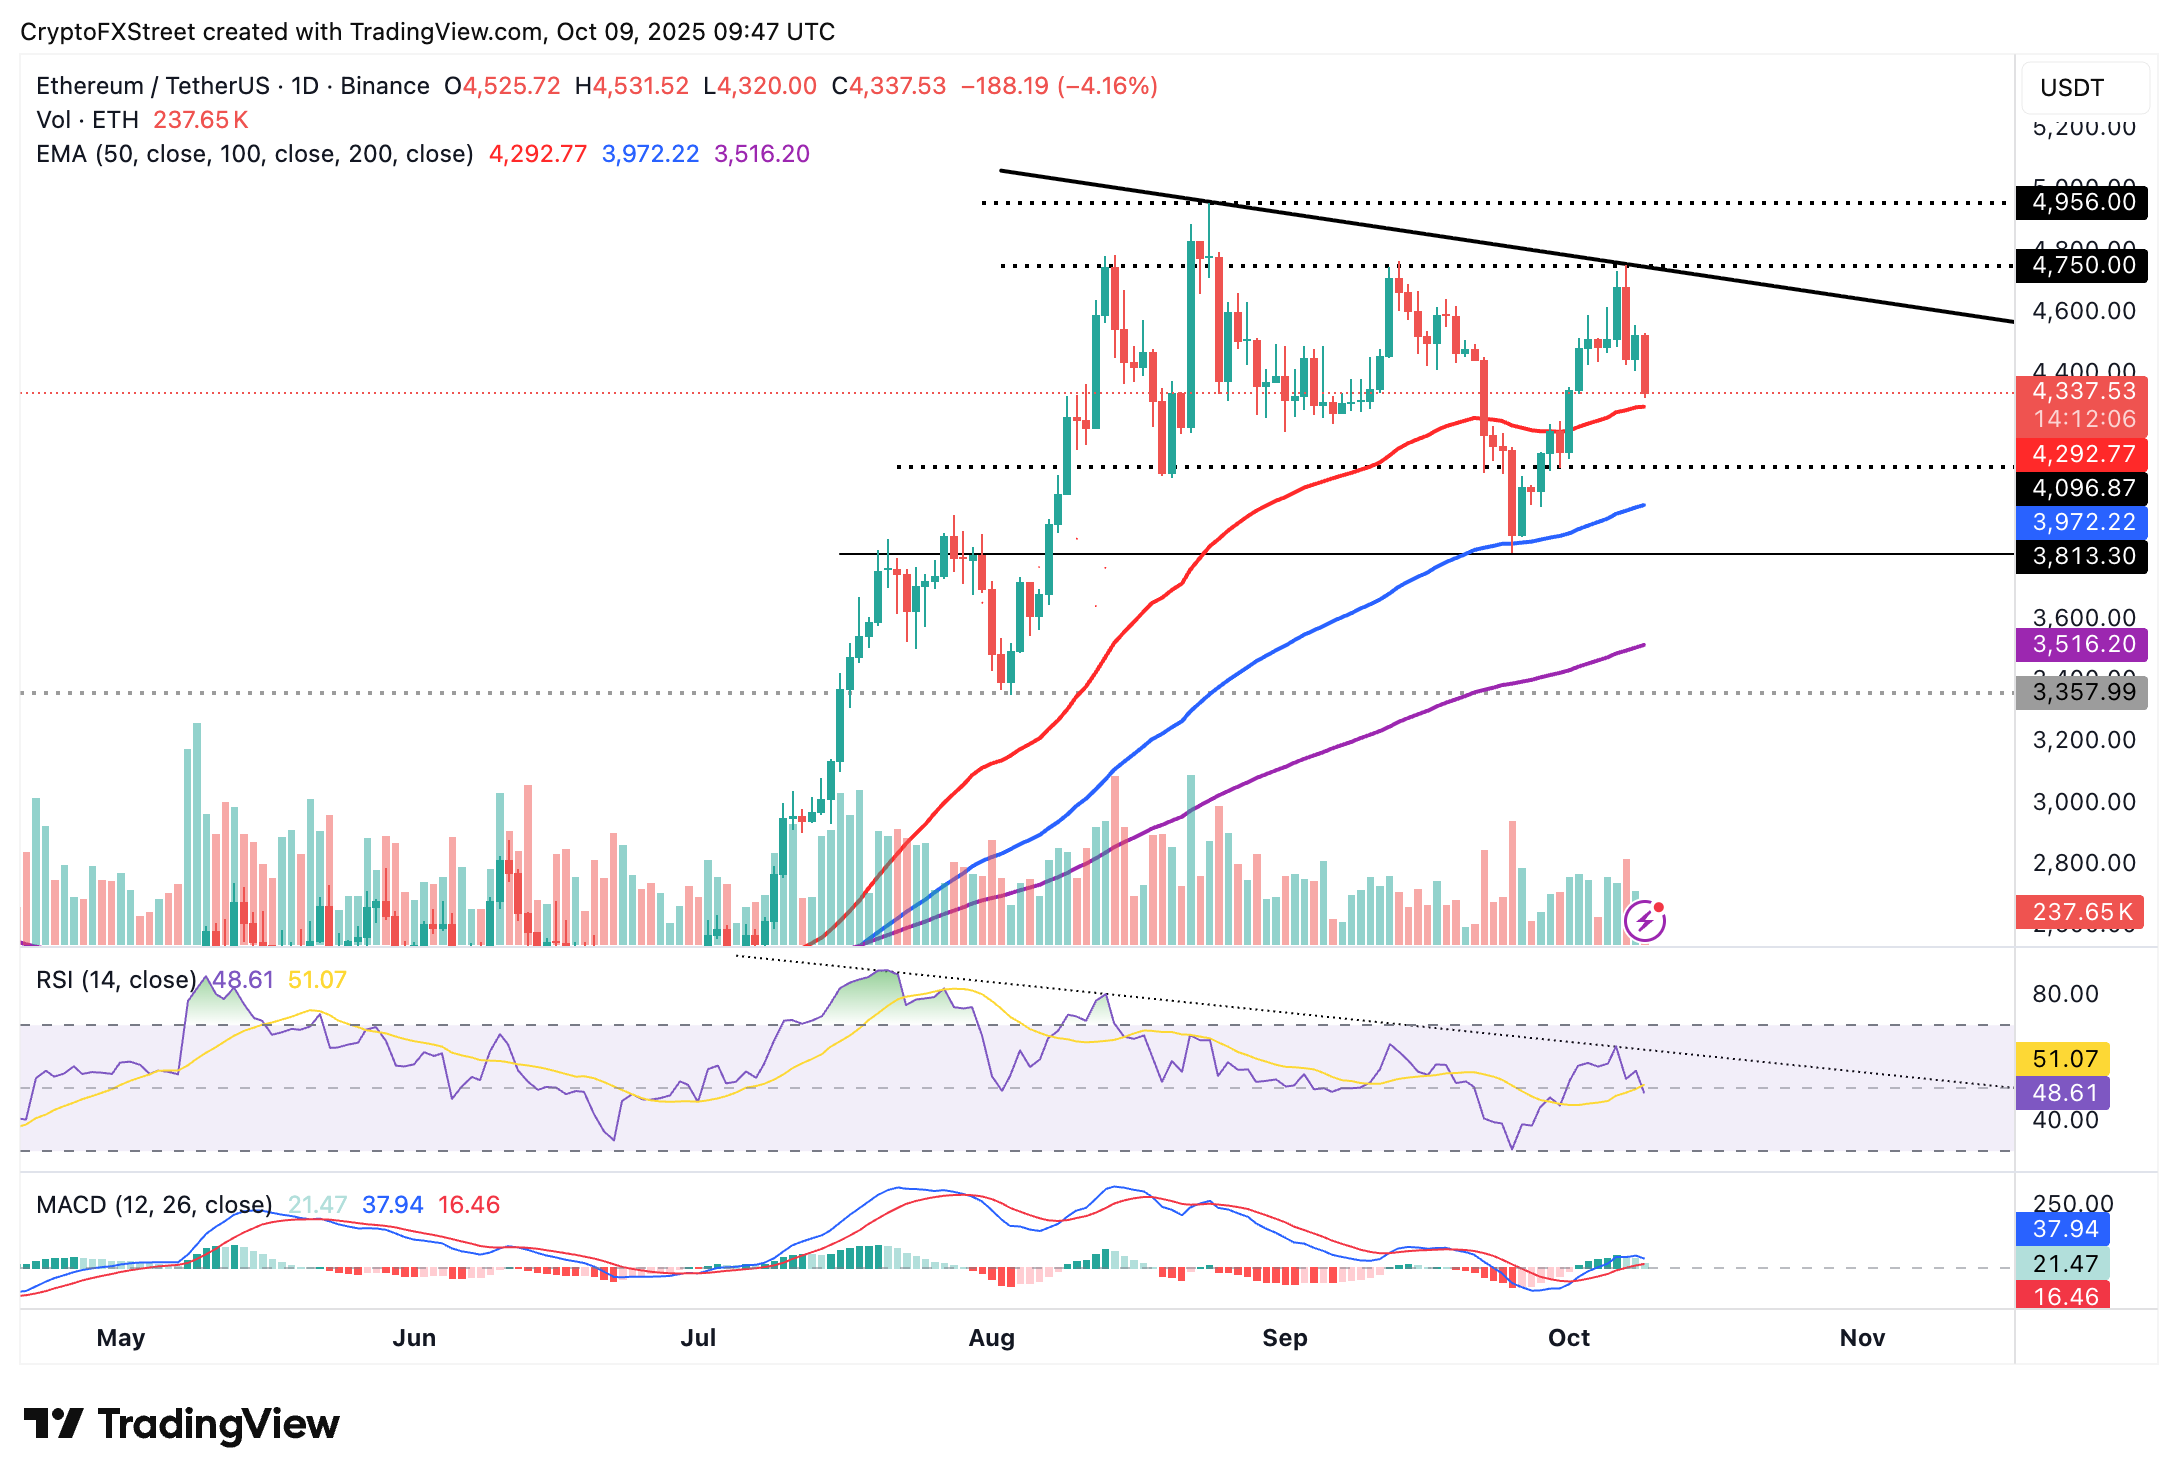
ETH/USDT daily chart
As for XRP, bears appear to be having the upper hand, underpinned by the RSI retreating to 42 on the daily chart from 57 earlier this month. The cross-border money remittance token falls below the 100-day EMA, currently at $2.85, indicating bearish sentiment.
A sell signal triggered by the MACD indicator earlier in the day suggests that investors may be inclined to reduce their risk exposure.
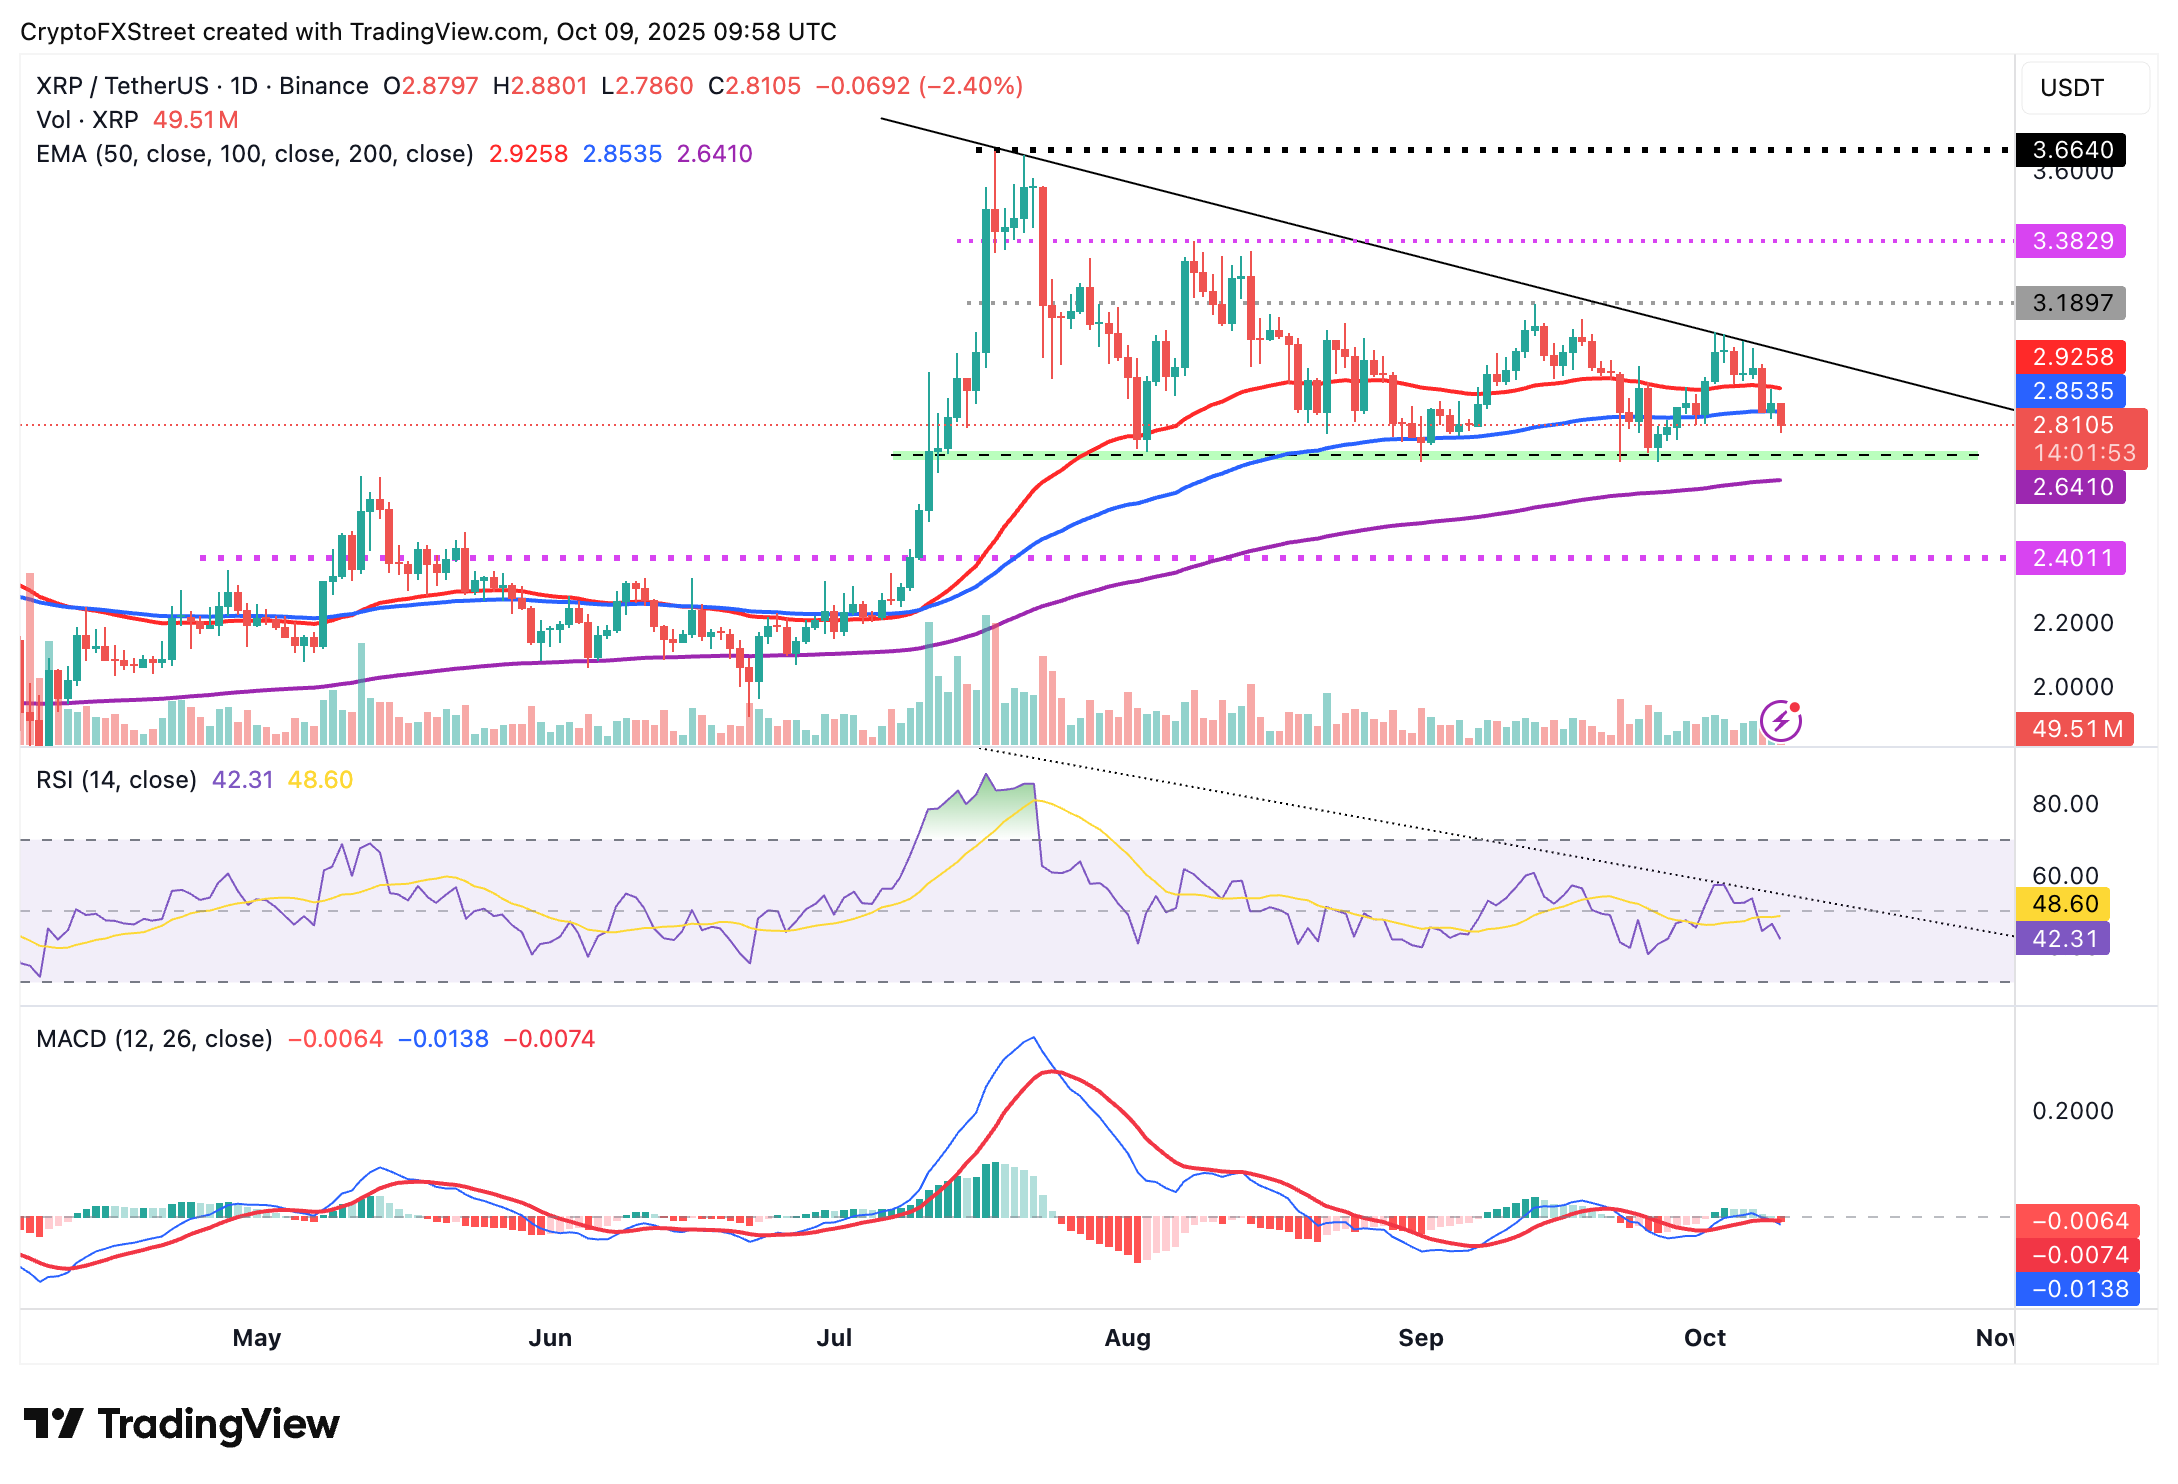
XRP/USDT daily chart
The next tentative support levels include the demand zone marked in green at $2.70 on the same daily chart and the 200-day EMA at $2.64.
Bitcoin, altcoins, stablecoins FAQs
Bitcoin is the largest cryptocurrency by market capitalization, a virtual currency designed to serve as money. This form of payment cannot be controlled by any one person, group, or entity, which eliminates the need for third-party participation during financial transactions.
Altcoins are any cryptocurrency apart from Bitcoin, but some also regard Ethereum as a non-altcoin because it is from these two cryptocurrencies that forking happens. If this is true, then Litecoin is the first altcoin, forked from the Bitcoin protocol and, therefore, an “improved” version of it.
Stablecoins are cryptocurrencies designed to have a stable price, with their value backed by a reserve of the asset it represents. To achieve this, the value of any one stablecoin is pegged to a commodity or financial instrument, such as the US Dollar (USD), with its supply regulated by an algorithm or demand. The main goal of stablecoins is to provide an on/off-ramp for investors willing to trade and invest in cryptocurrencies. Stablecoins also allow investors to store value since cryptocurrencies, in general, are subject to volatility.
Bitcoin dominance is the ratio of Bitcoin's market capitalization to the total market capitalization of all cryptocurrencies combined. It provides a clear picture of Bitcoin’s interest among investors. A high BTC dominance typically happens before and during a bull run, in which investors resort to investing in relatively stable and high market capitalization cryptocurrency like Bitcoin. A drop in BTC dominance usually means that investors are moving their capital and/or profits to altcoins in a quest for higher returns, which usually triggers an explosion of altcoin rallies.
추천 기사


