
Bitcoin Price Forecast: BTC steadies above $116,000 ahead of Fed decision as traders eye breakout
- Bitcoin price trades above $116,000 resistance, increasing chances of a fresh bullish leg toward $120,000.
- The Fed’s rate cut decision could spark fresh volatility for BTC.
- On-chain data show diverging signals, indicating uneven trader sentiment despite the prevailing bullish momentum.
Bitcoin (BTC) steadies above $116,000 at the time of writing on Wednesday, with traders bracing for heightened volatility following the Federal Reserve’s (Fed) rate cut decision later today. While a breakout toward $120,000 remains in play, on-chain data suggests uneven sentiment across the cryptocurrency market, increasing the risk of a sell-the-news reaction.
Bitcoin could face volatility following the Fed rate decision
Bitcoin price edges slightly down, trading above $116,000 during the European session on Wednesday. BTC has recovered from the September 1 low of $107,255 to close above $116,700 on Tuesday, marking three consecutive weeks of gains.
All eyes today are on the Fed. Market participants are almost certain that the US central bank will cut borrowing costs by at least 25 basis points at the end of a two-day policy meeting to support the softening labor market.
Still, beyond the decision on rates, attention will be in the so-called dot plot, which displays how each of the Fed's policymakers expects rates to go in the following years. QCP Capital’s analyst reported, “Investor focus is squarely on the Summary of Economic Projections (SEP) for clarity on the pace and scale of easing through 2026.”
The current market pricing reflects three cuts in 2025 and an additional three in 2026. Any changes to these expectations, together with Powell’s press conference, will provide further details on the Fed’s near-term policy path.
"If the Fed matches this expectation ('Goldilocks' balance), financial conditions will remain supportive for risk assets, such as stocks and crypto," QCP analysts added.
Still, as the crypto market performance is currently lagging behind equities, it may not see the same upside unless momentum improves, the report concludes.
Bitcoin volatility remains low ahead of the Fed storm
The volatility chart below indicates that Bitcoin’s current price action remains in a ‘docile’ phase, with 7-day volatility hitting yearly lows below 0.7% last Tuesday before inching higher as BTC pushed past $115,000.
Despite the uptick, volatility hovers near 1%, a level rarely seen outside brief lulls in the past year – a pattern that has historically preceded sharp breakouts once momentum returns. The trigger, thus, could occur amid the Fed meeting.
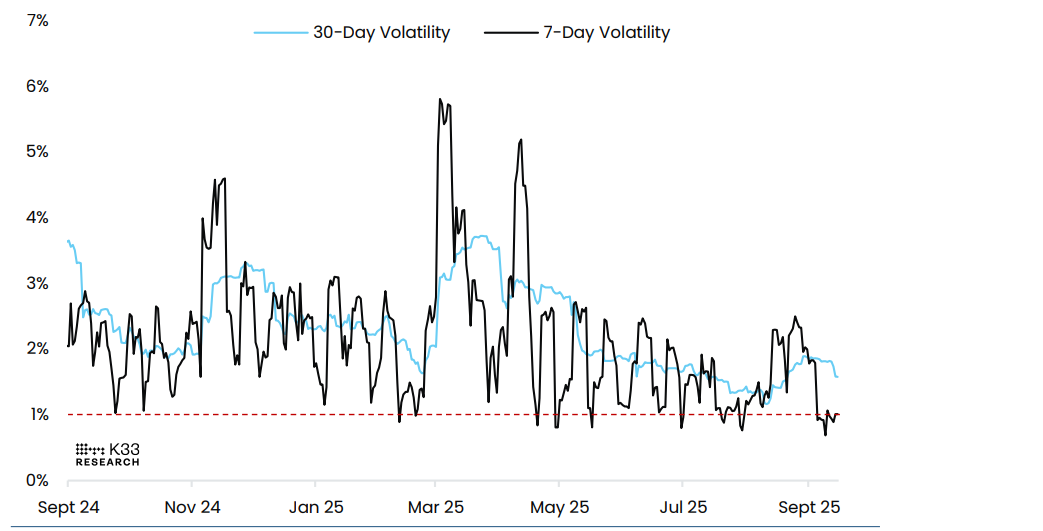
BTC/USD volatility chart. Source: K33 Research
Mixed signals from on-chain metrics
CryptoQuant's report on Tuesday highlights that, while markets anticipate a rate cut, on-chain data shows diverging signals.
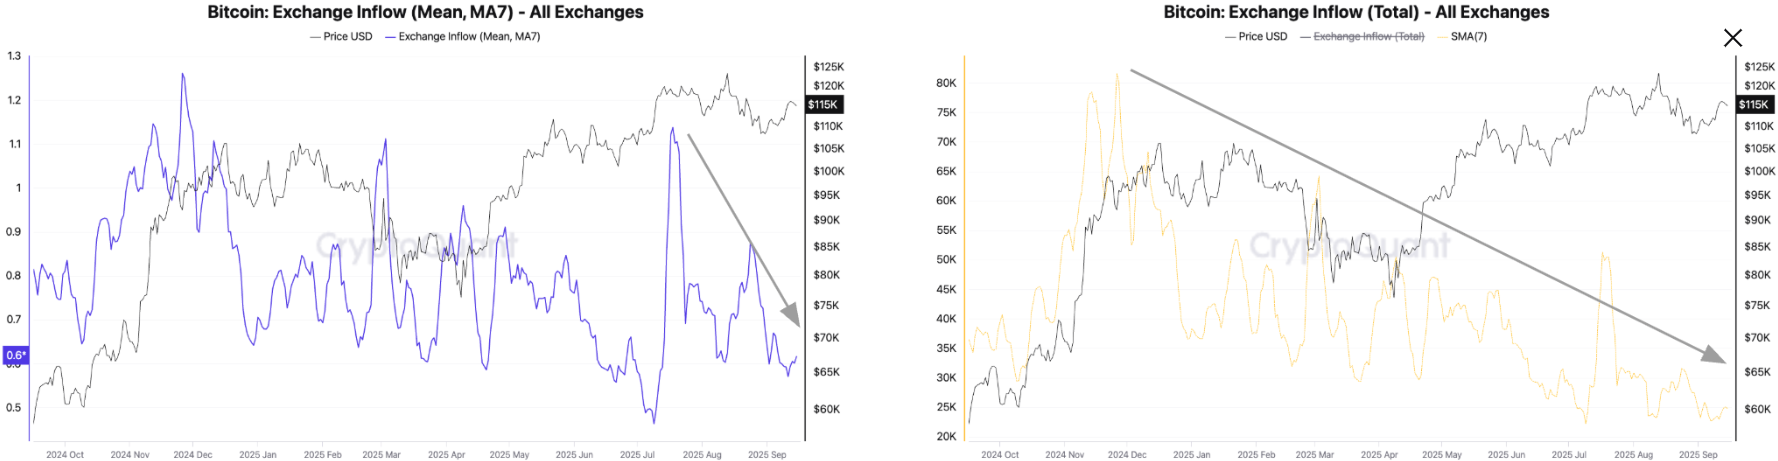
Bitcoin selling pressure remains at low levels ahead of the Fed's interest rate decision, as large deposits into exchanges decline. The chart below shows that the total Bitcoin flowing into exchanges has declined to a 7-day moving average value of 25,000 BTC, one of the lowest levels in over a year, and a significant drop from 51,000 BTC in July 17, when Bitcoin was trading around $120,000 for the first time ever.
Additionally, the average exchange deposit amount has declined from 1.14 BTC in July 18 to as low as 0.57 BTC so far in September, highlighting reduced selling pressure.
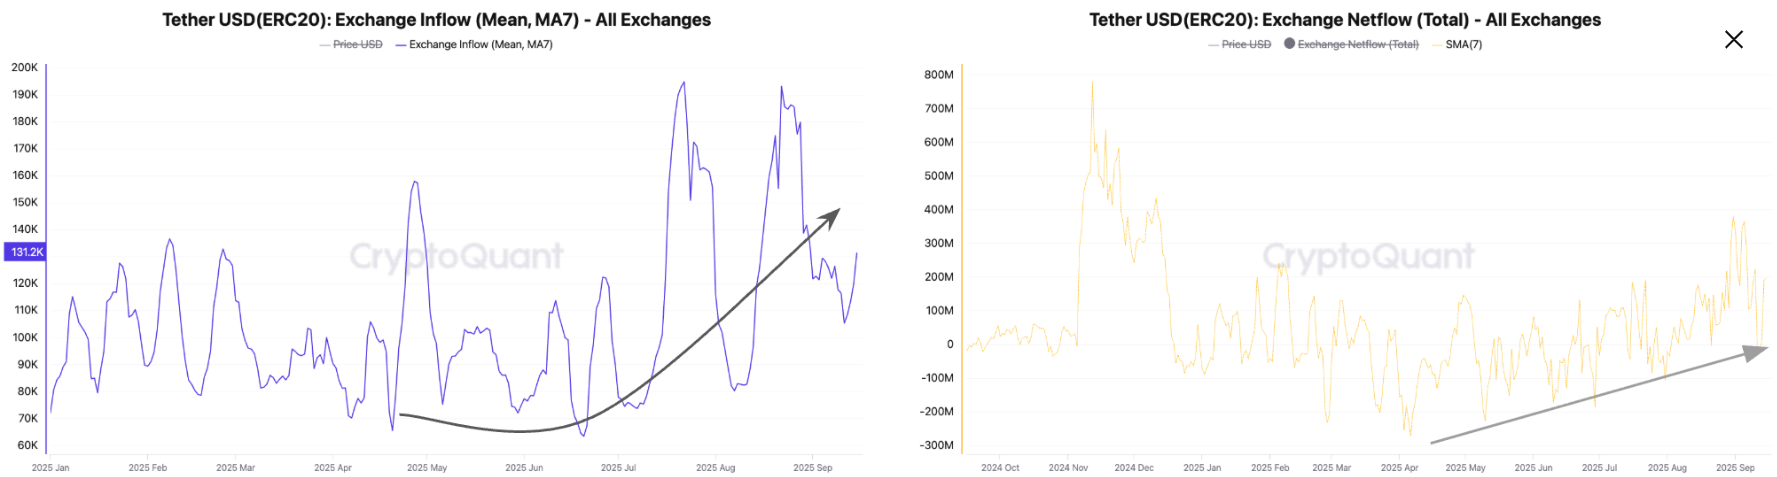
Apart from this, the dry powder necessary for a crypto rally is expanding, with total deposits of USDT into exchanges growing as large investors position themselves ahead of the Fed decision.
The Net USDT deposits rose from $273 million on April 6 to $379 million on August 31, the highest level this year. The higher amount of USDT flowing into exchanges is driven by large deposits, as the average daily deposit has increased from a 2025 low of $63,000 in July to $130,000 on Tuesday.
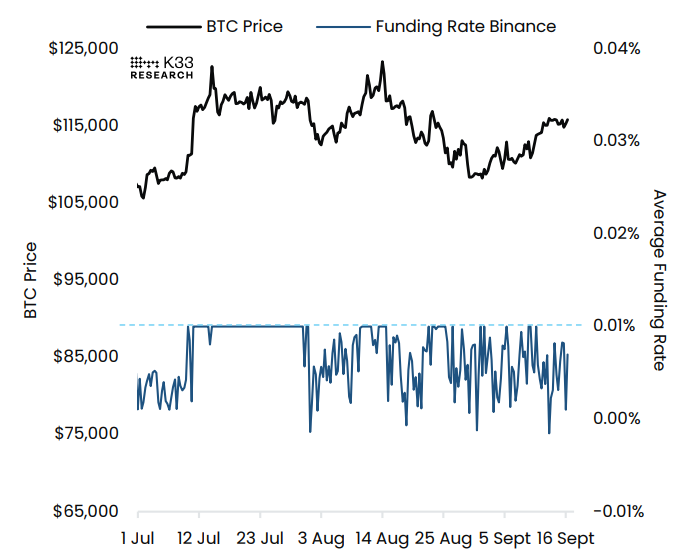
However, traders should still be cautious as the market remains undecided. Funding rates maintain an erratic pattern, hovering below neutral levels as traders remain reluctant to add long exposure.
Bitcoin Price Forecast: Heading toward $120,000 or correction to $107,000?
Bitcoin price has faced resistance around the $116,000 daily level since last Friday and hovered below this level for the next three days. However, on Tuesday, BTC rose and closed above $116,000. At the time of writing on Wednesday, it slides to trade at around $116,400.
If the $116,000 daily level holds as support, BTC could extend the rally toward its psychological level at $120,000.
The Relative Strength Index (RSI) on the daily chart reads 59, which is above its neutral level of 50, indicating that bullish momentum is gaining traction. The Moving Average Convergence (MACD) indicator on the same chart displayed a bullish crossover on September 6, which remains in effect, indicating sustained bullish momentum.
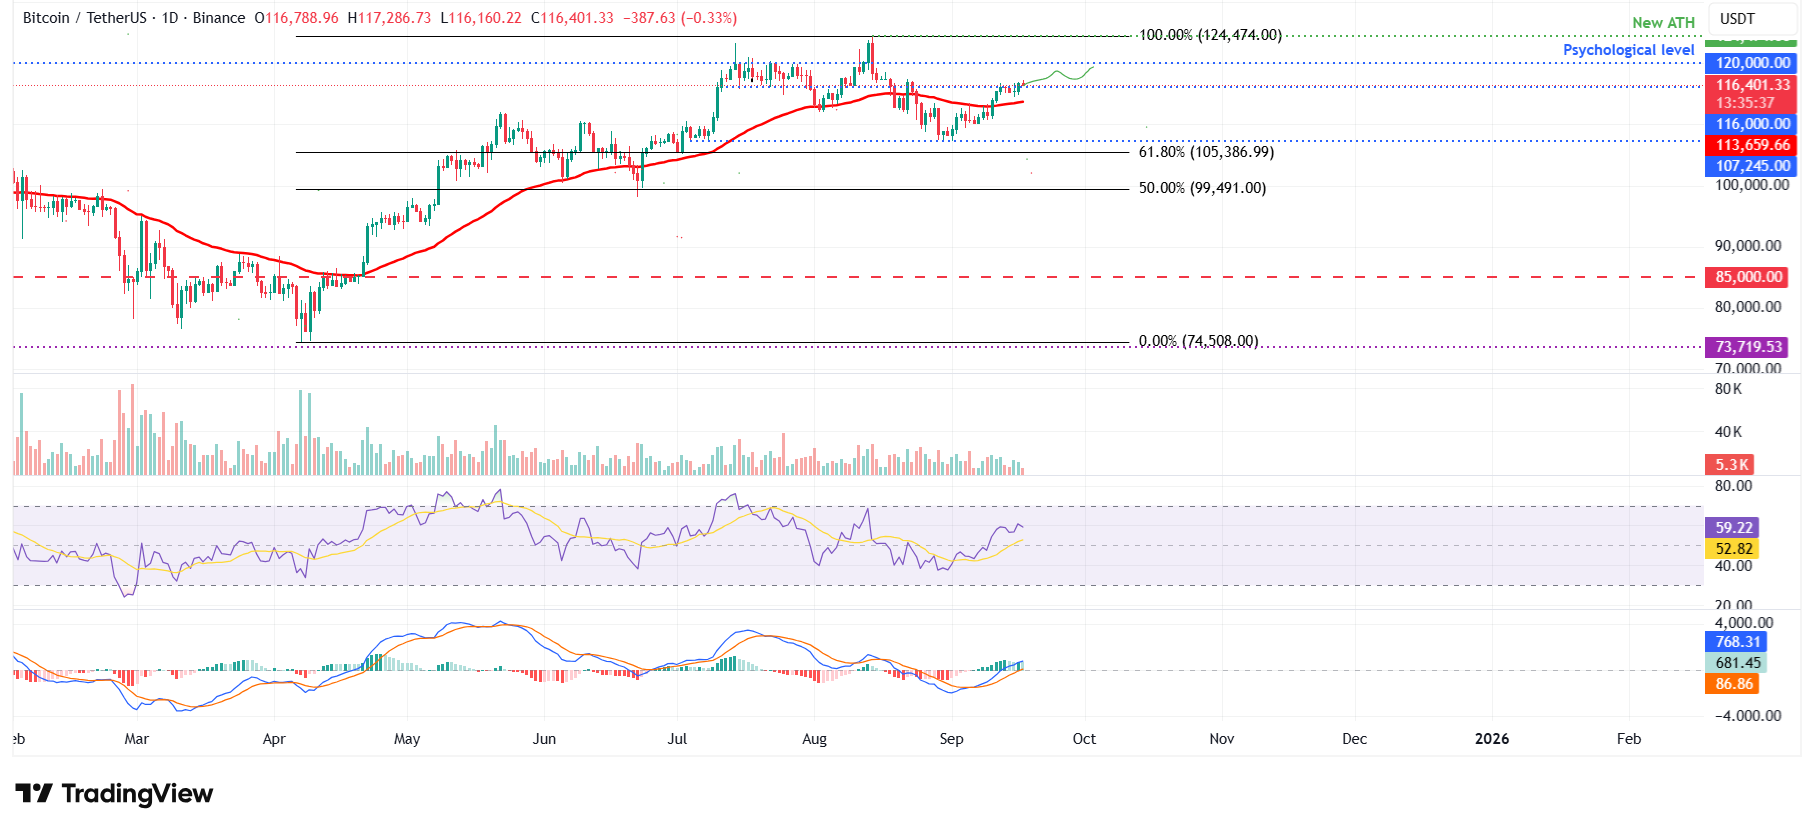
BTC/USDT daily chart
However, if BTC corrects and closes below the support at $116,000, it could extend the decline toward its daily support at $107,245.
Cryptocurrency metrics FAQs
The developer or creator of each cryptocurrency decides on the total number of tokens that can be minted or issued. Only a certain number of these assets can be minted by mining, staking or other mechanisms. This is defined by the algorithm of the underlying blockchain technology. On the other hand, circulating supply can also be decreased via actions such as burning tokens, or mistakenly sending assets to addresses of other incompatible blockchains.
Market capitalization is the result of multiplying the circulating supply of a certain asset by the asset’s current market value.
Trading volume refers to the total number of tokens for a specific asset that has been transacted or exchanged between buyers and sellers within set trading hours, for example, 24 hours. It is used to gauge market sentiment, this metric combines all volumes on centralized exchanges and decentralized exchanges. Increasing trading volume often denotes the demand for a certain asset as more people are buying and selling the cryptocurrency.
Funding rates are a concept designed to encourage traders to take positions and ensure perpetual contract prices match spot markets. It defines a mechanism by exchanges to ensure that future prices and index prices periodic payments regularly converge. When the funding rate is positive, the price of the perpetual contract is higher than the mark price. This means traders who are bullish and have opened long positions pay traders who are in short positions. On the other hand, a negative funding rate means perpetual prices are below the mark price, and hence traders with short positions pay traders who have opened long positions.
추천 기사


