
Silver Price Forecast: XAG/USD bounces back to near $36 as Middle East conflict lingers
- Silver price recovers sharply to near $36.00 after attracting bids around the 20-day EMA.
- The White House clarified that the US has no plans to strike Iran immediately.
- The Fed warned of upside inflation risks under the Trump’s leadership.
Silver price (XAG/USD) claws back half of its early losses and rebounds to near $36.10 during the European trading session on Friday. The white metal attracted bids after revisiting the two-week low around $35.50 as tensions in the Middle East remain intact amid the aerial war between Israel and Iran.
Heightened geopolitical tensions increase demand for safe-haven assets, such as Silver.
Earlier in the day, the Silver price faced a sharp sell-off after comments from the White House signaled that the United States (US) will not involve in the Israel-Iran war immediately.
The demand for safe-haven assets increased sharply on Thursday after a report from Bloomberg showed that senior US officials are preparing for the possibility of a strike on Iran as soon as the weekend.
Meanwhile, consistent warnings from the Federal Reserve (Fed) that new economic policies imposed by US President Donald Trump after returning the White House will be inflationary for the economy have also increased the safe-haven appeal of the Silver price.
Silver performs better in a high-inflation environment, but a restrictive monetary policy stance by the Fed bodes poorly non-yielding assets.
On Wednesday, the Fed warns of upside inflation risks after leaving interest rates steady in the range of 4.25%-4.50%. “We’ve had goods inflation moving up a bit and expect to see more of that in summer,” Fed Chair Jerome Powell said in the press conference following the interest rate decision.
Silver technical analysis
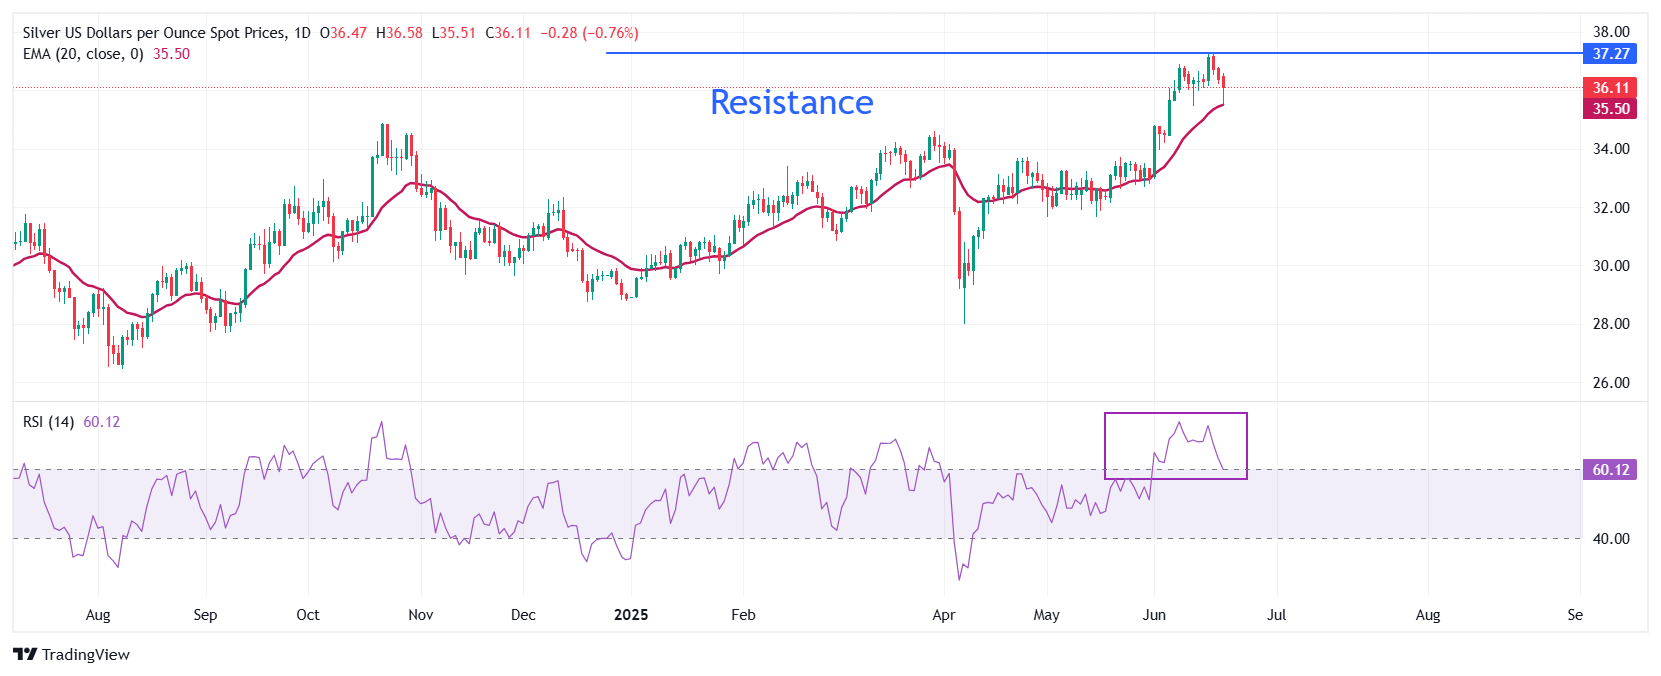
Silver price recovers sharply after attracting bids near the 20-day Exponential Moving Average (EMA), which trades around $35.50. The white metal has corrected after posting a fresh over-a-decade high around $37.30 on Wednesday.
The 14-day Relative Strength Index (RSI) declines to near 60.00. A fresh bullish momentum would emerge if the RSI holds above that level.
Looking down, the October 22 low around $34.87 will act as key support zone. On the upside, the June 18 high of $37.32 will act as key hurdle.
Silver daily chart
Silver FAQs
Silver is a precious metal highly traded among investors. It has been historically used as a store of value and a medium of exchange. Although less popular than Gold, traders may turn to Silver to diversify their investment portfolio, for its intrinsic value or as a potential hedge during high-inflation periods. Investors can buy physical Silver, in coins or in bars, or trade it through vehicles such as Exchange Traded Funds, which track its price on international markets.
Silver prices can move due to a wide range of factors. Geopolitical instability or fears of a deep recession can make Silver price escalate due to its safe-haven status, although to a lesser extent than Gold's. As a yieldless asset, Silver tends to rise with lower interest rates. Its moves also depend on how the US Dollar (USD) behaves as the asset is priced in dollars (XAG/USD). A strong Dollar tends to keep the price of Silver at bay, whereas a weaker Dollar is likely to propel prices up. Other factors such as investment demand, mining supply – Silver is much more abundant than Gold – and recycling rates can also affect prices.
Silver is widely used in industry, particularly in sectors such as electronics or solar energy, as it has one of the highest electric conductivity of all metals – more than Copper and Gold. A surge in demand can increase prices, while a decline tends to lower them. Dynamics in the US, Chinese and Indian economies can also contribute to price swings: for the US and particularly China, their big industrial sectors use Silver in various processes; in India, consumers’ demand for the precious metal for jewellery also plays a key role in setting prices.
Silver prices tend to follow Gold's moves. When Gold prices rise, Silver typically follows suit, as their status as safe-haven assets is similar. The Gold/Silver ratio, which shows the number of ounces of Silver needed to equal the value of one ounce of Gold, may help to determine the relative valuation between both metals. Some investors may consider a high ratio as an indicator that Silver is undervalued, or Gold is overvalued. On the contrary, a low ratio might suggest that Gold is undervalued relative to Silver.
추천 기사


