
Gold steadies on the second day of US-China trade talks
- Gold price finds support above $3,300, with resistance forming at $3,350.
- US-China trade talks continue for the second day in London.
- The US Dollar remains supported by improved trade relations, which pose a direct threat to Gold’s upside potential.
Gold price is lacking conviction on Tuesday, with the precious metal trading in a flat range around $3,334 at the time of writing.
Ongoing trade talks between the United States and China continue to influence global risk sentiment, helping to stabilize the US Dollar (USD).
As US Treasury Secretary Scott Bessent, US Trade Representative Jamieson Greer, and US Commerce Secretary Howard Lutnick continue discussions with China’s Vice Premier He Lifeng for the second day in London, markets remain focused on trade-related developments.
Ahead of Tuesday’s meeting, Commerce Secretary Lutnick told reporters that trade talks with China are progressing well and added that he expects the talks to continue throughout the day, according to Reuters.
These negotiations are expected to continue influencing the direction of the Gold and US Dollar on Tuesday, as investors weigh the potential for eased tensions and improved economic cooperation between the world’s two largest economies.
Gold daily digest: US-China trade talks in London remain the primary focus for markets
- On Monday, Kevin Hassett, Director of the US National Economic Council (NEC), added to market optimism in an interview with CNBC, stating, “I expect this to be a short meeting with a firm handshake!”.
- In a Wall Street Journal comment, Hassett noted that the US anticipates “any export control from the US will be eased and the rare earths will be released in volumes.” Once the more significant issues have been addressed, the US and China are expected to discuss less-urgent matters.
- Additionally, positive remarks on Monday from US President Donald Trump, affirming that he is getting “good reports” from the meeting, are contributing to keeping market sentiment buoyed.
- Data released by China’s General Administration of Customs (GAC) on Monday showed that China’s exports to the US decreased by 35% YoY in May. This was the steepest decline since February 2020, when trade was severely disrupted by pandemic-related shutdowns.
- The expectation that China will release rare earths in volume signals potential relief for the US supply chain. These minerals are crucial for sectors such as technology, defense, and green energy, where they are essential for products like semiconductors, electric vehicles (EVs), and military hardware.
- These developments are significant not only for geopolitical stability but also for global economic growth forecasts.
- The next fundamental catalyst on the US economic calendar will be on Wednesday, with the release of US Consumer Price Index (CPI) data for May. Expectations are for headline US CPI to rise by 0.2% on a monthly basis. Inflation is expected to increase to 2.5% YoY, from 2.3% in April.
- The core CPI, which excludes food and energy prices, is expected to show a 0.3% MoM increase in May compared to 0.2% in April. The YoY figure is also estimated to reflect a 0.1% increase, rising to 2.9% compared to 2.8% in April.
- The inflation data is an important contributor to interest rate expectations, which drive the direction of the USD and the Gold price. Friday’s Nonfarm Payroll report (NFP), which showed the US economy added more jobs than anticipated in May (139,000 vs. an estimated 130,000), helped ease USD weakness, placing less pressure on the Federal Reserve (Fed) to cut interest rates in the near term.
- With stronger employment data increasing the likelihood that the Fed will cut interest rates by 25 basis points in September, the prospect of higher-for-longer interest rates weighs on the non-yielding Gold price, which is inversely correlated with the Greenback.
- According to the CME FedWatch Tool, market participants expect the Fed to leave interest rates unchanged within the current 4.25% to 4.50% range at the June and July meeting, with a 54.7% probability of a rate cut priced in for September.
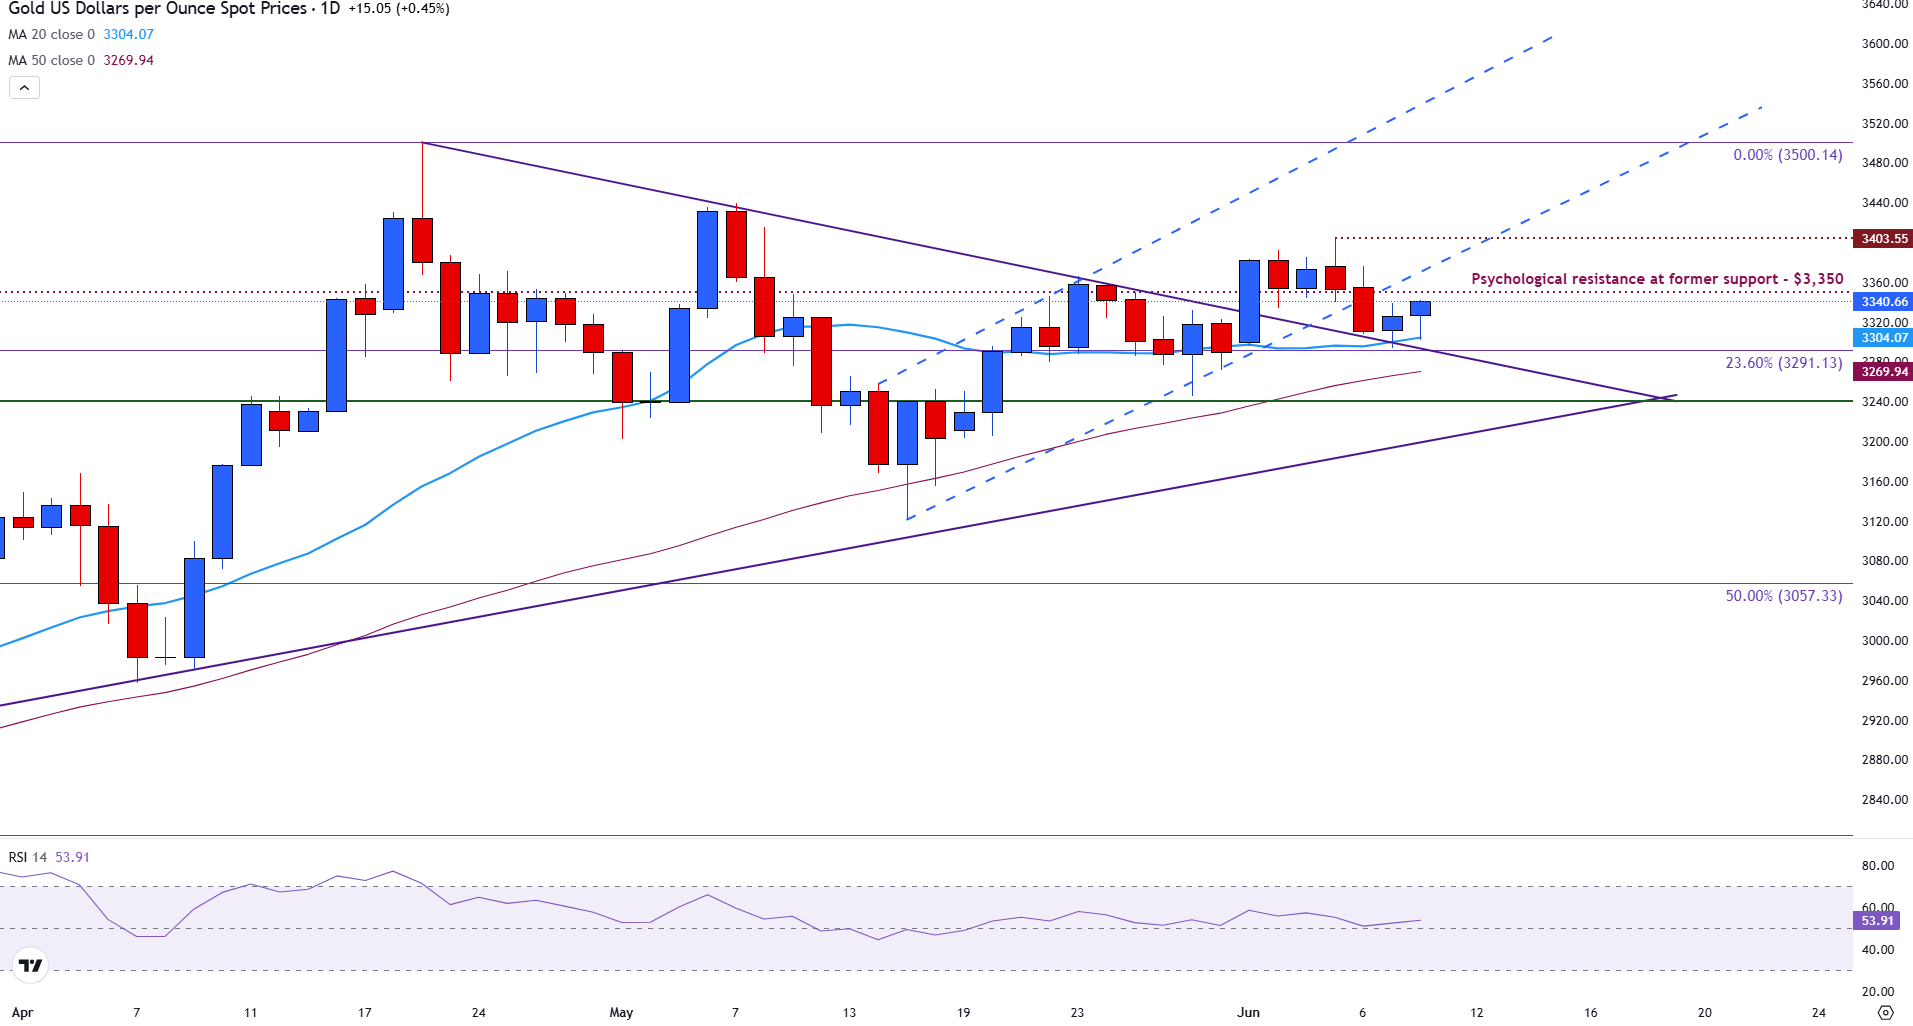
Gold technical analysis: XAU/USD stalls above moving average support
Gold price is currently holding above the $3,300 mark, hovering around $3,330 at the time of writing, as the market finds short-term support in this range.
On the upside, resistance is forming near the psychological level of $3,350, and a break above this barrier could open the door for a move toward Friday’s high near $3,375. Further up, the $3,392 resistance level limited the bullish potential last week, followed by the $3,400 psychological level. If buyers clear this zone and bullish momentum gains traction, a move toward the April all-time high at $3,500 may be possible.
However, the Relative Strength Index (RSI) indicator flattens near the neutral zone of 50 in the daily chart, signalling a lack of momentum and indecision among traders.
In the event of a downside move, the immediate support for the Gold price is at the 20-day Simple Moving Average (SMA) at $3,303, just above the next psychological support zone of $3,300, and ahead of the 23.6% Fibonacci retracement level of the January-April rise at $3,291.
The 50-day SMA could then provide an additional layer of support around $3,270, while the tip of a symmetrical triangle chart pattern could provide another important barrier for downside price action at $3,240.
Gold (XAU/USD) daily chart
US-China Trade War FAQs
Generally speaking, a trade war is an economic conflict between two or more countries due to extreme protectionism on one end. It implies the creation of trade barriers, such as tariffs, which result in counter-barriers, escalating import costs, and hence the cost of living.
An economic conflict between the United States (US) and China began early in 2018, when President Donald Trump set trade barriers on China, claiming unfair commercial practices and intellectual property theft from the Asian giant. China took retaliatory action, imposing tariffs on multiple US goods, such as automobiles and soybeans. Tensions escalated until the two countries signed the US-China Phase One trade deal in January 2020. The agreement required structural reforms and other changes to China’s economic and trade regime and pretended to restore stability and trust between the two nations. However, the Coronavirus pandemic took the focus out of the conflict. Yet, it is worth mentioning that President Joe Biden, who took office after Trump, kept tariffs in place and even added some additional levies.
The return of Donald Trump to the White House as the 47th US President has sparked a fresh wave of tensions between the two countries. During the 2024 election campaign, Trump pledged to impose 60% tariffs on China once he returned to office, which he did on January 20, 2025. With Trump back, the US-China trade war is meant to resume where it was left, with tit-for-tat policies affecting the global economic landscape amid disruptions in global supply chains, resulting in a reduction in spending, particularly investment, and directly feeding into the Consumer Price Index inflation.
추천 기사


