


Gold fails to sustain a break above $4,200, US CPI in focus
- Gold reverses earlier gains on Monday after buyers fail to hold above $4,200.
- A firm US Dollar and elevated Treasury yields limit Gold’s upside as attention turns to US inflation data due this week.
- Gold retains a bearish bias below the Bollinger midline while consolidating between $4,100 and $4,200.
Gold (XAU/USD) edges lower on Monday, reversing earlier gains as traders avoid taking large positions ahead of US inflation data due later this week, which could offer fresh cues on the Federal Reserve’s (Fed) next move. At the time of writing, XAU/USD trades around $4,176, retreating from an intraday high of $4,217.
The metal has largely traded between $4,100 and $4,200 over the past two weeks, with neither bulls nor bears showing strong conviction. A firm US Dollar (USD) and elevated US Treasury yields keep the upside in check, while dip buyers remain active above the $4,000 psychological mark. Wednesday’s US Consumer Price Index (CPI) report could provide the catalyst needed to break this consolidation.
The US Dollar Index (DXY), which tracks the Greenback’s value against a basket of six major currencies, trades around 102.43 after touching an intraday low of 102.10, hovering near levels last seen in April 2025. The US Treasury cash market is closed on Monday due to the Columbus Day holiday. The benchmark 10-year yield stands around 5.24%, below last week’s peak near 5.36%, its highest since 2002.
September’s headline CPI is expected to rise 0.6% MoM, accelerating from 0.4% in August. Annual inflation is forecast to climb to 3.7% from 3.4%. Core CPI, which excludes food and energy, is projected to increase 0.2% monthly from previous 0.3%, although the annual rate is expected to edge up to 2.5% from 2.4%.
The inflation data will arrive ahead of the Fed’s October 27-28 meeting, with the CME FedWatch Tool showing an 80% chance that interest rates will remain unchanged at 3.75%-4.00%
Higher energy prices remain a key driver of inflation following the outbreak of the Middle East war in late February. Regional tensions have flared again with Houthi attacks on Saudi Arabia’s King Khalid International Airport, while tanker incidents in the Strait of Hormuz over the weekend underline persistent risks to shipping and energy supplies.
The energy shock keeps the door open to another Fed rate hike before year-end as policymakers seek to return inflation to the 2% target. Against this backdrop, Gold remains vulnerable to downside risks. A hotter-than-expected CPI report could revive October rate-hike bets, lift the US Dollar and Treasury yields, and put the $4,100 range floor under pressure. Softer inflation could instead trigger a break above $4,200.
However, firm underlying demand could help cushion losses. According to the World Gold Council, central banks reported net purchases of 39 tonnes in August, while global Gold exchange-traded funds (ETFs) attracted $10 billion in September.
Technical analysis: XAU/USD remains bearish below the Bollinger midline
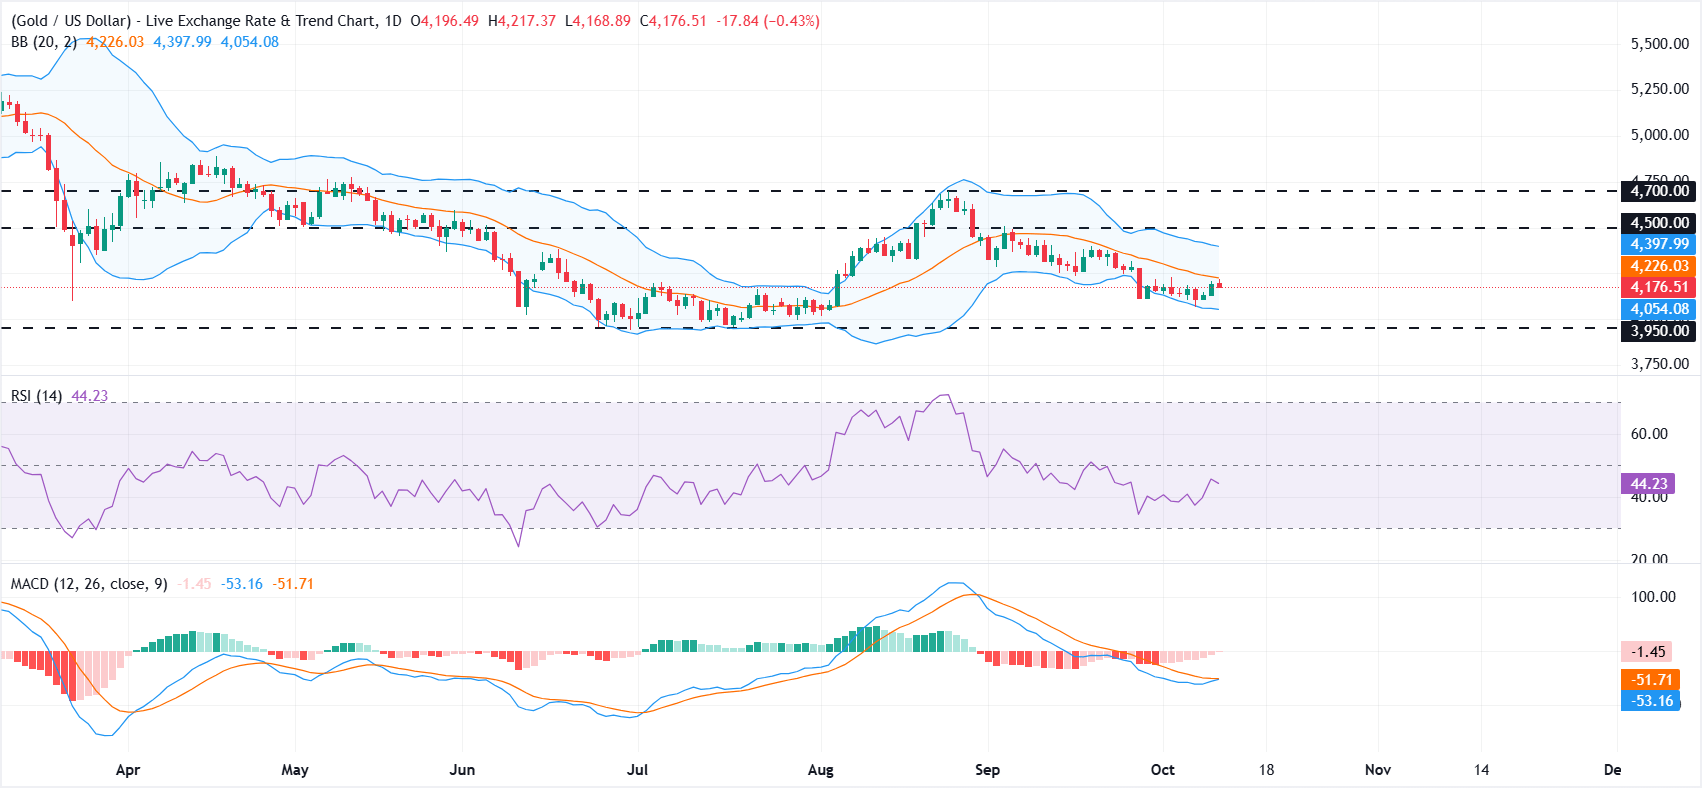
On the daily chart, XAU/USD holds a bearish near-term bias as it remains capped beneath the 20-day Simple Moving Average (SMA) from the Bollinger Bands around $4,226. The Relative Strength Index (RSI) at 44 hovers below the midline, hinting at subdued buying interest, while the Moving Average Convergence Divergence (MACD) recovers toward the zero line but stays marginally negative, suggesting that downside pressure is easing rather than reversing.
On the topside, initial resistance is located at the Bollinger midline near $4,226, followed by the upper band around $4,398, ahead of the more psychological hurdles at $4,500 and $4,700. On the downside, immediate support emerges at the lower Bollinger band around $4,054. A break below this level could expose the $4,000 psychological mark, followed by $3,950.
(The technical analysis of this story was written with the help of an AI tool. Know more.)
추천 기사


