


Crypto Today: Bitcoin, Ethereum and XRP face recovery headwinds as ETF outflows weigh
- Bitcoin’s upside remains capped under the $84,000 supply zone amid $681 million in ETF outflows last week.
- Ethereum slowly but steadily edges higher, supported by the 50-day EMA while the SuperTrend caps upside.
- XRP bulls move to defend a critical moving-average support cluster as declining momentum indicators reinforce sell-side pressure.
Cryptocurrency prices are broadly consolidating on Monday, with select tokens such as Ethereum (ETH) slowly edging higher above $2,500. Bitcoin (BTC) holds above $84,000 as bulls battle seller congestion, while Ripple (XRP) consolidates around $1.40.
Bitcoin and Ethereum ETF outflows mount
Major digital assets, including Bitcoin and Ethereum, saw persistent outflows from spot Exchange-Traded Funds (ETFs) last week, underscoring investor concerns about macroeconomic uncertainty, sticky geopolitical tensions in the Middle East, and growing sell-side pressure largely driven by profit-taking and buyer exhaustion.
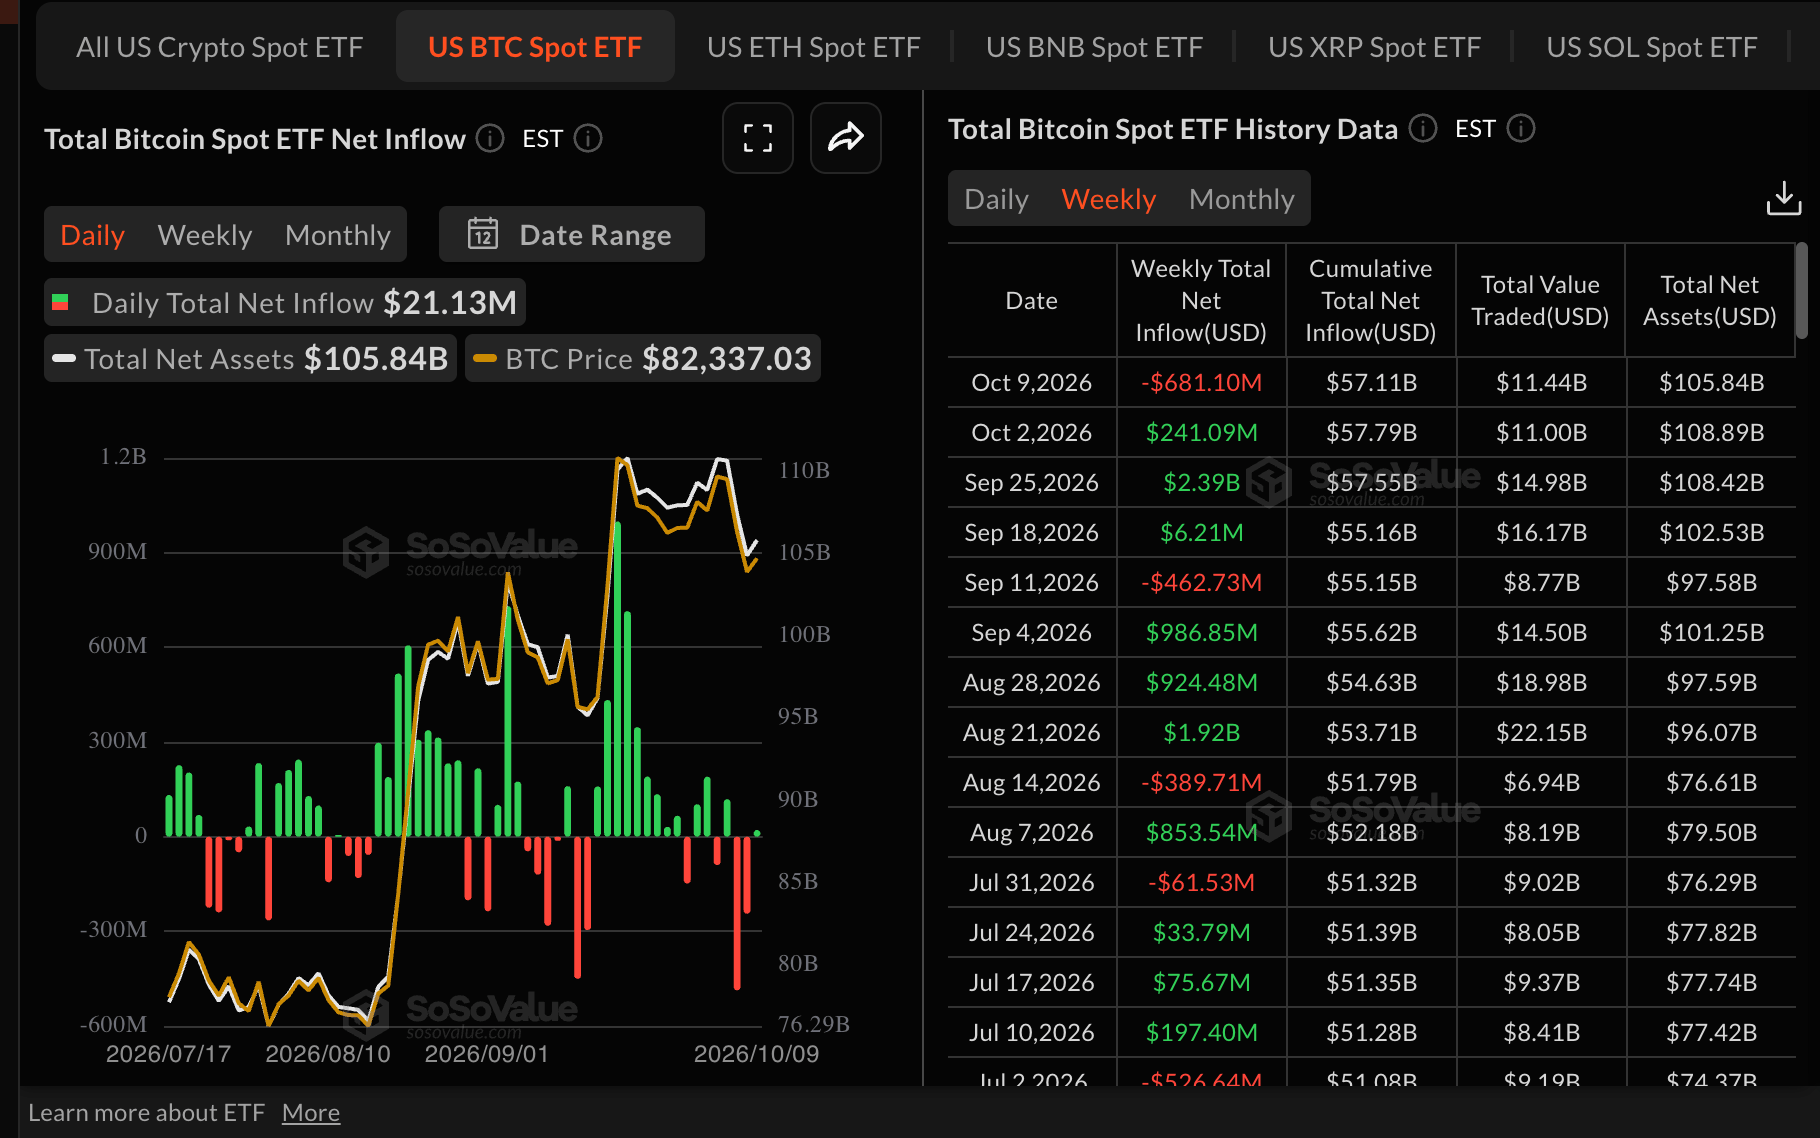
Bitcoin spot ETFs recorded $681 million in outflows last week, as cumulative inflows cooled to $57 billion. Total assets under management average $106 billion, according to SoSoValue.
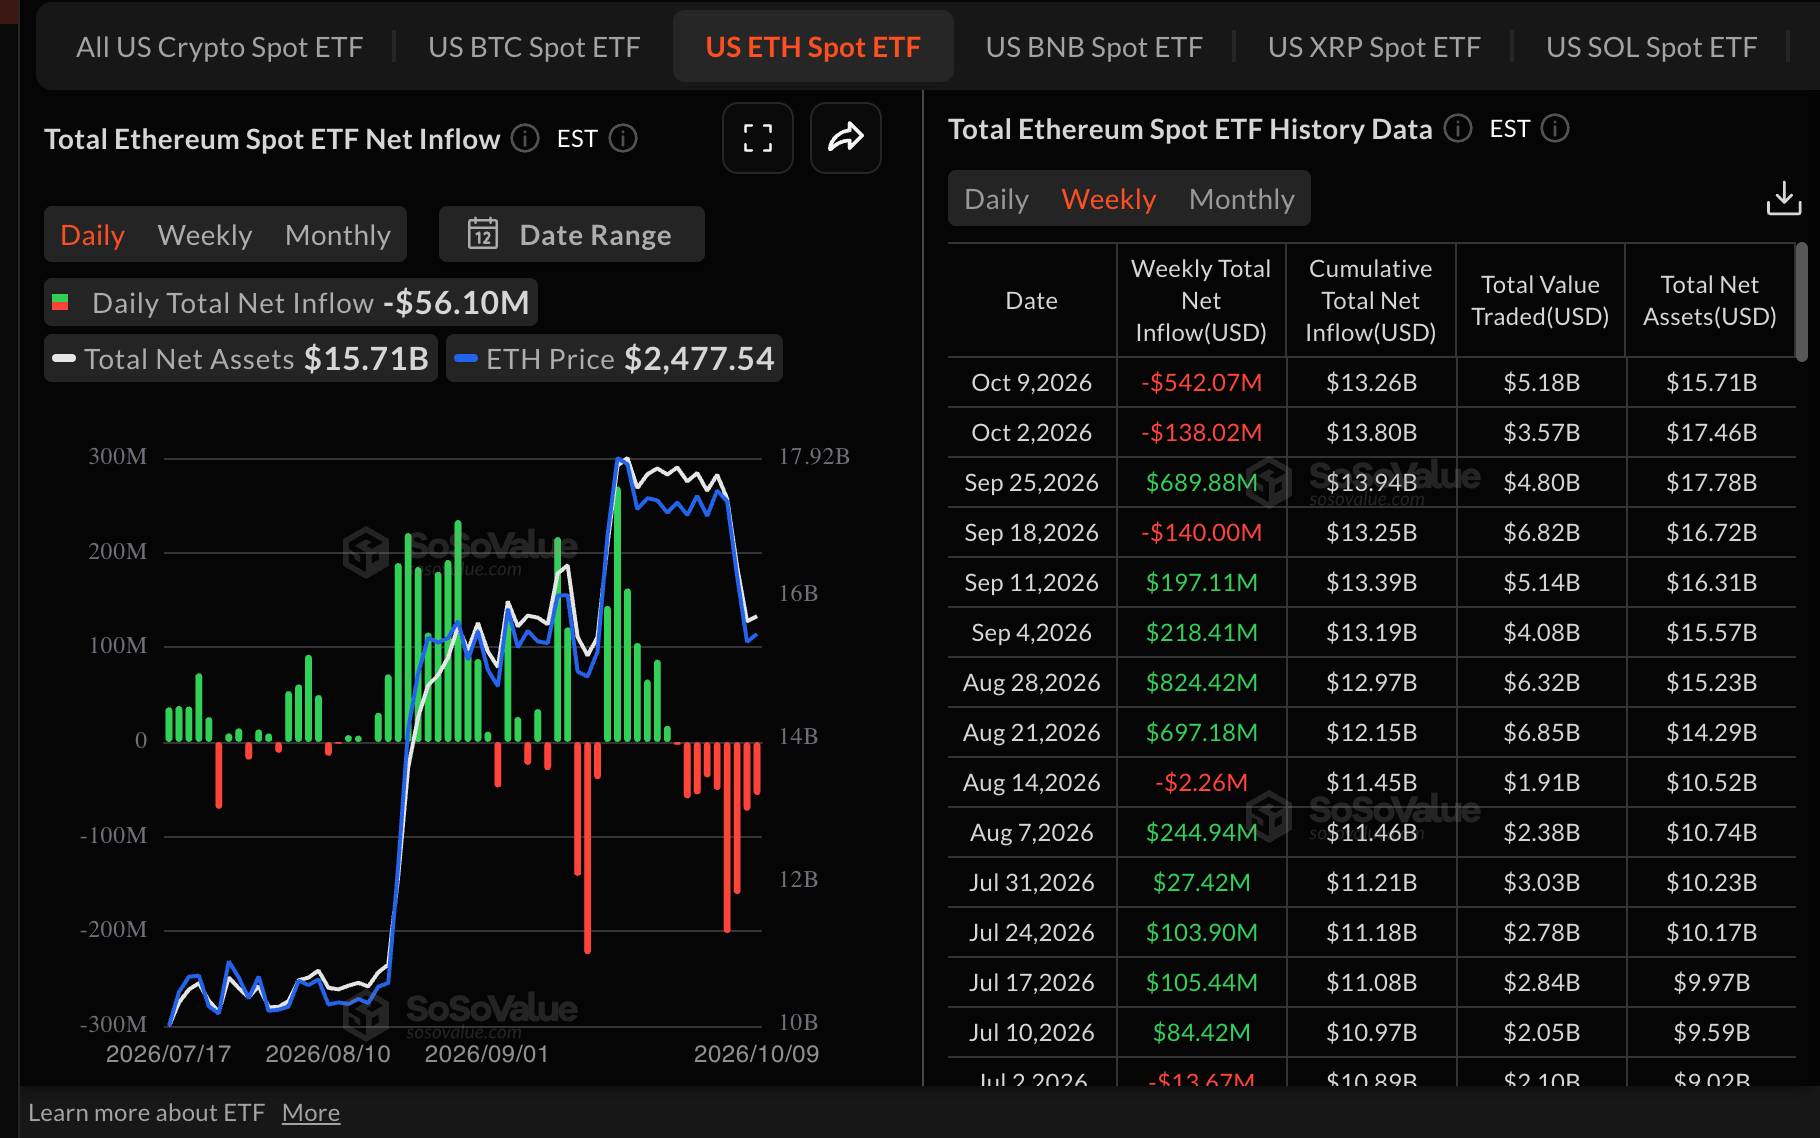
Ethereum spot ETFs also logged outflows of $542 million last week, suggesting some investors are reassessing risk exposure after the price rise over the last two months and key supply zones currently capping the token’s upside. Meanwhile, cumulative inflows stand at roughly $13 billion, with total net assets near $16 billion, underpinning investors' long-term positive outlook on ETH.
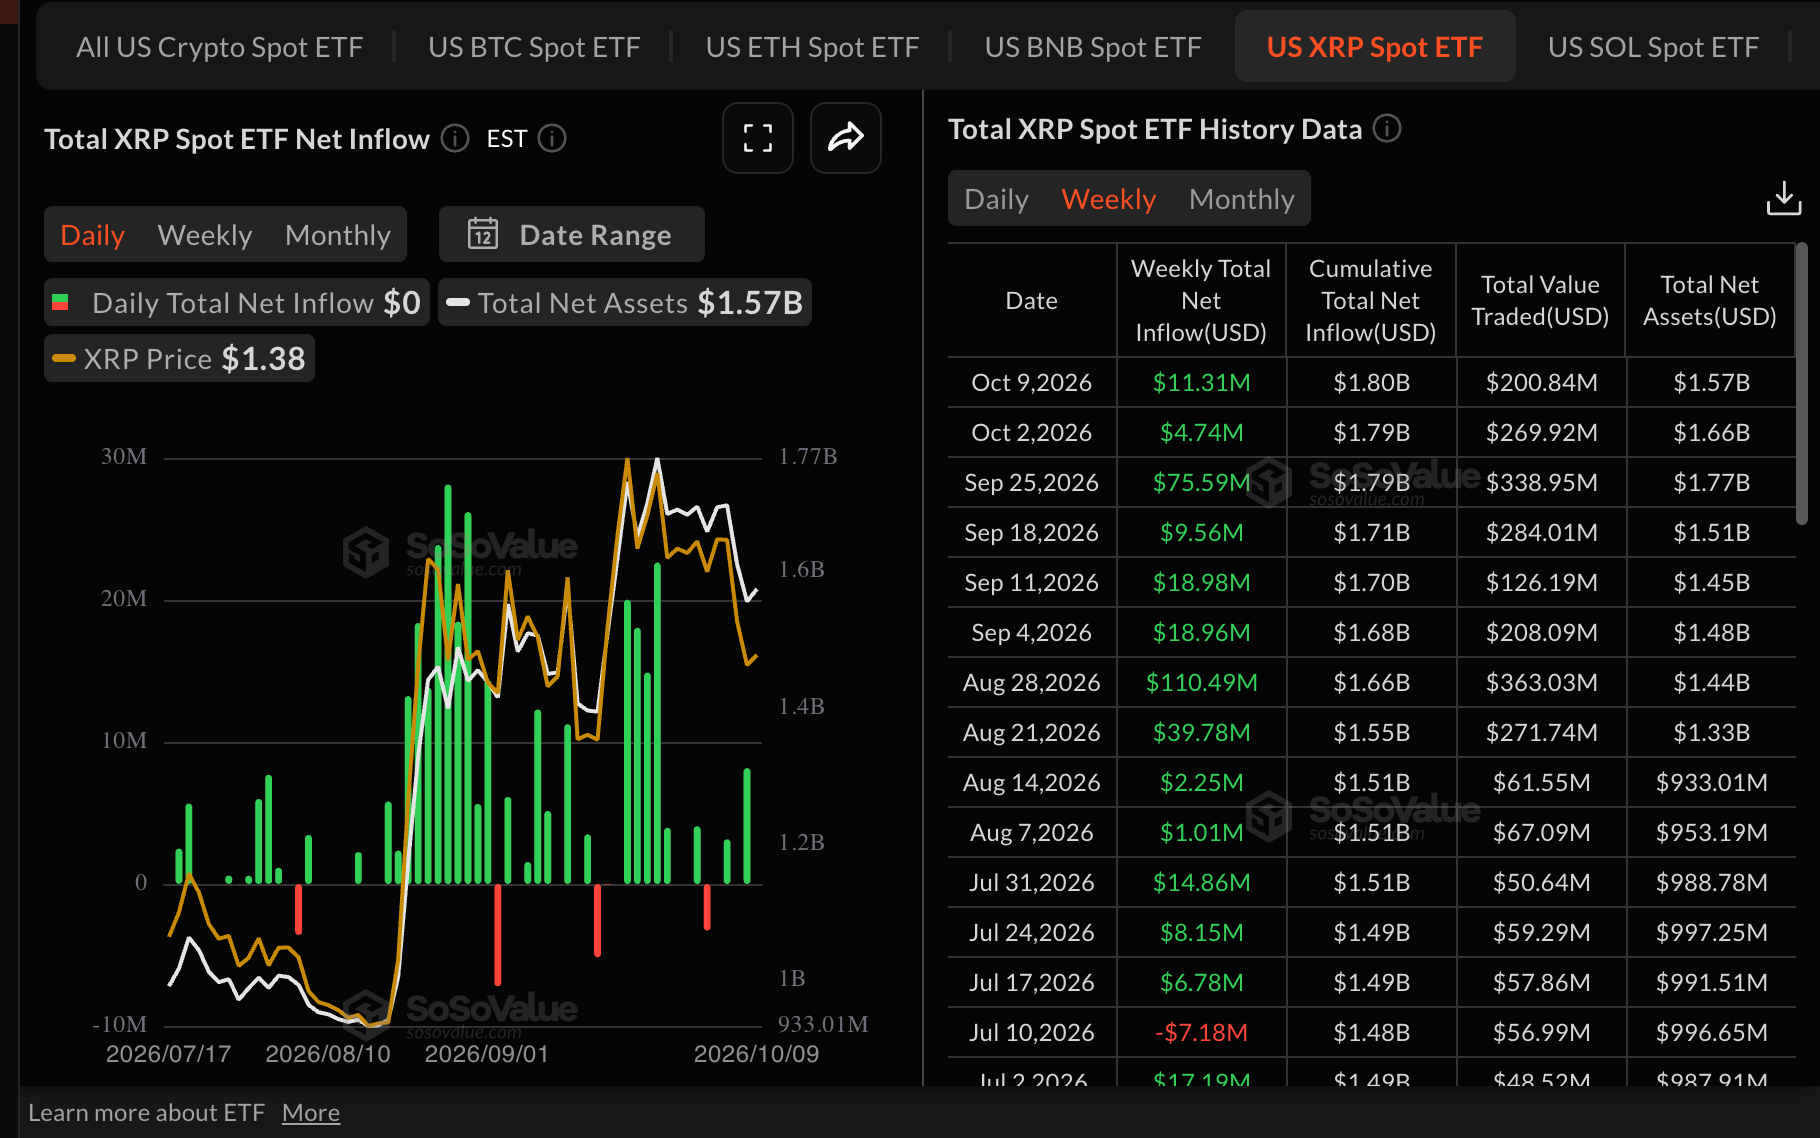
As for XRP spot ETFs, inflows increased to $11 million last week, from nearly $5 million the previous week. This marks more than a dozen straight weeks of inflows, totaling $1.8 billion. Total assets under management average $1.6 billion, underscoring more grounded support for the remittance token.
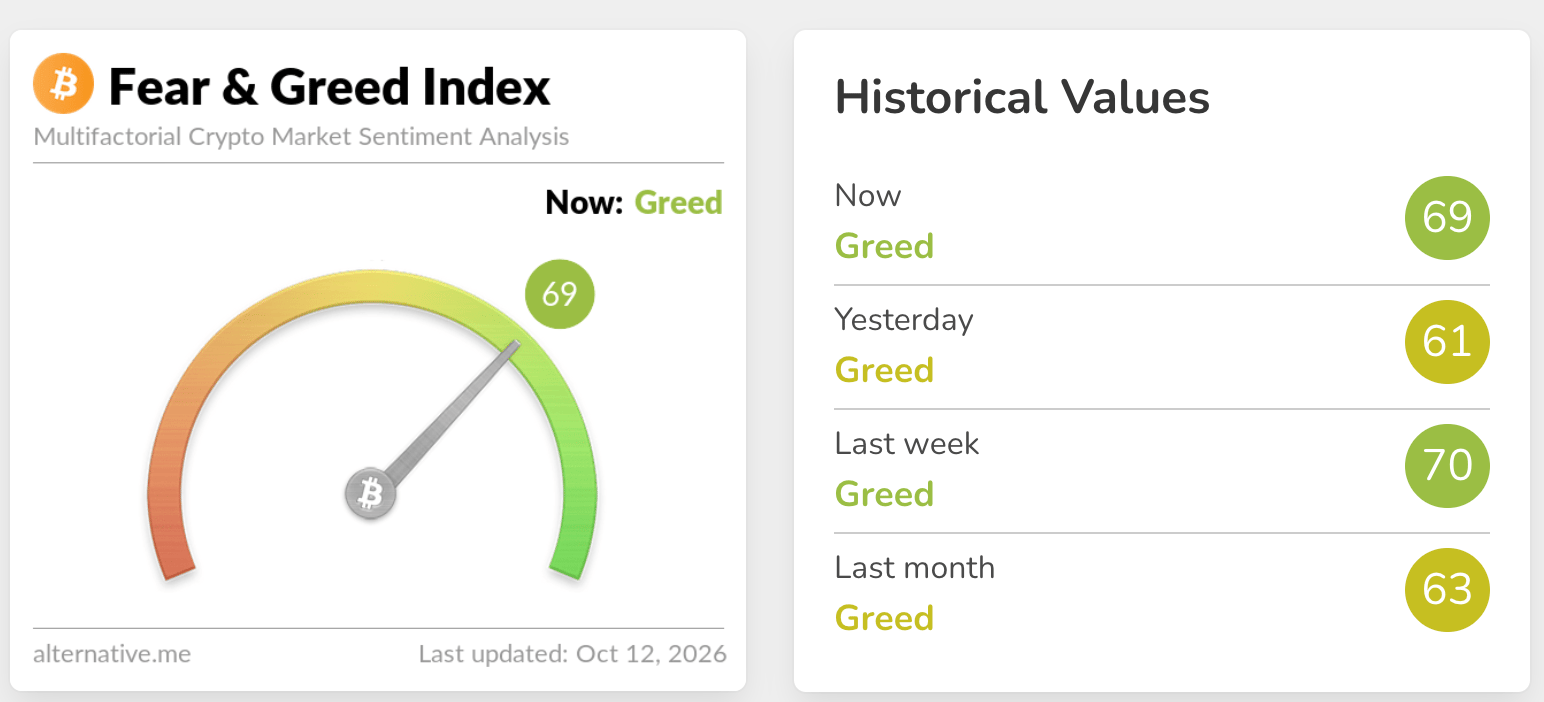
Interest in digital assets remains elevated as reflected in the Fear & Greed Index at 69 in the Greed territory on Monday, up from 61 the day before. This index reinforces overall stability in digital assets, cushioning against a continued sell-off amid prevailing volatility.
Technical analysis: Bitcoin trades below key resistance
Bitcoin is trading below the critical $84,000 psychological supply level as bulls and bears fight for control of the trend. Looking back, BTC has gained ground from last week's lows near $80,000 while still holding a bullish near‑term bias as price extends well above its main Exponential Moving Averages (EMAs). The 50‑day, 100-day and 200-day EMAs all sit comfortably below spot, suggesting an intact underlying uptrend despite recent consolidation.
At the same time, the SuperTrend indicator, last printed at $79,664, also runs below the market, reinforcing a supportive technical backdrop. Momentum signals are mixed but constructive, with the Relative Strength Index (RSI) at 54 hovering in neutral territory while the Moving Average Convergence Divergence (MACD) remains slightly negative, hinting that bullish pressure is present but not yet in an aggressive phase.
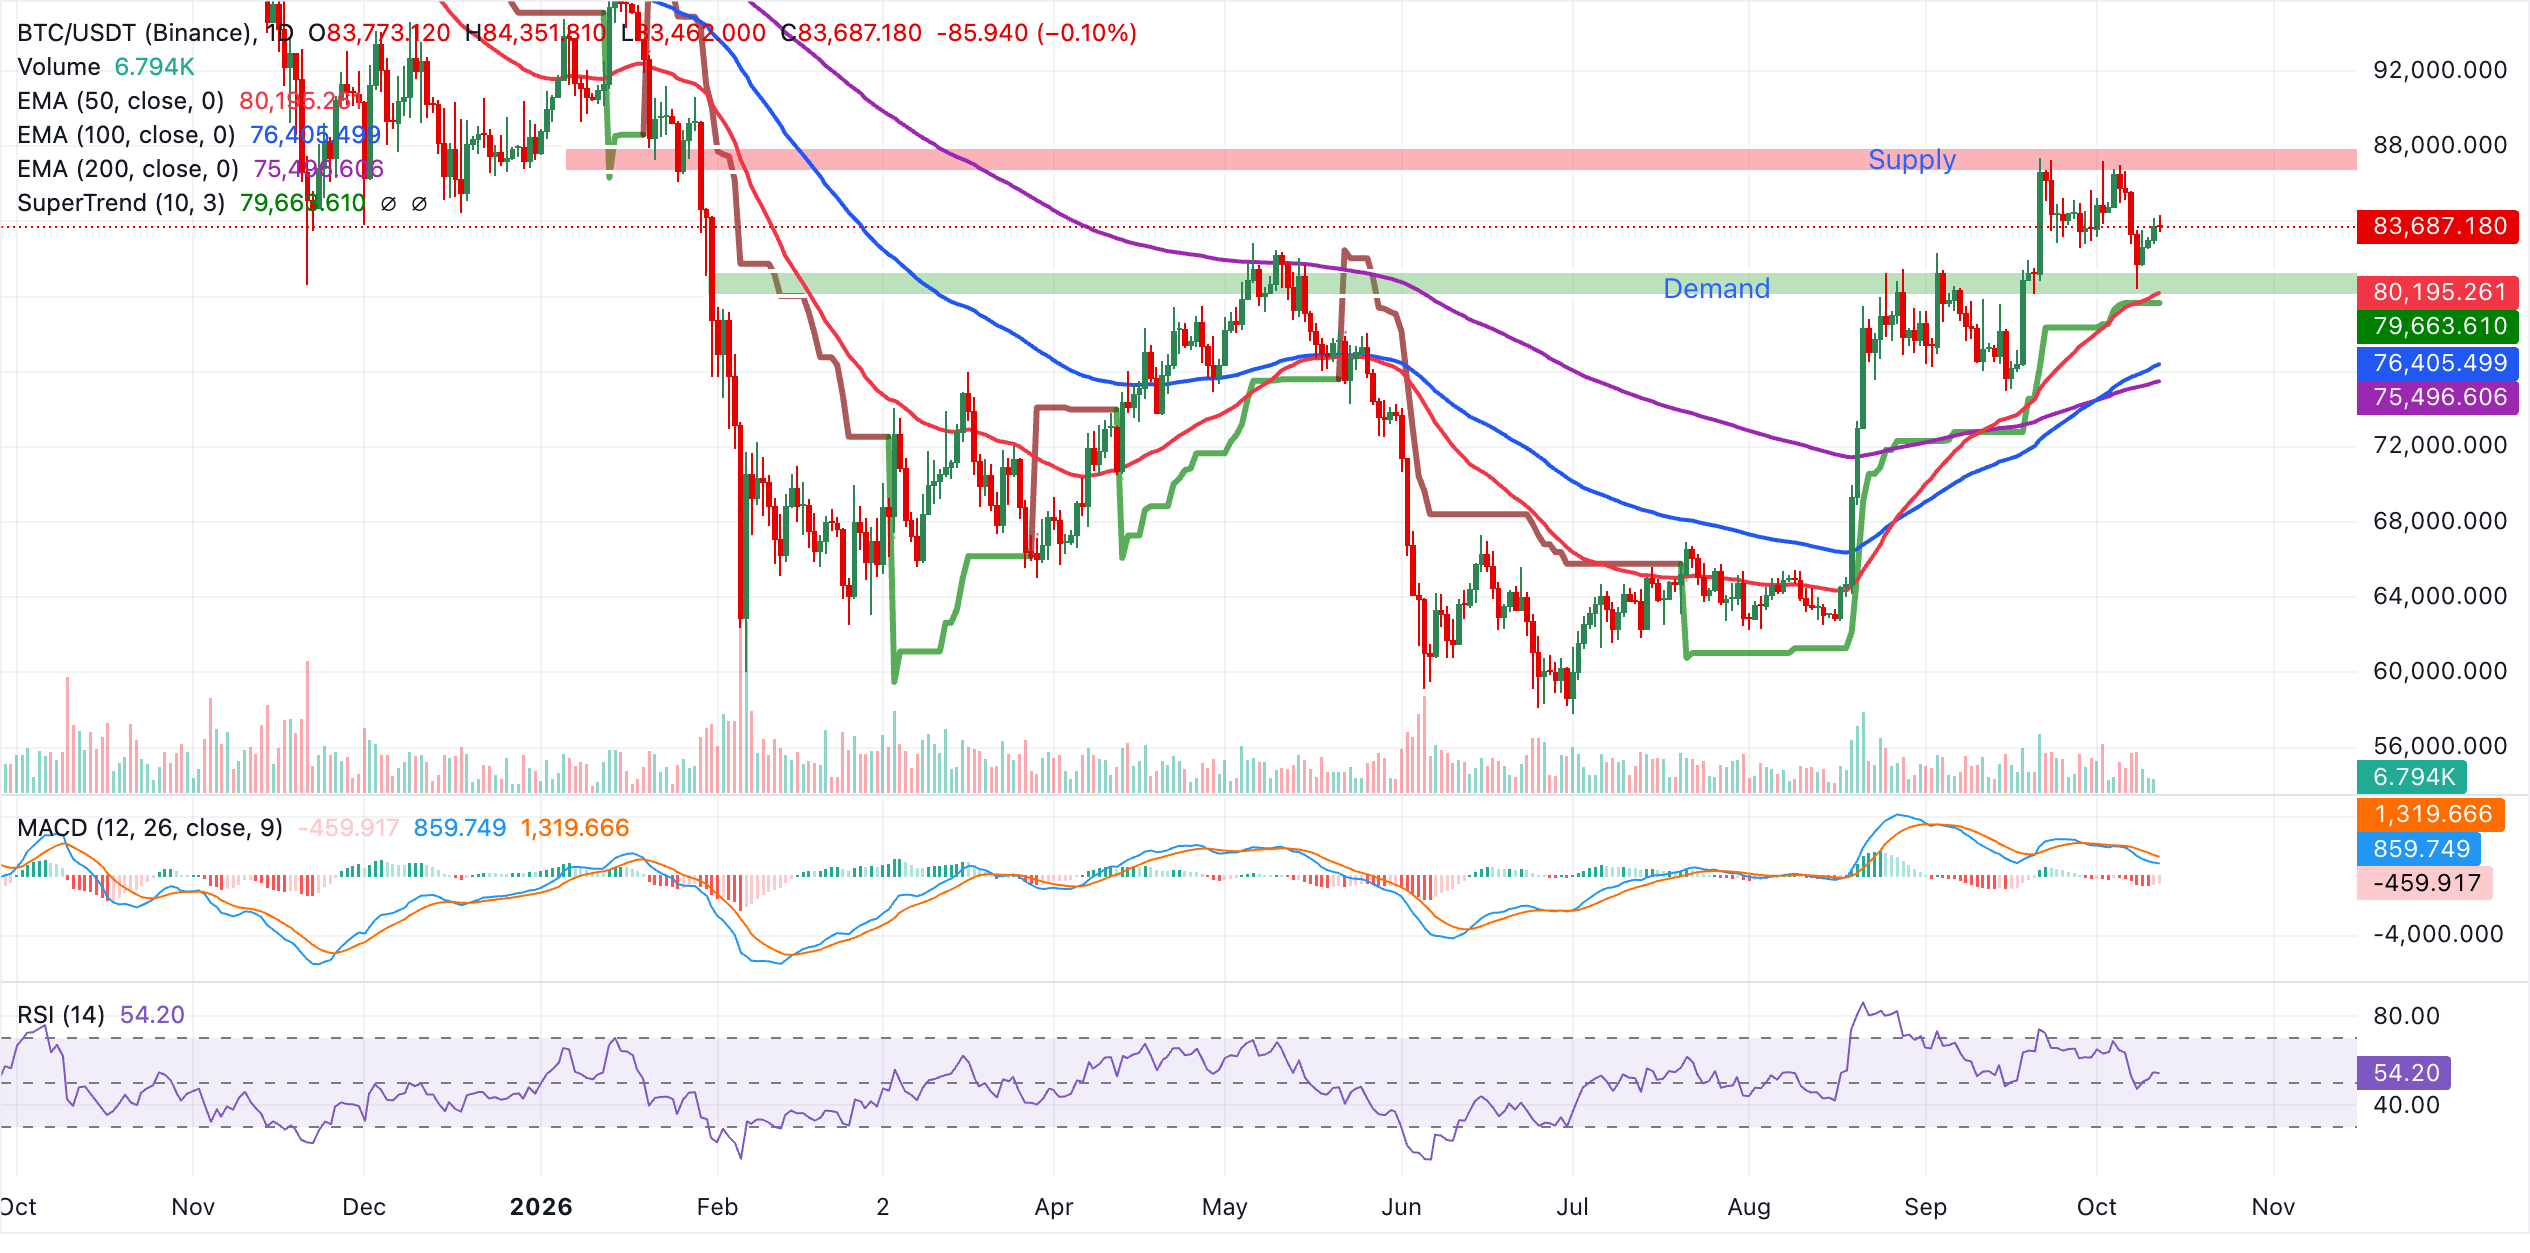
Initial support emerges at the SuperTrend line around $79,664, closely backed by the 50‑day EMA at $80,195, forming a first demand zone where dip‑buyers could re‑engage if volatility picks up. Below that cluster, the 100-day EMA at $76,406 and the 200-day EMA at $75,497 define a deeper structural support band that would be expected to attract stronger medium-term interest if tested.
With no clearly defined resistance levels on the daily chart, upside progress will likely be guided by price action itself and key supply zones such as $84,000 and $88,000. The current bullish configuration remains valid as long as BTC holds above the aforementioned moving average supports.
Altcoins technical outlook: Ethereum ticks up as XRP consolidates
Ethereum holds firm above the key $2,500 support level but faces resistance near the $2,600 supply zone. Despite recent momentum fading, the smart contract giant maintains a bullish near-term outlook, with price action supported by the 50-day, 100-day, and 200-day EMAs, clustered between approximately $2,505 and $2,308, signaling that the broader uptrend remains intact.
The SuperTrend indicator at $2,754 sits overhead as the next directional trigger, while the RSI around 47 points to neutral momentum and the MACD remains negative, suggesting upside attempts may be choppier.
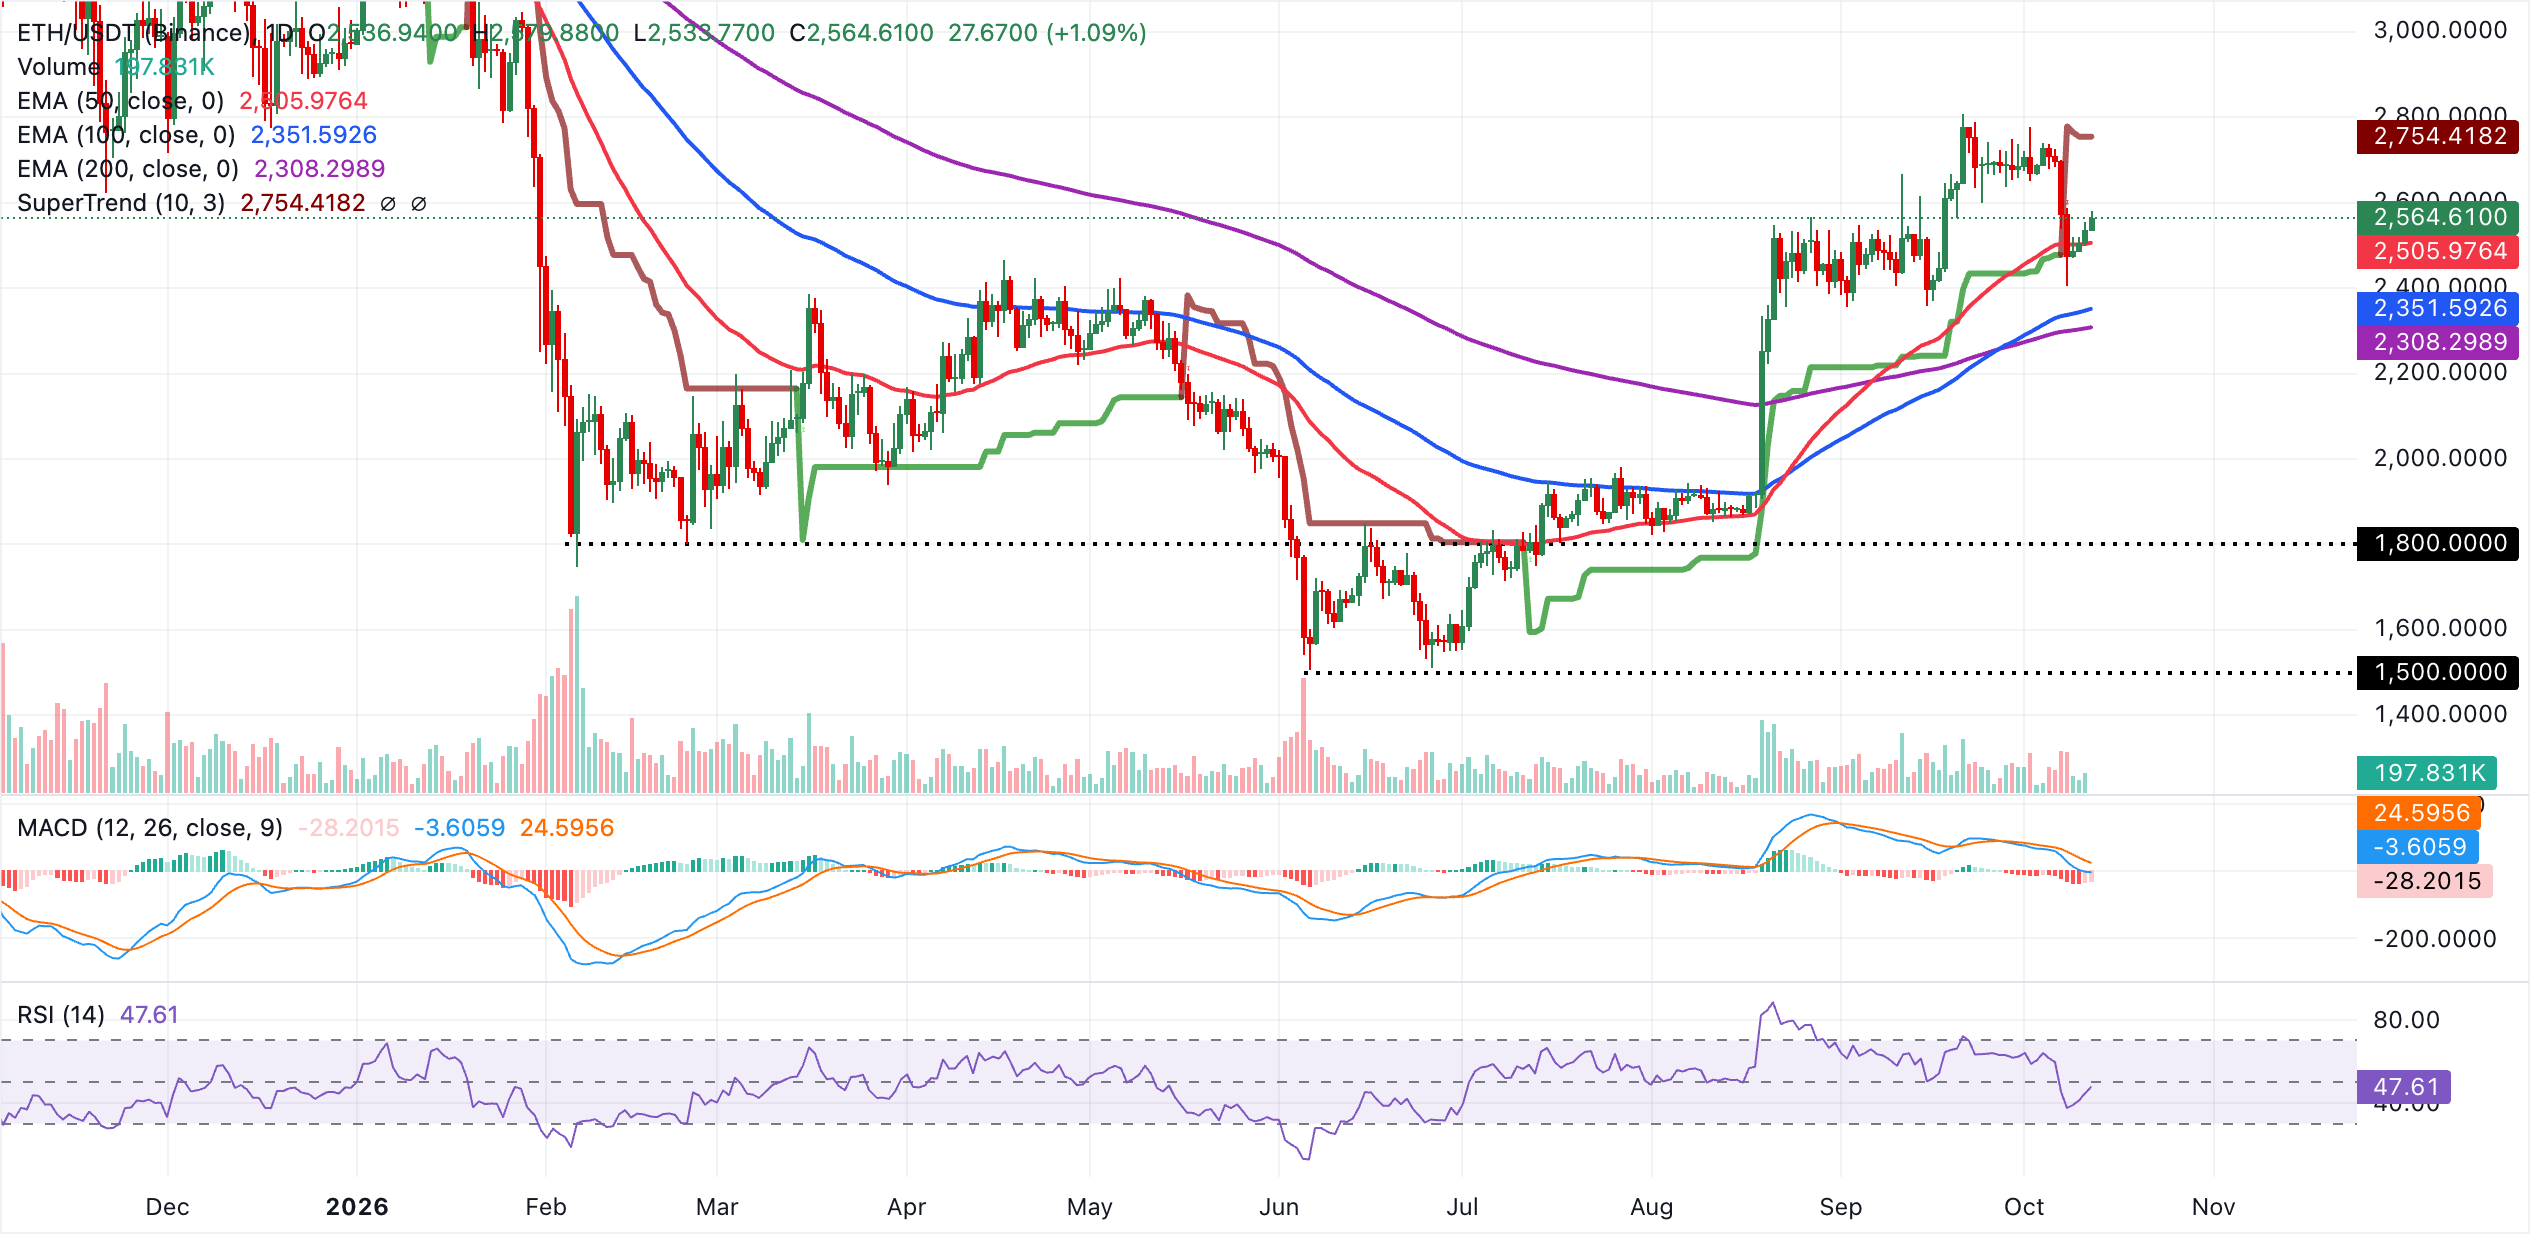
Immediate resistance is defined by the SuperTrend line at $2,754, and a daily close above this level would strengthen the bullish bias and open the way for a more decisive recovery. On the downside, initial support is near $2,565, with stronger demand expected at the 50-day EMA at $2,506. A break below would expose the 100-day EMA at $2,352 and then the 200-day EMA at $2,308 as deeper, though still supportive, levels within the broader uptrend.
XRP, meanwhile, trades near $1.41, signaling growing sell-side pressure and a weakening technical structure. Despite the headwinds, the pair holds a constructive near-term bias as price trades above the 50-day EMA at $1.40 and remains well supported by the 200-day EMA at $1.38 and the 100-day EMA at $1.34.
The SuperTrend indicator, rising and sitting around $1.30, reinforces the broader bullish structure, even as momentum has cooled, with the RSI hovering near 45 and the MACD line in negative territory, hinting at a mild loss of upside drive rather than a full trend reversal.
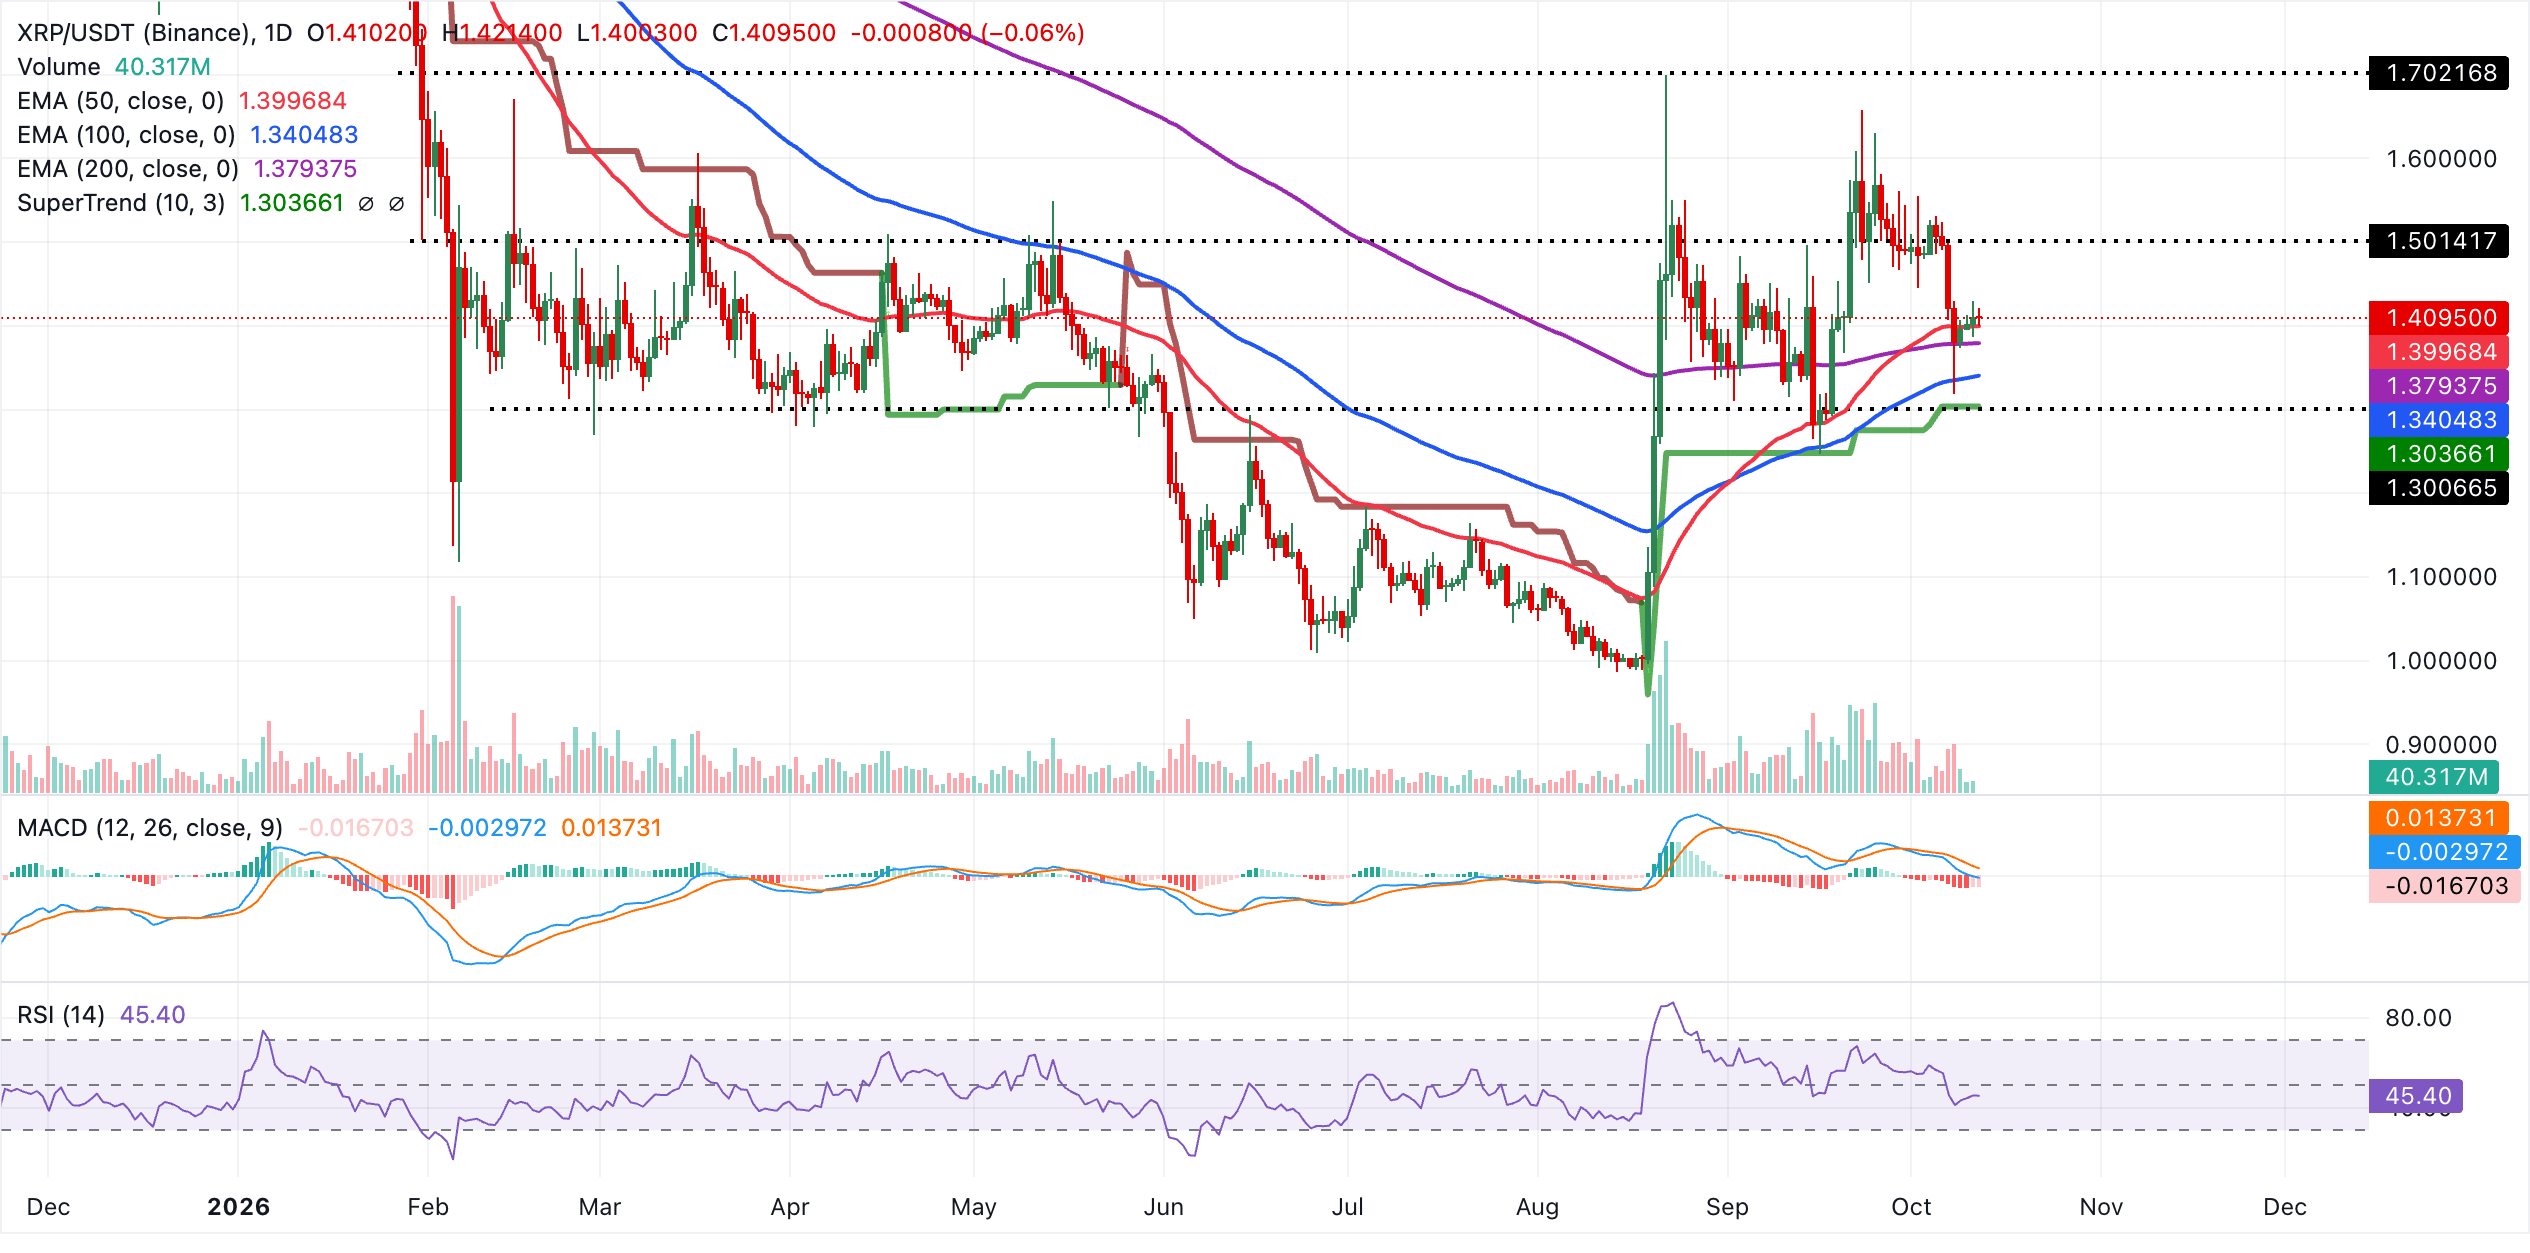
Immediate support lies just under the market price at the 50-day EMA around $1.40, followed by the 200-day EMA near $1.38, while deeper pullbacks would look to the 100-day EMA at $1.34 and the SuperTrend zone around $1.30 to attract dip-buying interest.
As long as XRP holds above these clustered moving-average and SuperTrend supports, the broader topside bias is likely to remain intact, with any consolidation above the 50-day EMA suggesting scope for another attempt to extend the recent advance once momentum stabilizes.
(The technical analysis of this story was written with the help of an AI tool. Know more.)
Crypto ETF FAQs
An Exchange-Traded Fund (ETF) is an investment vehicle or an index that tracks the price of an underlying asset. ETFs can not only track a single asset, but a group of assets and sectors. For example, a Bitcoin ETF tracks Bitcoin’s price. ETF is a tool used by investors to gain exposure to a certain asset.
Yes. The first Bitcoin futures ETF in the US was approved by the US Securities & Exchange Commission in October 2021. A total of seven Bitcoin futures ETFs have been approved, with more than 20 still waiting for the regulator’s permission. The SEC says that the cryptocurrency industry is new and subject to manipulation, which is why it has been delaying crypto-related futures ETFs for the last few years.
Yes. The SEC approved in January 2024 the listing and trading of several Bitcoin spot Exchange-Traded Funds, opening the door to institutional capital and mainstream investors to trade the main crypto currency. The decision was hailed by the industry as a game changer.
The main advantage of crypto ETFs is the possibility of gaining exposure to a cryptocurrency without ownership, reducing the risk and cost of holding the asset. Other pros are a lower learning curve and higher security for investors since ETFs take charge of securing the underlying asset holdings. As for the main drawbacks, the main one is that as an investor you can’t have direct ownership of the asset, or, as they say in crypto, “not your keys, not your coins.” Other disadvantages are higher costs associated with holding crypto since ETFs charge fees for active management. Finally, even though investing in ETFs reduces the risk of holding an asset, price swings in the underlying cryptocurrency are likely to be reflected in the investment vehicle too.
추천 기사


