

WTI Crude Oil stalls below $98.00 with Iran peace hopes still alive
- WTI Oil Prices jumped at the Asian session opening, but have stalled below $98.00.
- US's will to blockade the Strait of Hormuz is providing support to Crude prices.
- The price of the WTI barrel remains $10 below last week's highs above $106.00.
Oil prices jumped on Monday following the failure of the peace talks between the US and Iran and the US pledge to block the Strait of Hormuz. The Price of the US benchmark West Texas Intermediate (WTI), however, remains halfway through April’s range, and about $10 below last week's highs of $106.73.
US President Donald Trump announced on Truth Social that he ordered the US military to block any vessel trying to enter or leave Iranian ports, from Monday at 10:00 Easter Time (14:00 GMT). This measure is mainly aimed to put preassure on China, which has been the main recipient of Iranian Oil since the Revolutionary Guard closed a key waterway for 20% of the global Oil supply.
The peace talks held in Pakistan last weekend ended without agreement, but the two-week ceasefire remains in place, and according to Trump, “holding well”. This is feeding hopes of another round of negotiations, which, so far, is keeping risk aversion limited and WTI prices below the key $100.00 level.
Technical Analysis
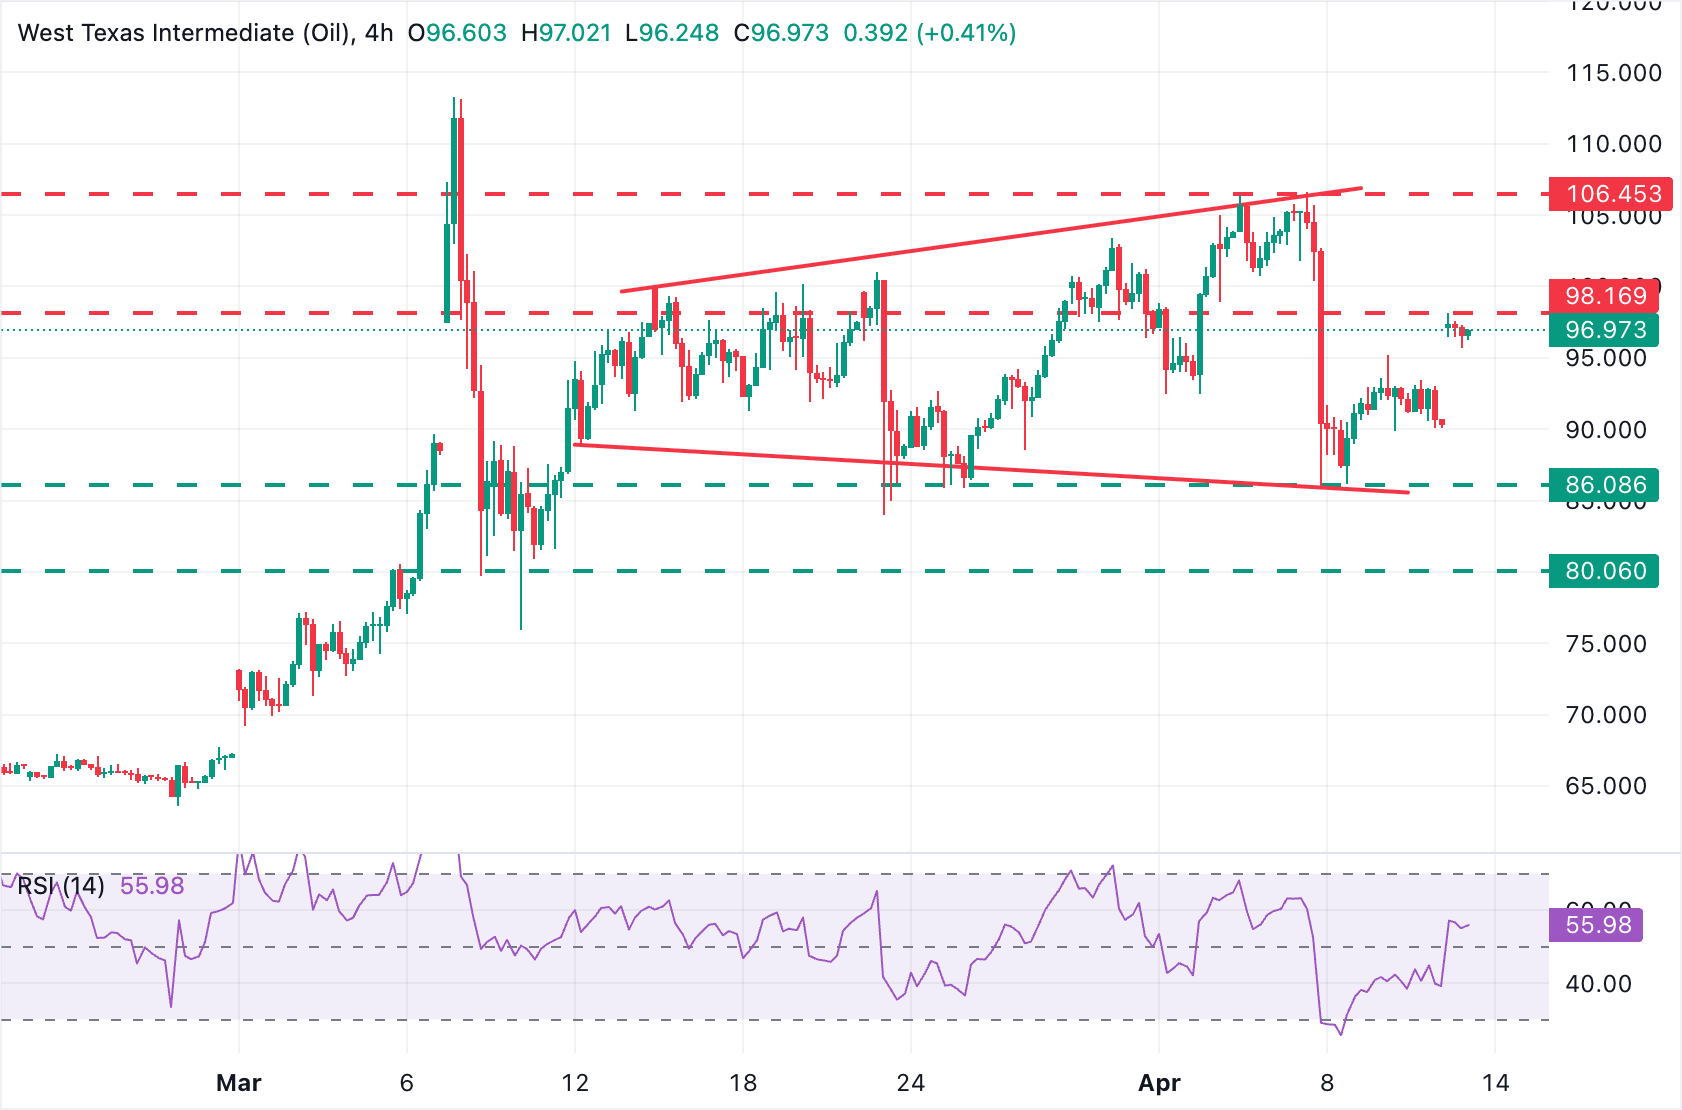
WTI US Oil trades at $96.79 at the time of writing, maintaining a bullish near-term bias. The 4-hour Relative Strength Index (RSI) sits in positive territory above 50, and the Moving Average Convergence Divergence (MACD) line has crossed above the Signal line with the histogram in green, which suggests that bullish momentum is intact.
Price action, however, is forming an expanding wedge, a pattern reflecting an emotional market that often occurs at major tops.
Bulls have been capped at the $98.00 area on Monday, below the mentioned top at $106.73 high seen on April 7, and the top of the wedge, now around $108.00.
On the downside, a bearish reversal is likely to be tested at Friday's highs, near $95.00 are likely to test bears, although the key support area is the confluence of the March 23, 25, and April 7 lows with the bottom of the wedge, between $84.00 and $86.00.
(The technical analysis of this story was written with the help of an AI tool.)
WTI Oil FAQs
WTI Oil is a type of Crude Oil sold on international markets. The WTI stands for West Texas Intermediate, one of three major types including Brent and Dubai Crude. WTI is also referred to as “light” and “sweet” because of its relatively low gravity and sulfur content respectively. It is considered a high quality Oil that is easily refined. It is sourced in the United States and distributed via the Cushing hub, which is considered “The Pipeline Crossroads of the World”. It is a benchmark for the Oil market and WTI price is frequently quoted in the media.
Like all assets, supply and demand are the key drivers of WTI Oil price. As such, global growth can be a driver of increased demand and vice versa for weak global growth. Political instability, wars, and sanctions can disrupt supply and impact prices. The decisions of OPEC, a group of major Oil-producing countries, is another key driver of price. The value of the US Dollar influences the price of WTI Crude Oil, since Oil is predominantly traded in US Dollars, thus a weaker US Dollar can make Oil more affordable and vice versa.
The weekly Oil inventory reports published by the American Petroleum Institute (API) and the Energy Information Agency (EIA) impact the price of WTI Oil. Changes in inventories reflect fluctuating supply and demand. If the data shows a drop in inventories it can indicate increased demand, pushing up Oil price. Higher inventories can reflect increased supply, pushing down prices. API’s report is published every Tuesday and EIA’s the day after. Their results are usually similar, falling within 1% of each other 75% of the time. The EIA data is considered more reliable, since it is a government agency.
OPEC (Organization of the Petroleum Exporting Countries) is a group of 12 Oil-producing nations who collectively decide production quotas for member countries at twice-yearly meetings. Their decisions often impact WTI Oil prices. When OPEC decides to lower quotas, it can tighten supply, pushing up Oil prices. When OPEC increases production, it has the opposite effect. OPEC+ refers to an expanded group that includes ten extra non-OPEC members, the most notable of which is Russia.
추천 기사


