
Gold retreats from record $3,508 as US Dollar and yields rebound
- Gold retreats after a record peak at $3,508 as the US Dollar and Treasury yields rebound.
- Safe-haven demand underpins downside as investors hedge against trade policy uncertainty, Fed independence concerns, and geopolitical tensions.
- Technical outlook stays bullish as momentum holds despite overbought RSI, with key support at $3,470/$3,450 and resistance at $3,500/$3,508.
Gold (XAU/USD) retreats on Tuesday after briefly surging to a fresh all-time high of $3,508 per ounce during the Asian session as a rebound in the US Dollar (USD) and Treasury yields triggered mild profit-taking.
At the time of writing, the precious metal is trading near $3,485 at the start of the American session, extending a six-day winning streak. Despite the short correction, underlying demand remains strong on the back of safe-haven flows and expectations that the Federal Reserve (Fed) will lower the interest rates at its September 16-17 monetary policy meeting.
The metal’s rally to record highs has been driven by persistent weakness in the Greenback, concerns over the Fed’s independence following political criticism, and heightened geopolitical risks. Uncertainty over global trade policy, particularly around US tariffs, has also boosted demand for Gold as a hedge against economic and political instability. Investors continue to favor bullion in an environment where both growth risks and monetary easing prospects dominate the outlook.
Looking ahead, attention turns to the US ISM Manufacturing Purchasing Managers Index (PMI) for August, due later on Tuesday. The index is expected to edge up to 49.0 from 48.0 in July, though it would remain below the 50 threshold, signaling ongoing contraction in the factory sector. While the report is not the Fed’s primary policy gauge, it often provides timely insights into demand conditions and price pressures. A weaker print would likely reinforce expectations for a September rate cut, supporting Gold, whereas a stronger reading could further buoy the US Dollar and Treasury yields, tempering Bullion’s upside in the near term.
Market movers: DXY rebounds, yields climb as UK Gilt turmoil fuels global bond sell-off
- The US Dollar Index (DXY), which tracks the Greenback against a basket of six major currencies, rebounds sharply from near one-month lows to a four-day high, reclaiming the 98.00 level. The Greenback recovered across the board with the DXY index hovering around 98.40, up nearly 0.70% on the day, supported by a surge in US Treasury yields as the global bond sell-off, led by UK Gilts, spills over into American debt markets.
- US Treasury yields climb across the curve, extending their advance for a second straight session. The benchmark 10-year yield rose by 5 basis points to 4.28%, while the 30-year yield added 4 bps to 4.97%, marking their highest levels since July. Inflation-protected securities also moved higher, with the 10-year TIPS yield edging up to 1.86%.
- UK Gilt turmoil sparks global bond sell-off, with yields on Britain’s long-dated government bonds soaring to multi-decade highs on fears over rising deficits and weak fiscal credibility. The sharp move in Gilts spilled into European and US debt markets, forcing investors to demand higher returns for holding government bonds. This wave of selling has pushed US Treasury yields higher and, in turn, boosted the Dollar, as markets brace for what some analysts call a “new era of fiscal dominance,” where heavy government borrowing increasingly limits central banks’ ability to steer interest rates independently.
- Over the weekend, a federal appeals court ruled that most of US President Donald Trump’s global tariffs were unlawful under the International Emergency Economic Powers Act (IEEPA), though they remain in place pending appeal. Despite the ruling, the tariffs remain in effect through at least mid-October while the administration prepares an appeal to the Supreme Court.
- Speaking on Monday, US Treasury Secretary Scott Bessent voiced confidence that the Supreme Court will uphold President Trump’s use of the 1977 International Emergency Economic Powers Act to impose broad tariffs. He said the administration is preparing a legal brief stressing the need to address long-standing trade imbalances and combat fentanyl imports, while also noting that a contingency plan is in place should the IEEPA defense fail.
- Alongside the headline ISM Manufacturing PMI, markets will also parse the Employment, New Orders, and Prices Paid sub-indices for fresh signals on labor demand, factory momentum, and inflation pressures, with traders bracing for Friday’s Nonfarm Payrolls (NFP) report as the key driver for September interest rate cut expectations.
- According to the CME FedWatch Tool, markets are pricing in a 91% probability of a 25-basis-point rate cut at the Fed’s September 16-17 meeting, even as sticky inflation pressure complicates the policy outlook. Investors remain convinced the Fed will deliver easing, but Friday’s Nonfarm Payrolls (NFP) report will be pivotal in determining whether a more aggressive cut remains on the table.
Technical analysis: Gold rally pauses below $3,500; RSI overbought but upside bias intact
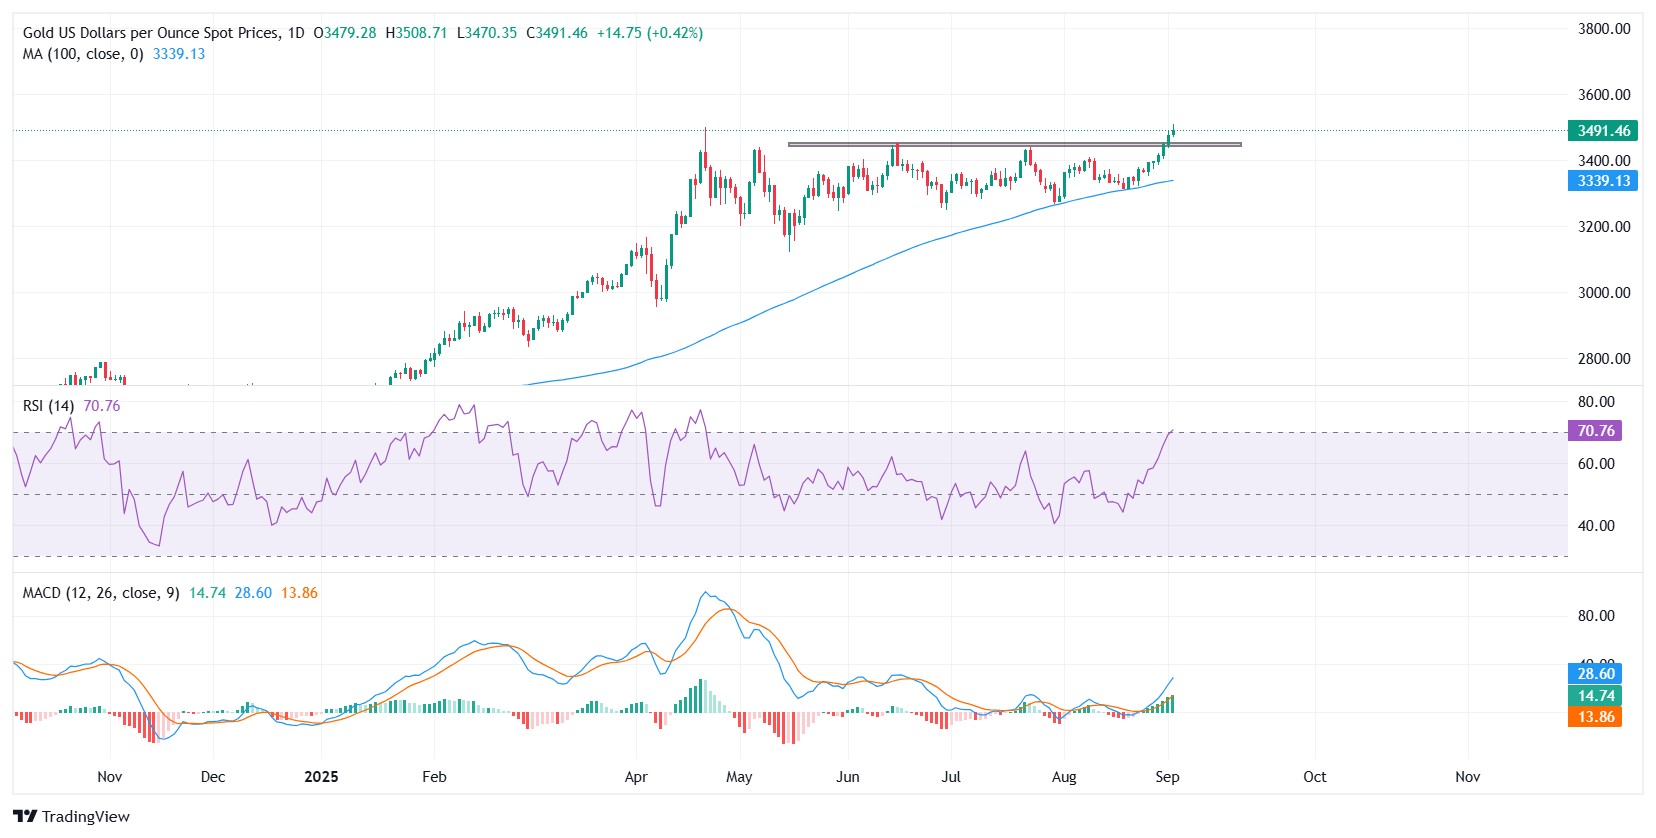
Gold extended its rally to a fresh all-time high at $3,508, breaking decisively above the $3,450 resistance zone that had capped price action in recent months. At the time of writing, the metal is consolidating near $3,485, holding gains above the breakout region with bulls maintaining control.
The Relative Strength Index (RSI) sits at 70, edging into overbought territory. This suggests upside momentum remains firm, though the risk of short-term consolidation or profit-taking has increased. Meanwhile, the Moving Average Convergence Divergence (MACD) maintains a firm positive crossover with the widening gap between the MACD and signal lines showing strengthening upside momentum. The increasing green histogram bars further confirm accelerating buying pressure, reinforcing the case for continued gains as long as Gold holds above near-term support.
On the upside, immediate support is seen at $3,470, followed by stronger backing at $3,450, the former breakout zone. A sustained move below this area could expose the $3,430–$3,400 region, where deeper pullbacks may attract fresh buying interest. On the upside, resistance is aligned at $3,500, with the all-time high at $3,508 serving as the next key hurdle.
US Dollar Price Today
The table below shows the percentage change of US Dollar (USD) against listed major currencies today. US Dollar was the strongest against the British Pound.
| USD | EUR | GBP | JPY | CAD | AUD | NZD | CHF | |
|---|---|---|---|---|---|---|---|---|
| USD | 0.68% | 1.40% | 1.12% | 0.34% | 0.84% | 0.96% | 0.55% | |
| EUR | -0.68% | 0.70% | 0.45% | -0.33% | 0.21% | 0.28% | -0.13% | |
| GBP | -1.40% | -0.70% | -0.26% | -1.02% | -0.51% | -0.41% | -0.82% | |
| JPY | -1.12% | -0.45% | 0.26% | -0.76% | -0.28% | -0.13% | -0.51% | |
| CAD | -0.34% | 0.33% | 1.02% | 0.76% | 0.47% | 0.65% | 0.21% | |
| AUD | -0.84% | -0.21% | 0.51% | 0.28% | -0.47% | 0.09% | -0.32% | |
| NZD | -0.96% | -0.28% | 0.41% | 0.13% | -0.65% | -0.09% | -0.41% | |
| CHF | -0.55% | 0.13% | 0.82% | 0.51% | -0.21% | 0.32% | 0.41% |
The heat map shows percentage changes of major currencies against each other. The base currency is picked from the left column, while the quote currency is picked from the top row. For example, if you pick the US Dollar from the left column and move along the horizontal line to the Japanese Yen, the percentage change displayed in the box will represent USD (base)/JPY (quote).
추천 기사


