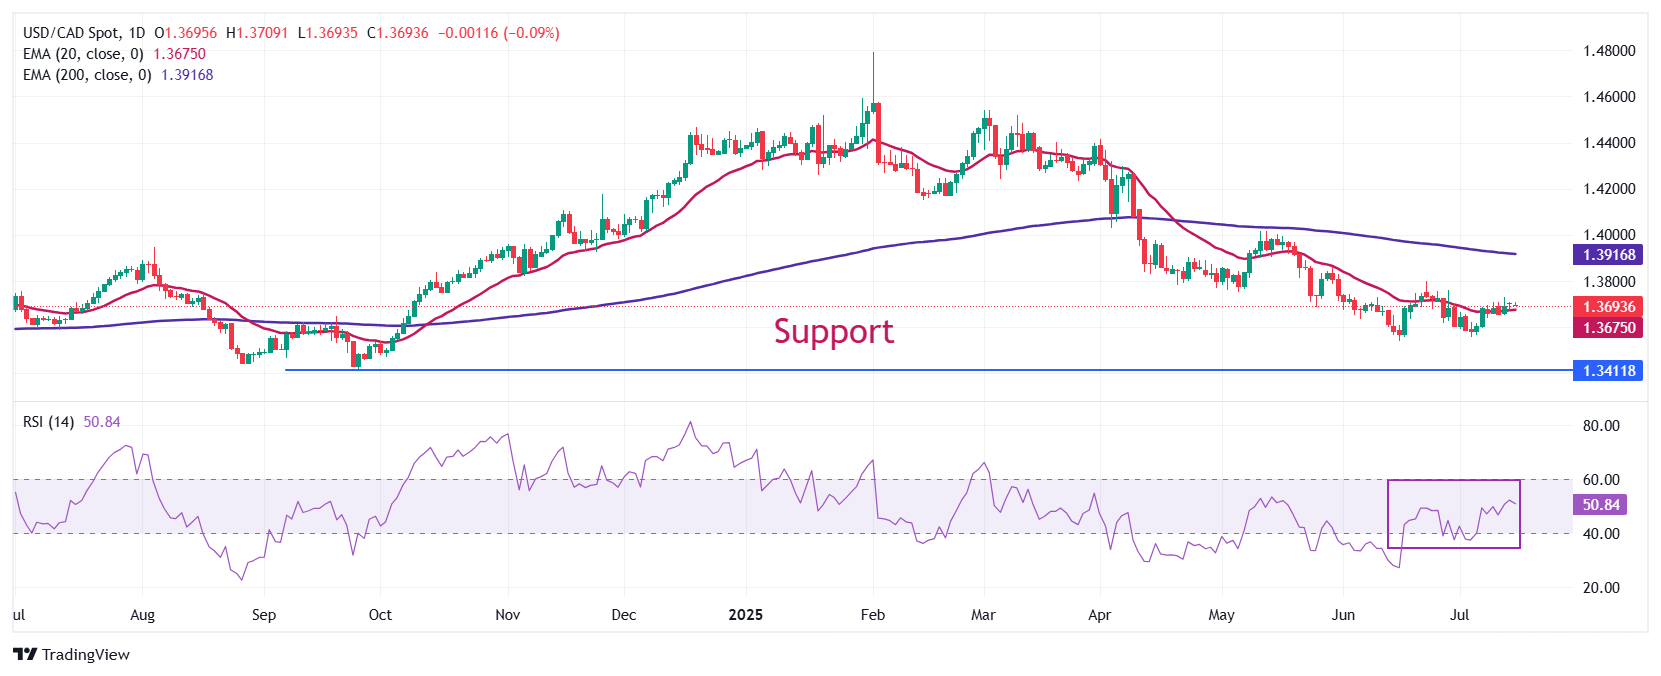
USD/CAD Price Forecast: Holds breath above 20-day EMA ahead of US-Canada CPI data
- USD/CAD flattens around 1.3700 as investors await the US-Canada CPI data for June.
- Inflation in both the US and Canada is expected to have grown at a faster rate on year.
- Downward-sloping 200-day EMA suggests that the overall trend is bearish.
The USD/CAD pair trades broadly stable near 1.3700 during the late Asian trading session on Tuesday. The Loonie pair is expected to remain almost flat as investors await the release of the Consumer Price Index (CPI) data for June from both the United States (US) and Canada, which will be published at 12:30 GMT.
At the time of writing, the US Dollar Index (DXY), which tracks the Greenback’s value against six major currencies, trades calmly near the three-week high around 98.00.
Investors expect the US inflation to have grown at a faster pace, with headline and core CPI seen accelerating to 2.7% and 3.0%, respectively. Theoretically, a high-inflation environment often leads to the maintenance of a restrictive monetary policy stance by the Federal Reserve (Fed). However, US President Donald Trump has been arguing in favor of reducing interest rates significantly.
"We should be at 1%. We should be less than 1%," Trump said on Monday, Fox Business reported.
Meanwhile, the Canadian CPI is estimated to have grown by 1.9% on year, faster than 1.7% in May. On month, price pressures are expected to have risen moderately by 0.1%, compared to a 0.6% growth seen in May.
USD/CAD continues to trade in a range between 1.3638 and 1.3710 over the past week. The pair wobbles around the 20-day Exponential Moving Average (EMA), which trades close to 1.3675, suggesting that the near-term trend is sideways. However, the broader trend remains bearish as the 200-day EMA slopes downwards to near 1.3917.
The 14-day Relative Strength Index (RSI) hovers around 50.00, indicating that the pair lacks momentum on either side.
Going forward, an upside move by the pair above the May 29 high of 1.3820 would open the door towards the May 21 high of 1.3920, followed by the May 15 high of 1.4000.
On the contrary, the asset could slide towards the psychological level of 1.3500 and the September 25 low of 1.3420 if it breaks below the June 16 low of 1.3540.
USD/CAD daily chart

lacks
Inflation FAQs
Inflation measures the rise in the price of a representative basket of goods and services. Headline inflation is usually expressed as a percentage change on a month-on-month (MoM) and year-on-year (YoY) basis. Core inflation excludes more volatile elements such as food and fuel which can fluctuate because of geopolitical and seasonal factors. Core inflation is the figure economists focus on and is the level targeted by central banks, which are mandated to keep inflation at a manageable level, usually around 2%.
The Consumer Price Index (CPI) measures the change in prices of a basket of goods and services over a period of time. It is usually expressed as a percentage change on a month-on-month (MoM) and year-on-year (YoY) basis. Core CPI is the figure targeted by central banks as it excludes volatile food and fuel inputs. When Core CPI rises above 2% it usually results in higher interest rates and vice versa when it falls below 2%. Since higher interest rates are positive for a currency, higher inflation usually results in a stronger currency. The opposite is true when inflation falls.
Although it may seem counter-intuitive, high inflation in a country pushes up the value of its currency and vice versa for lower inflation. This is because the central bank will normally raise interest rates to combat the higher inflation, which attract more global capital inflows from investors looking for a lucrative place to park their money.
Formerly, Gold was the asset investors turned to in times of high inflation because it preserved its value, and whilst investors will often still buy Gold for its safe-haven properties in times of extreme market turmoil, this is not the case most of the time. This is because when inflation is high, central banks will put up interest rates to combat it. Higher interest rates are negative for Gold because they increase the opportunity-cost of holding Gold vis-a-vis an interest-bearing asset or placing the money in a cash deposit account. On the flipside, lower inflation tends to be positive for Gold as it brings interest rates down, making the bright metal a more viable investment alternative.


