


USD/CAD steadies as traders digest mixed US Retail Sales data ahead of the Fed
- USD/CAD trades near 1.3575 as markets digest a mixed US Retail Sales ahead of Wednesday’s Fed rate decision.
- Elevated Oil prices and geopolitical risks in the Middle East limit losses for the Canadian Dollar.
- USD/CAD remains in a descending wedge, while the Relative Strength Index signals a pause in bearish momentum.
The Canadian Dollar (CAD) is holding its ground against the US Dollar (USD) on Tuesday, with USD/CAD moving sideways near 1.3575.
Mixed signals from the latest US Retail Sales data and escalating tensions in the Middle East on Tuesday continue to keep traders cautious as the Federal Reserve’s (Fed) policy meeting looms.
The pair is struggling to find direction after falling to an eight-month low on Monday, with markets shifting their focus toward the upcoming Federal Open Market Committee (FOMC) decision and any new headlines emerging from the Persian Gulf.
While Oil prices remain elevated, supporting the CAD through its commodity link, recent US data and monetary policy signals stay front and center.
Retail Sales provide mixed signals on Consumer Spending trends
The release of US Retail Sales on Tuesday has provided a mixed picture. Headline figures declined by 0.9% in May, missing market expectations of a 0.7% decline and marking the steepest drop since early 2024. Sales excluding autos also fell by 0.3%, pointing to broad-based softness in consumer activity.
However, the control group, which strips out volatile categories and feeds directly into the calculation of Gross Domestic Product (GDP), rose by 0.4%, indicating a strong rebound from April’s -0.1% and a sign that core consumption remains resilient.
For the Federal Reserve, the report presents a mixed picture. A decline in the headline number strengthens the case for keeping rates steady and possibly easing later in the year. However, the firm control group suggests that the economy is still resilient, reducing the urgency for rate cuts.
From a broader perspective, the Israel-Iran conflict is intensifying, threatening the security of the Strait of Hormuz—a critical chokepoint for global Oil supply.
Since the CAD is a commodity-linked currency, elevated Oil prices may help limit the downside for the Loonie.
In the near term, traders will closely monitor Oil price fluctuations tied to Middle East developments and parse signals from the Fed on Wednesday. These intersecting forces are likely to shape the path of USD/CAD into the latter half of the week.
USD/CAD technical levels
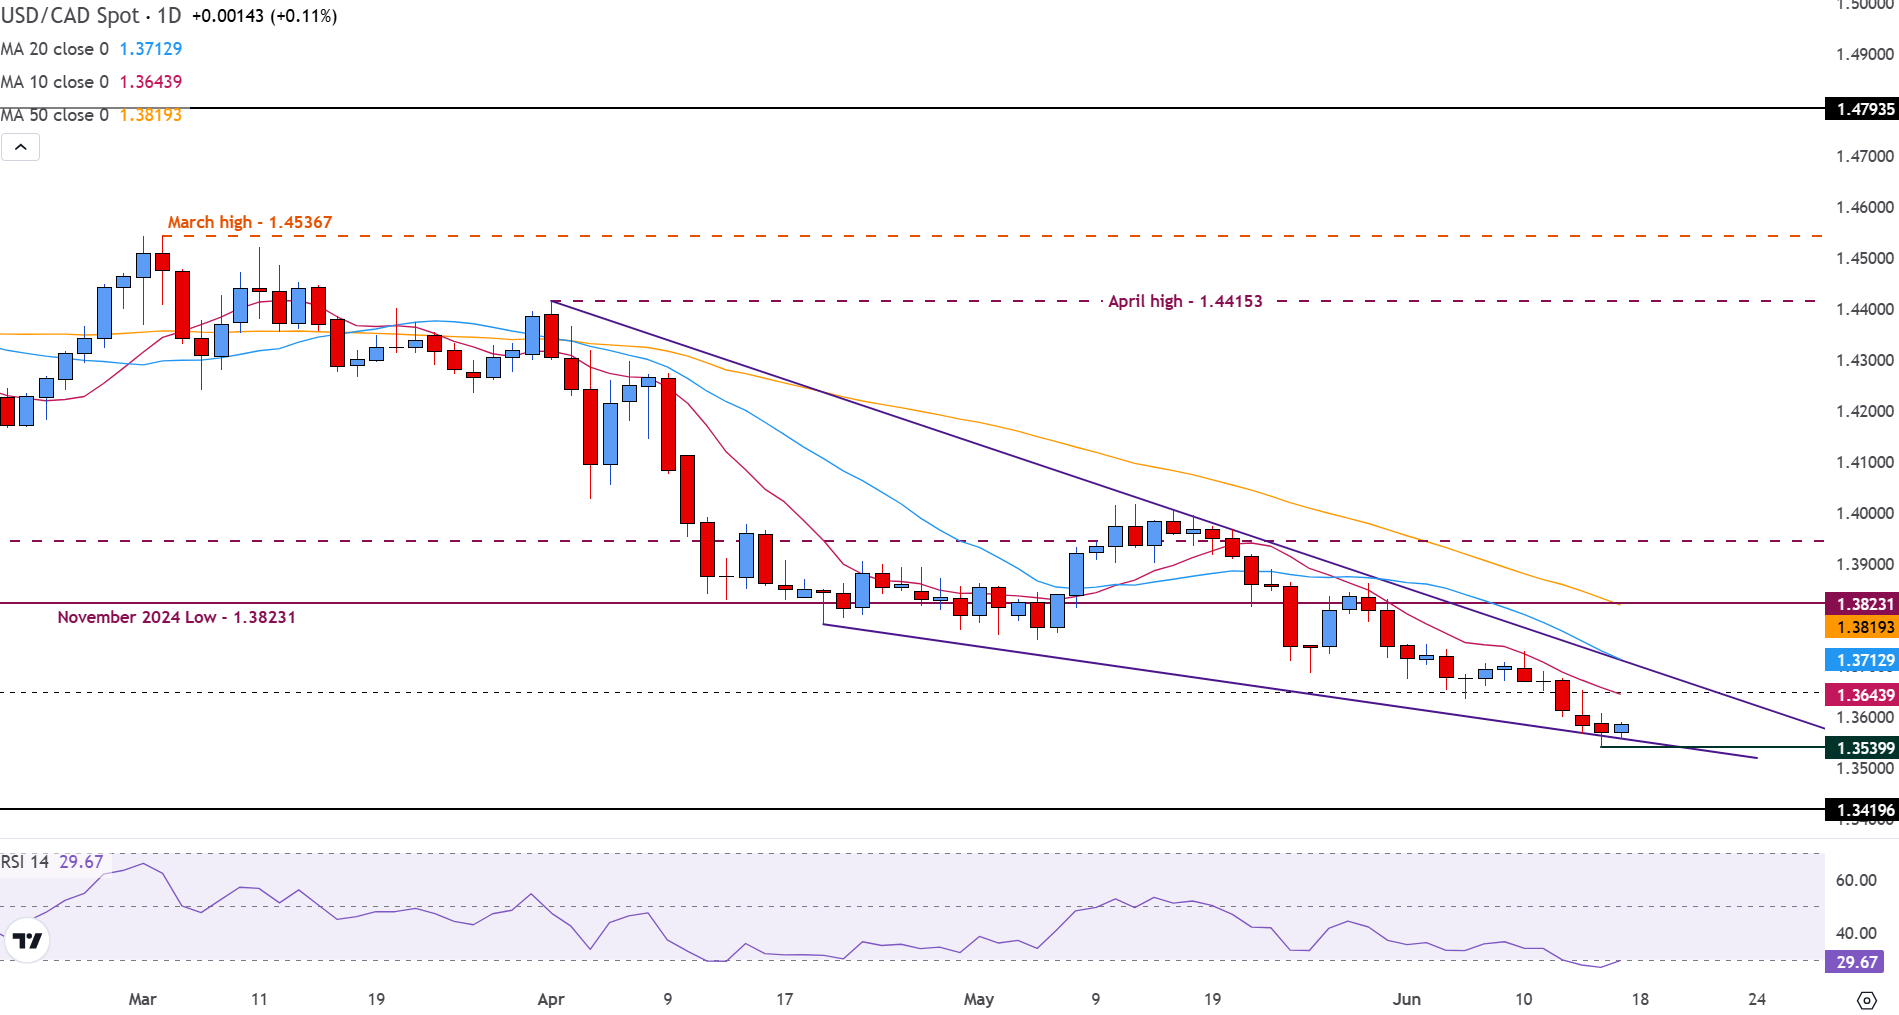
USD/CAD remains under sustained selling pressure, trading near 1.3580 and holding just above key trendline support.
Prices have continued to respect the boundaries of a descending channel, with the 10-day (1.3644), 20-day (1.3713), and 50-day (1.3819) Simple Moving Averages (SMA) sitting above the current level.
The pair briefly tested the lower bound of the channel near 1.3540, but has yet to decisively break below it.
A close beneath this level could open the door toward the November 2024 low of 1.3419. Meanwhile, the Relative Strength Index (RSI) hovers at 29 and is pointing higher, indicating that bullish momentum may be losing steam.
If the US Dollar strengthens, this could risk a short-term consolidation or a technical rebound toward resistance at 1.3640–1.3710 in the near term.
USD/CAD daily chart
US Dollar FAQs
The US Dollar (USD) is the official currency of the United States of America, and the ‘de facto’ currency of a significant number of other countries where it is found in circulation alongside local notes. It is the most heavily traded currency in the world, accounting for over 88% of all global foreign exchange turnover, or an average of $6.6 trillion in transactions per day, according to data from 2022. Following the second world war, the USD took over from the British Pound as the world’s reserve currency. For most of its history, the US Dollar was backed by Gold, until the Bretton Woods Agreement in 1971 when the Gold Standard went away.
The most important single factor impacting on the value of the US Dollar is monetary policy, which is shaped by the Federal Reserve (Fed). The Fed has two mandates: to achieve price stability (control inflation) and foster full employment. Its primary tool to achieve these two goals is by adjusting interest rates. When prices are rising too quickly and inflation is above the Fed’s 2% target, the Fed will raise rates, which helps the USD value. When inflation falls below 2% or the Unemployment Rate is too high, the Fed may lower interest rates, which weighs on the Greenback.
In extreme situations, the Federal Reserve can also print more Dollars and enact quantitative easing (QE). QE is the process by which the Fed substantially increases the flow of credit in a stuck financial system. It is a non-standard policy measure used when credit has dried up because banks will not lend to each other (out of the fear of counterparty default). It is a last resort when simply lowering interest rates is unlikely to achieve the necessary result. It was the Fed’s weapon of choice to combat the credit crunch that occurred during the Great Financial Crisis in 2008. It involves the Fed printing more Dollars and using them to buy US government bonds predominantly from financial institutions. QE usually leads to a weaker US Dollar.
Quantitative tightening (QT) is the reverse process whereby the Federal Reserve stops buying bonds from financial institutions and does not reinvest the principal from the bonds it holds maturing in new purchases. It is usually positive for the US Dollar.
추천 기사


