


USDCAD slips below 1.3650 as US jobless claims rise, Canada’s PMI contract
- Canadian Dollar boosted by Greenback’s weakness as US jobless claims jump to 247K
- Canada’s Ivey PMI contracts for second month, but trade deficit widens sharply on plunging exports.
- Market focus shifts to NFP and Canadian jobs data; US expected to add 130K, Canada seen losing 12.5K jobs.
USD/CAD extended its losses on Thursday amid a busy schedule on both sides of the border, with US unemployment benefits data coming in above forecasts. At the same time, Canada’s Ivey PMI shows that business activity contracted for the second straight month. At the time of writing, the pair is down 0.22% at 1.3646.
Loonie edges higher despite weak domestic data, as traders await Friday’s US and Canadian labor market reports
The US Bureau of Labor Statistics (BLS) rose to 247K exceeding the previous week reading of 240K, up from forecasts of 235K. The data followed a dismal ADP Employment Change report that showed that companies added just 37K people to the workforce in May, revealed on Wednesday.
At the same time, the US trade deficit narrowed in April, according to the US Department of Commerce.
In Canada, May’s Ivey PMI shrank for the second straight month, though improved from 47.9 to 48.9. Earlier, Statistics Canada revealed that the Trade Balance deficit widened from -0.51 billion to -7.14 billion, as exports plunged 10.8% in April its lowest level since June 2023.
Traders’ investors turn to Friday’s US Nonfarm Payrolls figures and Canada’s Employment Change. The former is expected to show the economy added 130K jobs in May. Canada’s economy is projected to shed 12.5K jobs from the workforce.
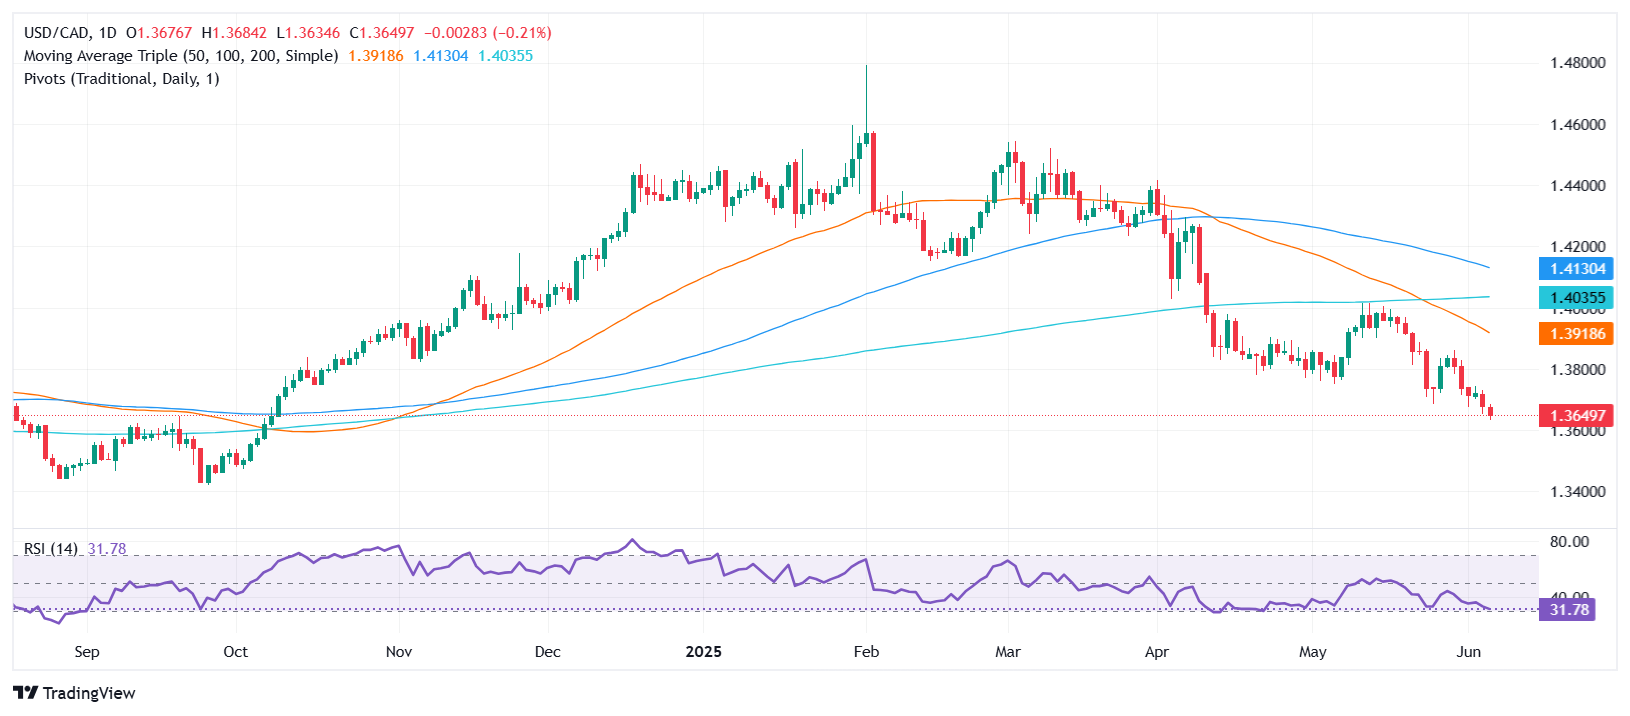
USD/CAD Price Forecast: Technical outlook
The USD/CAD has fallen to yearly lows of 1.3633 amid uncertainties regarding the US trade policies. Although recent news emerged that Trump and Xi’s call was a positive and improved mood, investors are augmenting their Canadian dollar long positions.
Technically speaking, the pair is forming a bullish wedge, which suggests the USD/CAD could be poised for a breakout above the May 29 high of 1.3861. If surpassed, the pair could challenge 1.40.
Conversely, a daily close below 1.36 sets the stage for a downward move to the October 24, 2024, low of 1.3471.
Canadian Dollar PRICE This week
The table below shows the percentage change of Canadian Dollar (CAD) against listed major currencies this week. Canadian Dollar was the strongest against the US Dollar.
| USD | EUR | GBP | JPY | CAD | AUD | NZD | CHF | |
|---|---|---|---|---|---|---|---|---|
| USD | -0.93% | -0.95% | -0.24% | -0.64% | -1.37% | -1.53% | -0.41% | |
| EUR | 0.93% | -0.03% | 0.69% | 0.28% | -0.44% | -0.64% | 0.52% | |
| GBP | 0.95% | 0.03% | 0.76% | 0.31% | -0.41% | -0.60% | 0.55% | |
| JPY | 0.24% | -0.69% | -0.76% | -0.41% | -1.12% | -1.31% | -0.25% | |
| CAD | 0.64% | -0.28% | -0.31% | 0.41% | -0.71% | -0.92% | 0.24% | |
| AUD | 1.37% | 0.44% | 0.41% | 1.12% | 0.71% | -0.14% | 1.04% | |
| NZD | 1.53% | 0.64% | 0.60% | 1.31% | 0.92% | 0.14% | 1.16% | |
| CHF | 0.41% | -0.52% | -0.55% | 0.25% | -0.24% | -1.04% | -1.16% |
The heat map shows percentage changes of major currencies against each other. The base currency is picked from the left column, while the quote currency is picked from the top row. For example, if you pick the Canadian Dollar from the left column and move along the horizontal line to the US Dollar, the percentage change displayed in the box will represent CAD (base)/USD (quote).
추천 기사


