

Silver Price Forecasts: XAG/USD dips to $59.00 amid high yields, geopolitical tensions

출처 Fxstreet
  • XAG/USD fails to hold above $60 and nears two-month lows at $59.00.
  • Precious metals are struggling amid rising Oil prices and high Treasury yields.
  • Below $59.00, bears would have the path towards the mid-$56.00s range clear.

Silver (XAG/USD) reverses on Thursday’s European session opening times, following a frail recovery attempt in Asian trading, and falls to the $59.30 area after being capped near $60.60 earlier in the day. The white metal has turned negative in the daily chart, as market sentiment deteriorates with growing tensions in the Middle East pushing Oil prices higher.

Reports of a new wave of attacks on Saudi Arabian airports by the Iran-backed Houthis have pushed the price of Brent Oil to levels above $101.50, more than 5% above Tuesday's lows. Concerns about a further escalation of hostilities in the region have also pushed shipping costs higher, altogether souring market sentiment and providing a fresh impulse to the safe-haven US Dollar.

Oil’s rally is also boosting Treasury yields across the globe, amid hopes that the higher energy prices will force the major central banks to tighten their monetary policies further. The US 10-year yield remains above 5.30%, despite a strong auction on Wednesday, and the 30-yield note pays above 5.7%, a few percentage points below 24-year highs, levels consistent with weak speculative demand for precious metals.


Technical Analysis: Support at the $59.00 area is under pressure
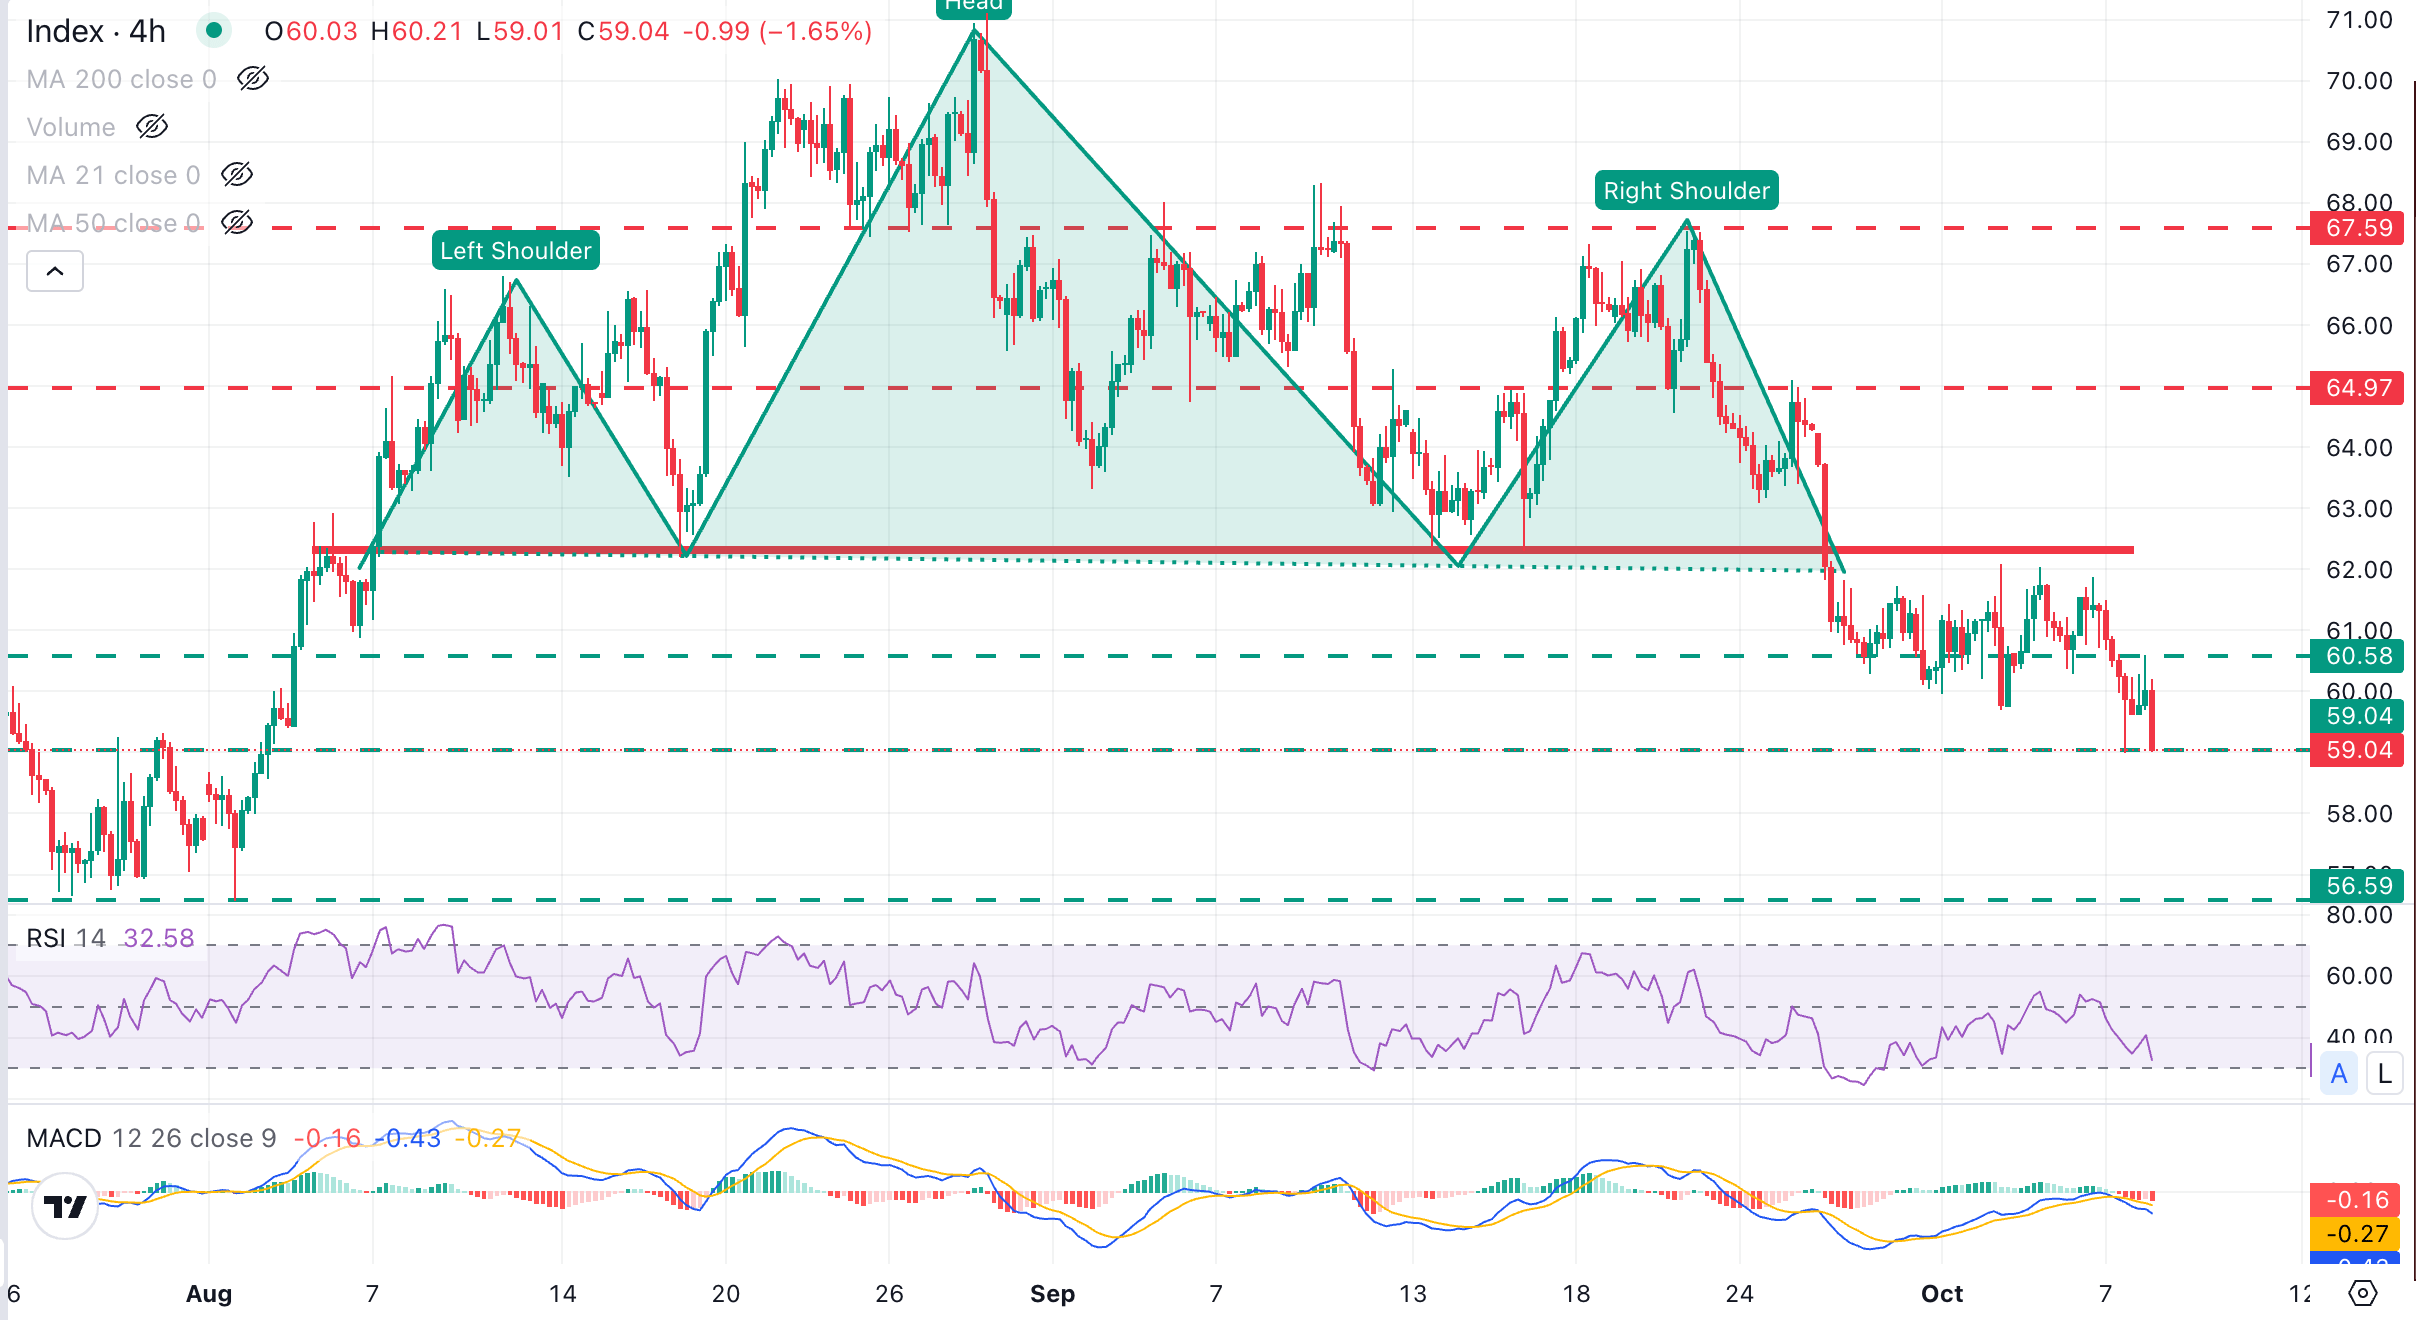
XAG/USD Chart Analysis


The XAG/USD technical picture shows the pair extending its reversal from late August highs above $70.00, with bulls capped below the neckline of a bearish Head & Shoulders pattern (H&S), leaving the door iopen for a further downleg. Momentum indicators in the 4-hour chart support this view as the Relative Strength Index (14) dips further below 35 and the Moving Average Convergence Divergence (MACD) turns negative.

Bears are aiming for the two-month low at the $59.00 area hit on Wednesday, with the next target at the late July and early August lows near $56.50. On the topside, any recovery would first need to reclaim the mentioned H&S neckline at the $62.00 area to shift the focus towards the September 25 high in the $65.00 area

(The technical analysis of this story was written with the help of an AI tool. Know more.)

면책 조항: 정보 제공 목적으로만 사용됩니다. 과거 성과가 미래 결과를 보장하지 않습니다.
placeholder
2026년 증시 ‘톱5’ 전망…AI 옥석가리기·배당주 선호·밸류에이션 조정 가능성S&P500의 3년 연속 두 자릿수 상승 이후 2026년에는 AI 옥석가리기, 섹터 로테이션, 배당주 선호, Shiller CAPE 39에 따른 밸류에이션 조정, 양자컴퓨팅 테마 급등 가능성이 핵심 변수로 거론된다.
저자  Mitrade팀
1 월 05 일 월요일
S&P500의 3년 연속 두 자릿수 상승 이후 2026년에는 AI 옥석가리기, 섹터 로테이션, 배당주 선호, Shiller CAPE 39에 따른 밸류에이션 조정, 양자컴퓨팅 테마 급등 가능성이 핵심 변수로 거론된다.
placeholder
Bitcoin(BTCUSD) 종목이 10월5일에 1.08% 상승한 이유를 확인해 보세요Bitcoin (BTCUSD) 종목은 10월5일 21:15(ET)에 1.08% 상승하여, 현재 가격은 $86721.22이고, 최근 7일간 3.84% 상승했습니다.오늘 Bitcoin(BTCUSD) 주가 상승의 요인은 무엇인가요?거시경제 전망의 변화와 지속적인 기관 수요가 디지털 자산 시장 전반을 뒷받침함에 따라 비트코인으로 자금이 유입되었다. 국채 금리 압력
저자  Mitrade팀
10 월 05 일 월요일
Bitcoin (BTCUSD) 종목은 10월5일 21:15(ET)에 1.08% 상승하여, 현재 가격은 $86721.22이고, 최근 7일간 3.84% 상승했습니다.오늘 Bitcoin(BTCUSD) 주가 상승의 요인은 무엇인가요?거시경제 전망의 변화와 지속적인 기관 수요가 디지털 자산 시장 전반을 뒷받침함에 따라 비트코인으로 자금이 유입되었다. 국채 금리 압력
placeholder
Ethereum(ETHUSD) 종목이 10월7일에 갑자기 3.13% 하락한 상황에서 무엇을 주목해야 할까요?Ethereum (ETHUSD) 종목은 10월7일 22:05(ET)에 3.13% 하락하여, 현재 가격은 $2611.59이고, 최근 7일간 2.55% 하락했습니다.오늘 Ethereum(ETHUSD) 주가 하락의 요인은 무엇인가요?이더리움은 주로 지속적인 기관 자금 유출과 미국 이더리움 현물 상장지수펀드(ETF)에서의 순상환 여파로 매도 압력을 받았다. 이들
저자  Mitrade팀
10 월 07 일 수요일
Ethereum (ETHUSD) 종목은 10월7일 22:05(ET)에 3.13% 하락하여, 현재 가격은 $2611.59이고, 최근 7일간 2.55% 하락했습니다.오늘 Ethereum(ETHUSD) 주가 하락의 요인은 무엇인가요?이더리움은 주로 지속적인 기관 자금 유출과 미국 이더리움 현물 상장지수펀드(ETF)에서의 순상환 여파로 매도 압력을 받았다. 이들
placeholder
삼성전자 3분기 이익 8배 가까이 급증해 사상 최고치 기록; SK하이닉스 1% 가까이 상승, 키옥시아 4% 가까이 상승TradingKey - 10월 8일 아시아 거래 세션에서 일본과 한국 증시는 혼조세로 출발했다. 닛케이 225 지수는 0.28% 하락한 69,840.6포인트로 장을 시작한 반면, 한국종합주가지수(코스피)는 0.07% 상승한 6,808.68포인트를 기록했다. 밤사이 미 증시가 조정을 받고 미 국채 금리가 높은 수준을 유지한 여파로 한국과 일본의 기술주는 엇갈
저자  Mitrade팀
10 월 08 일 목요일
TradingKey - 10월 8일 아시아 거래 세션에서 일본과 한국 증시는 혼조세로 출발했다. 닛케이 225 지수는 0.28% 하락한 69,840.6포인트로 장을 시작한 반면, 한국종합주가지수(코스피)는 0.07% 상승한 6,808.68포인트를 기록했다. 밤사이 미 증시가 조정을 받고 미 국채 금리가 높은 수준을 유지한 여파로 한국과 일본의 기술주는 엇갈
placeholder
닛케이 225 지수 장 초반 1% 이상 하락, 소프트뱅크 거의 7% 하락, 키옥시아 4% 이상 하락; 한국 증시 휴장TradingKey - 10월 9일 일본 증시가 장 초반 약세를 보였다. 닛케이 225 지수는 0.57% 하락한 68,648.50포인트로 개장한 후 낙폭을 1.03%로 확대해 68,330.05포인트를 기록했다. 한편 한국 증시는 휴장하여 이날 거래가 이뤄지지 않았다.출처: TradingView일본 기술주는 전반적으로 압박을 받았다. 소프트뱅크그룹이 장 초반
저자  Mitrade팀
10 월 09 일 금요일
TradingKey - 10월 9일 일본 증시가 장 초반 약세를 보였다. 닛케이 225 지수는 0.57% 하락한 68,648.50포인트로 개장한 후 낙폭을 1.03%로 확대해 68,330.05포인트를 기록했다. 한편 한국 증시는 휴장하여 이날 거래가 이뤄지지 않았다.출처: TradingView일본 기술주는 전반적으로 압박을 받았다. 소프트뱅크그룹이 장 초반
goTop
quote