


GBP/JPY Price Forecast: Recovery stalls below the 50-day SMA
- GBP/JPY trades between the 50-day and 100-day SMAs, keeping the near-term bias neutral.
- The RSI near 49 points to neutral momentum, while the MACD remains slightly bearish.
- A daily close above the 50-day SMA would improve the technical outlook.
GBP/JPY holds firm on Wednesday, trading within Monday’s range as the Japanese Yen (JPY) stays on the back foot, having given up nearly half of the gains triggered by the joint US-Japan intervention. At the time of writing, the cross trades around 215.12, virtually unchanged on the day.
However, intervention risk remains, as both Japan and the US have signalled that they could step into the currency market again if needed. Strategists at BNY Mellon characterise the Yen as remaining "an intervention/rates trade," with "higher oil prices and US Treasury yields" still acting as clear headwinds for Japan’s energy‑importing economy.
They caution that "intervention risk may deter fresh JPY shorts," but add that "persistent fiscal concerns leave little fundamental case for sustained yen appreciation" in the current environment.
Technical analysis
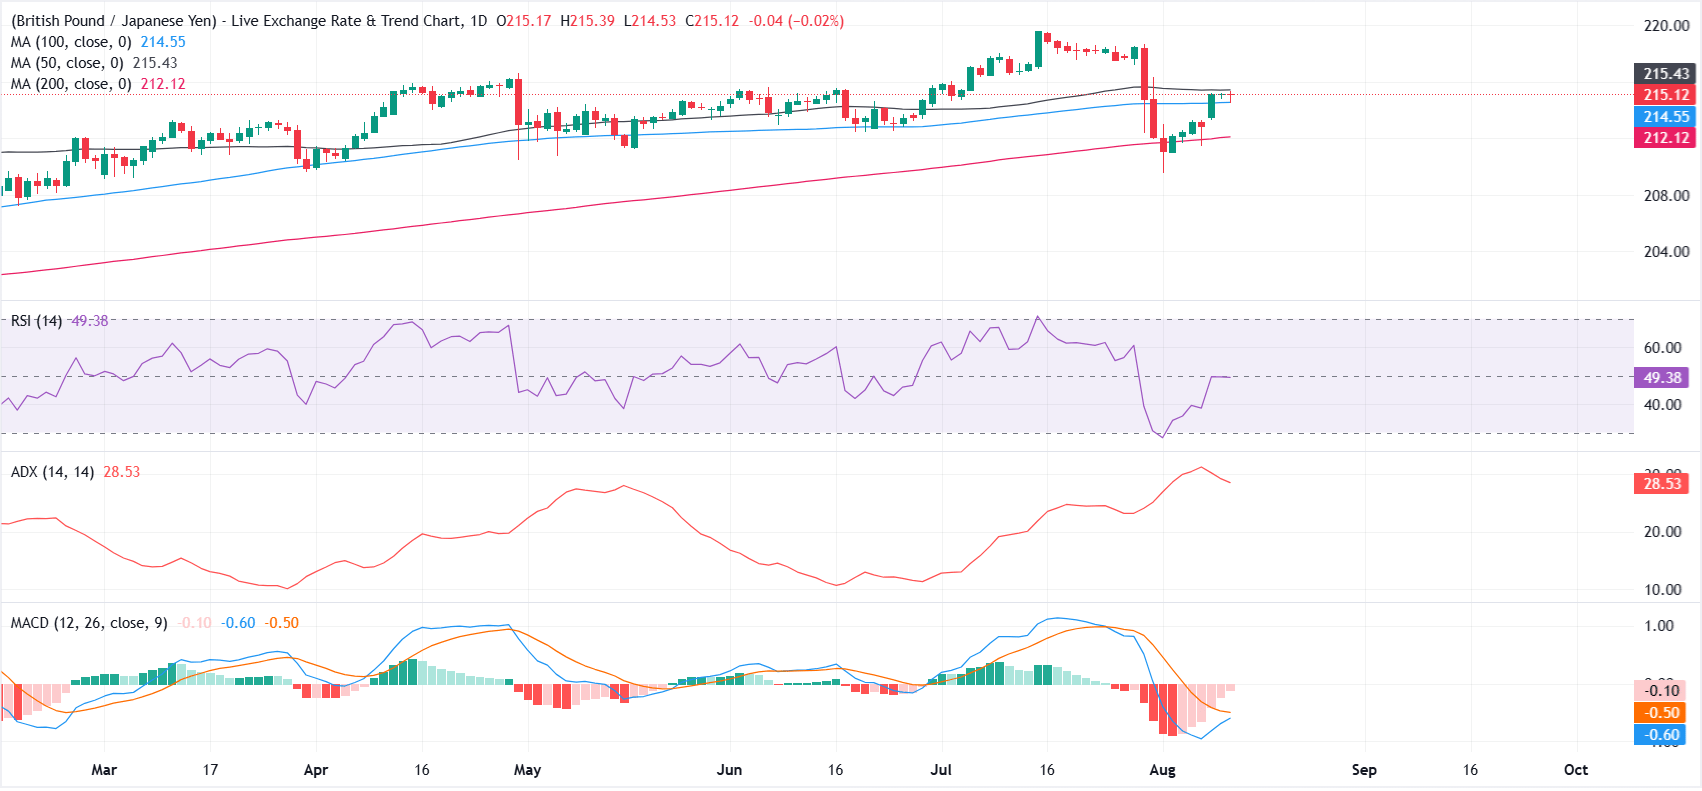
The intervention-driven sell-off pushed GBP/JPY below the 50-day, 100-day and 200-day Simple Moving Averages (SMAs) and briefly below the 210.00 psychological mark. Buyers stepped in around that level and lifted the cross back above the 200-day and 100-day SMAs.
On the daily chart, GBP/JPY holds just above the 100-day SMA near 214.50, while the 50-day SMA around 215.50 caps immediate gains. This leaves the near-term bias neutral as the pair trades between these key averages.
Momentum signals are mixed, with the Relative Strength Index (RSI) hovering near a neutral 49 and the Moving Average Convergence Divergence (MACD) indicator still slightly negative, suggesting that directional conviction is lacking despite a moderately strong Average Directional Index (ADX) reading around 28.
On the downside, a break below the 100-day SMA would expose the 200-day SMA near 212. A decisive move below this level could signal a deeper correction. On the upside, a daily close above the 50-day SMA could open the door to a continuation of the bullish move.
Japanese Yen Price Today
The table below shows the percentage change of Japanese Yen (JPY) against listed major currencies today. Japanese Yen was the strongest against the New Zealand Dollar.
| USD | EUR | GBP | JPY | CAD | AUD | NZD | CHF | |
|---|---|---|---|---|---|---|---|---|
| USD | 0.01% | -0.11% | -0.14% | 0.05% | -0.09% | 0.27% | 0.11% | |
| EUR | -0.01% | -0.12% | -0.15% | 0.03% | -0.14% | 0.24% | 0.09% | |
| GBP | 0.11% | 0.12% | -0.06% | 0.14% | -0.02% | 0.35% | 0.21% | |
| JPY | 0.14% | 0.15% | 0.06% | 0.18% | 0.03% | 0.37% | 0.24% | |
| CAD | -0.05% | -0.03% | -0.14% | -0.18% | -0.16% | 0.21% | 0.05% | |
| AUD | 0.09% | 0.14% | 0.02% | -0.03% | 0.16% | 0.36% | 0.23% | |
| NZD | -0.27% | -0.24% | -0.35% | -0.37% | -0.21% | -0.36% | -0.13% | |
| CHF | -0.11% | -0.09% | -0.21% | -0.24% | -0.05% | -0.23% | 0.13% |
The heat map shows percentage changes of major currencies against each other. The base currency is picked from the left column, while the quote currency is picked from the top row. For example, if you pick the Japanese Yen from the left column and move along the horizontal line to the US Dollar, the percentage change displayed in the box will represent JPY (base)/USD (quote).
추천 기사


