


Crypto Today: Bitcoin, Ethereum, XRP stay under pressure as focus shifts to US inflation data
- Bitcoin remains under pressure, trading below $64,000 as investors brace for the upcoming US CPI report.
- Ethereum shows mild recovery signs, edging toward the $1,900 resistance level.
- XRP struggles to gain momentum above the $1.00 support as downward-sloping moving averages weigh.
Cryptocurrency prices are largely consolidating, with Bitcoin (BTC) hovering near the resistance at $64,000 at the time of writing on Wednesday. Ethereum (ETH) shows signs of recovery but remains below the $1,900 hurdle, while Ripple (XRP) hovers above the critical $1.00 support and is struggling to gain momentum.
Crypto sentiment lags ahead of CPI data release
The United States (US) Bureau of Labor Statistics (BLS) is expected to release the much-anticipated Consumer Price Index (CPI) report on Wednesday amid a cautious trading environment.
Market participants expect a small decline in consumer inflation and core inflation, with monthly CPI predicted to rise by 0.1%, against a backdrop of a 0.4% increase in June. Meanwhile, annual inflation is forecast to decline to 3.4% in July from 3.5% recorded the previous month.
Core CPI, excluding volatile food and energy components, is forecast to rise 0.2% monthly and 2.5% yearly, underscoring persistent inflationary pressures.
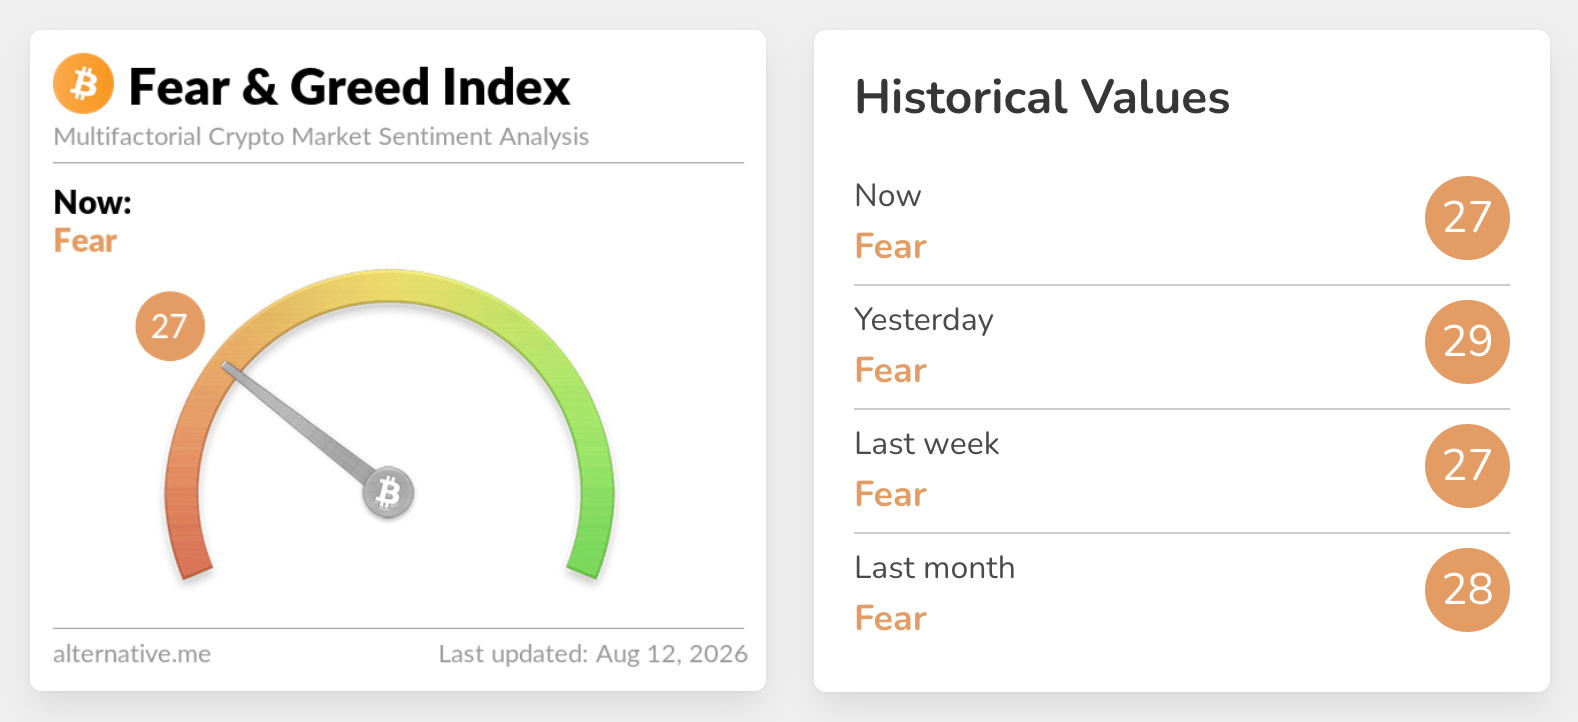
Crypto market sentiment is embedded in the Fear territory at 27 on Wednesday, down from 29 the day before, according to the Fear & Greed Index. This outlook indicates that risk appetite remains significantly subdued, capping the probability of a sustained recovery.
Technical analysis: Bitcoin stays neutral amid unclear market direction
Bitcoin trades at $63,821, maintaining a capped tone as it sits beneath the 50-day Exponential Moving Average (EMA) at $64,584 and the 100-day EMA at $66,723. The pair still trades above the upward-sloping support trendline around $63,458 and finds additional underlying demand from the Parabolic SAR at $62,753, but bearish momentum dominates with the Moving Average Convergence Divergence (MACD) histogram in negative territory on the daily chart and the Relative Strength Index (RSI) hovering near 48, hinting that rallies could struggle while price remains under the clustered EMAs.
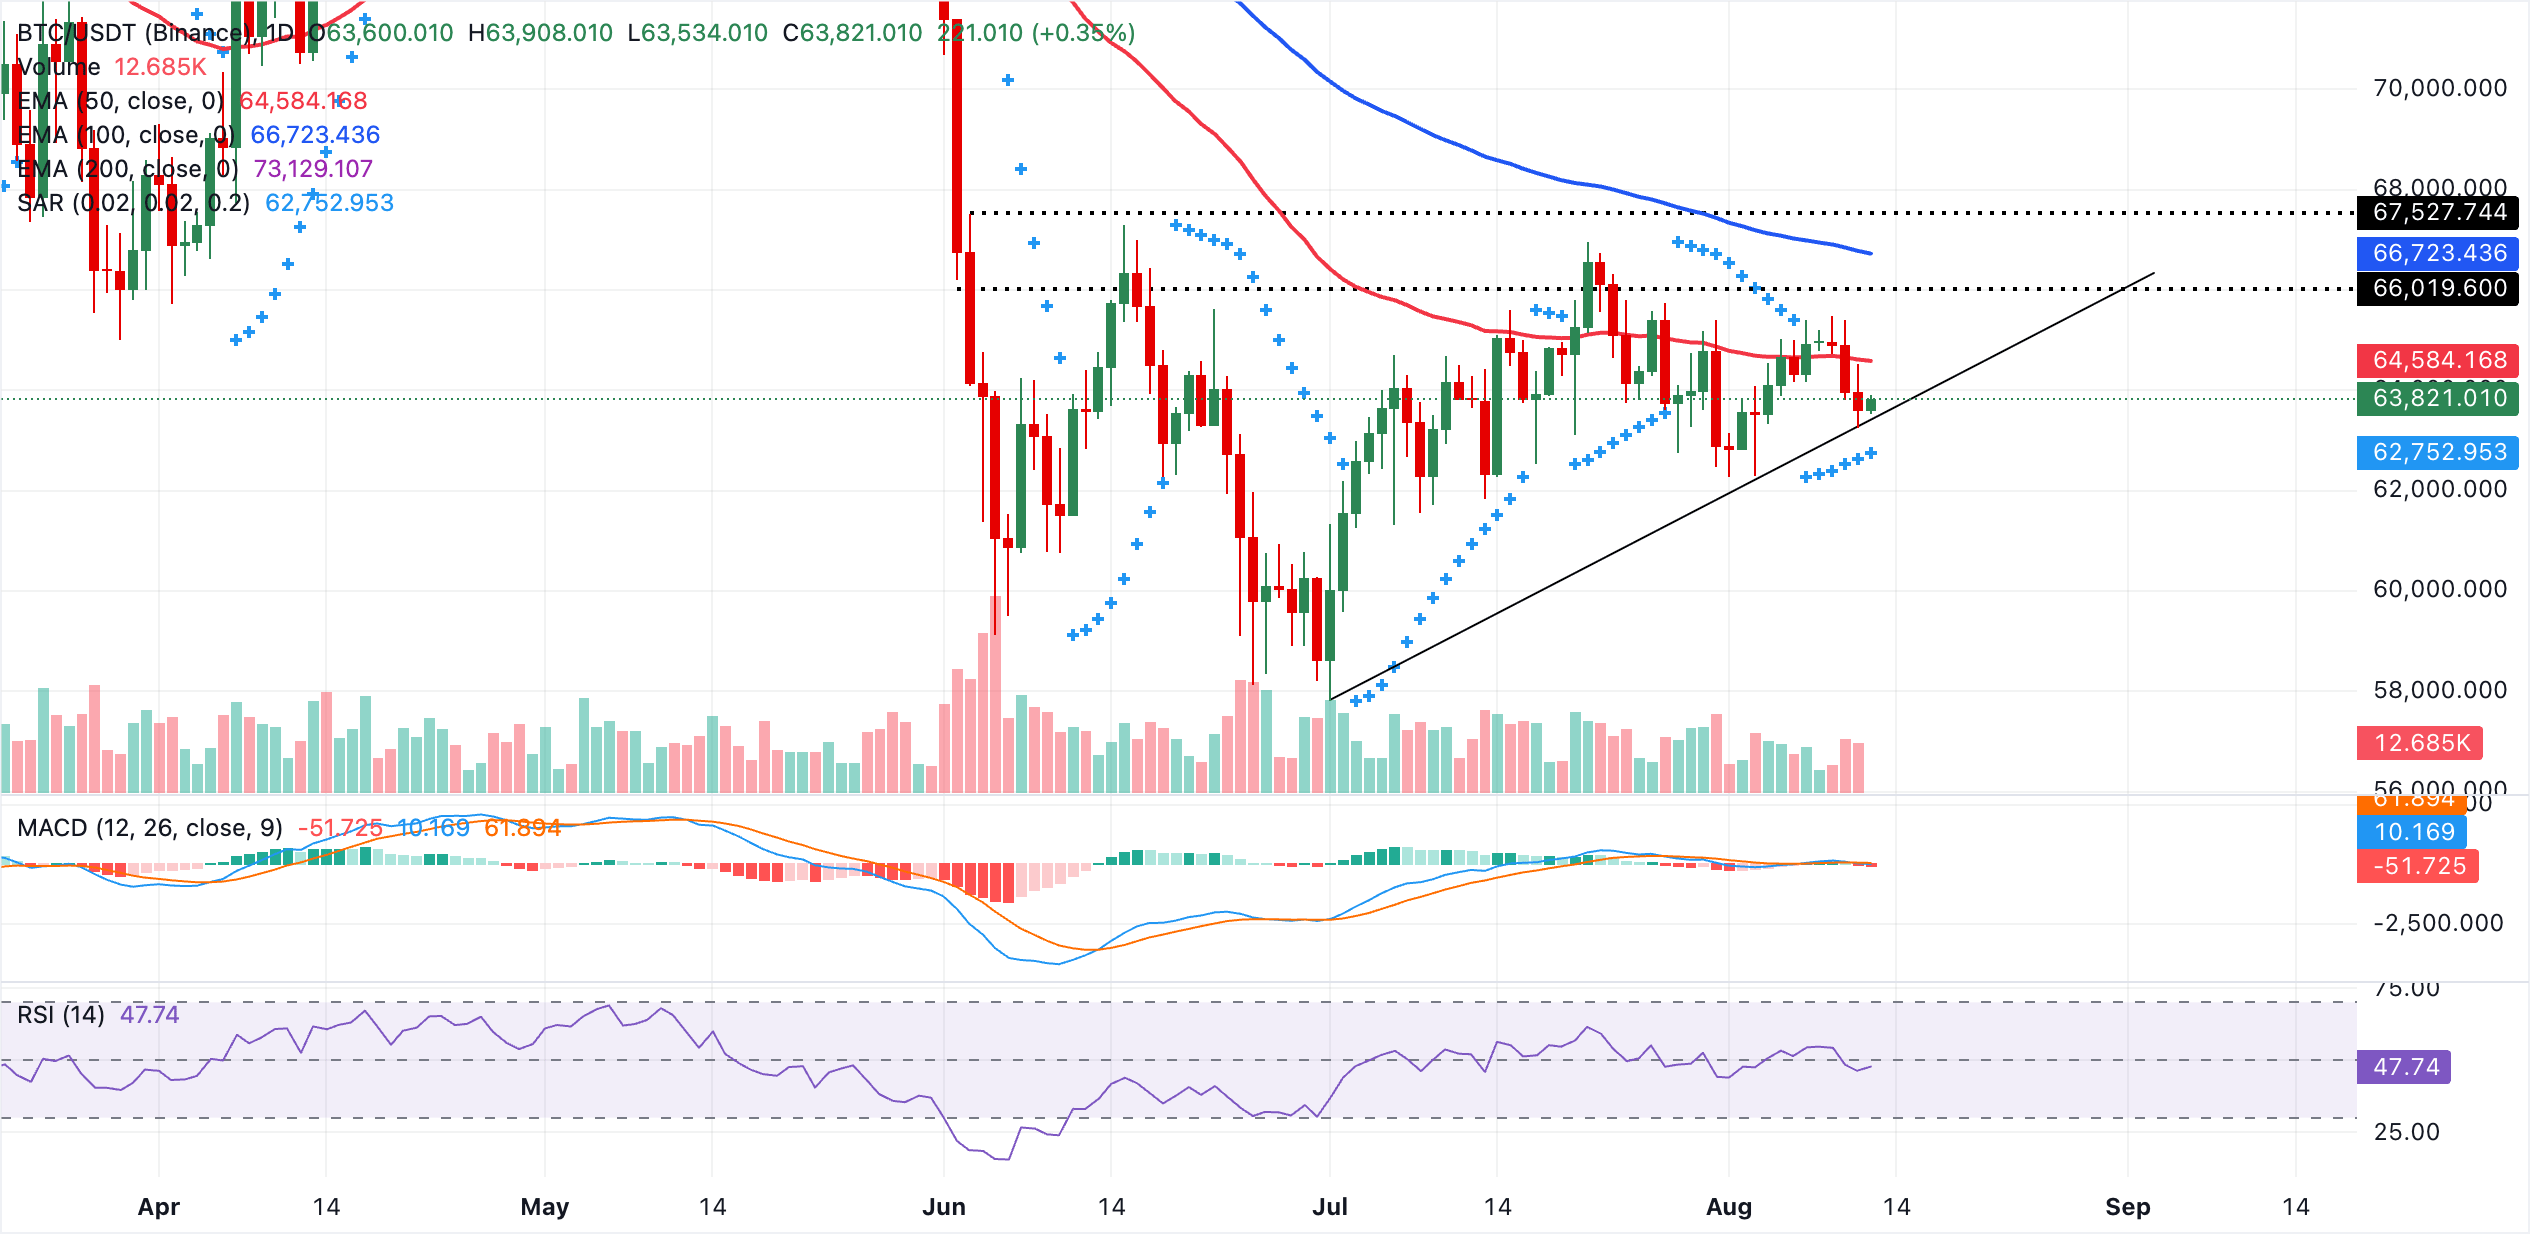
Immediate support lies at the reclaimed trendline area near $63,458, followed by the Parabolic SAR level at $62,753, where buyers may attempt to arrest deeper pullbacks. On the topside, initial resistance is provided by the 50-day EMA at $64,584, ahead of the denser barrier at the 100-day EMA near $66,723. A sustained break above these would be needed to ease the current bearish bias, while the longer-term 200-day EMA at $73,129 marks a more distant hurdle for any medium-term recovery.
"Bitcoin has spent six straight months trading between $60,000 and $80,000, with activity fading amid prolonged consolidation and typical summer doldrums. Unlike the 2014, 2018, and 2022 bear markets, which saw steadily lower lows, BTC hit a 50% drawdown from its all-time high on February 5 and remains near that level as of August 11, reflecting apathy rather than a deteriorating trend," analysts at K33 Research highlighted in the weekly report published every Tuesday.
Altcoins technical outlook: Ethereum eyes short-term breakout, XRP lags recovery
Ethereum trades at $1,893 while holding above the 50-day EMA at $1,865 and the latest Parabolic SAR at $1,829, but remains capped by the 100-day EMA at $1,924, keeping the near‑term bias mildly bearish.
Momentum is mixed, with the RSI hovering near a neutral 55 and the MACD below zero with a negative reading, which hints that upside attempts could continue to struggle under nearby resistance.
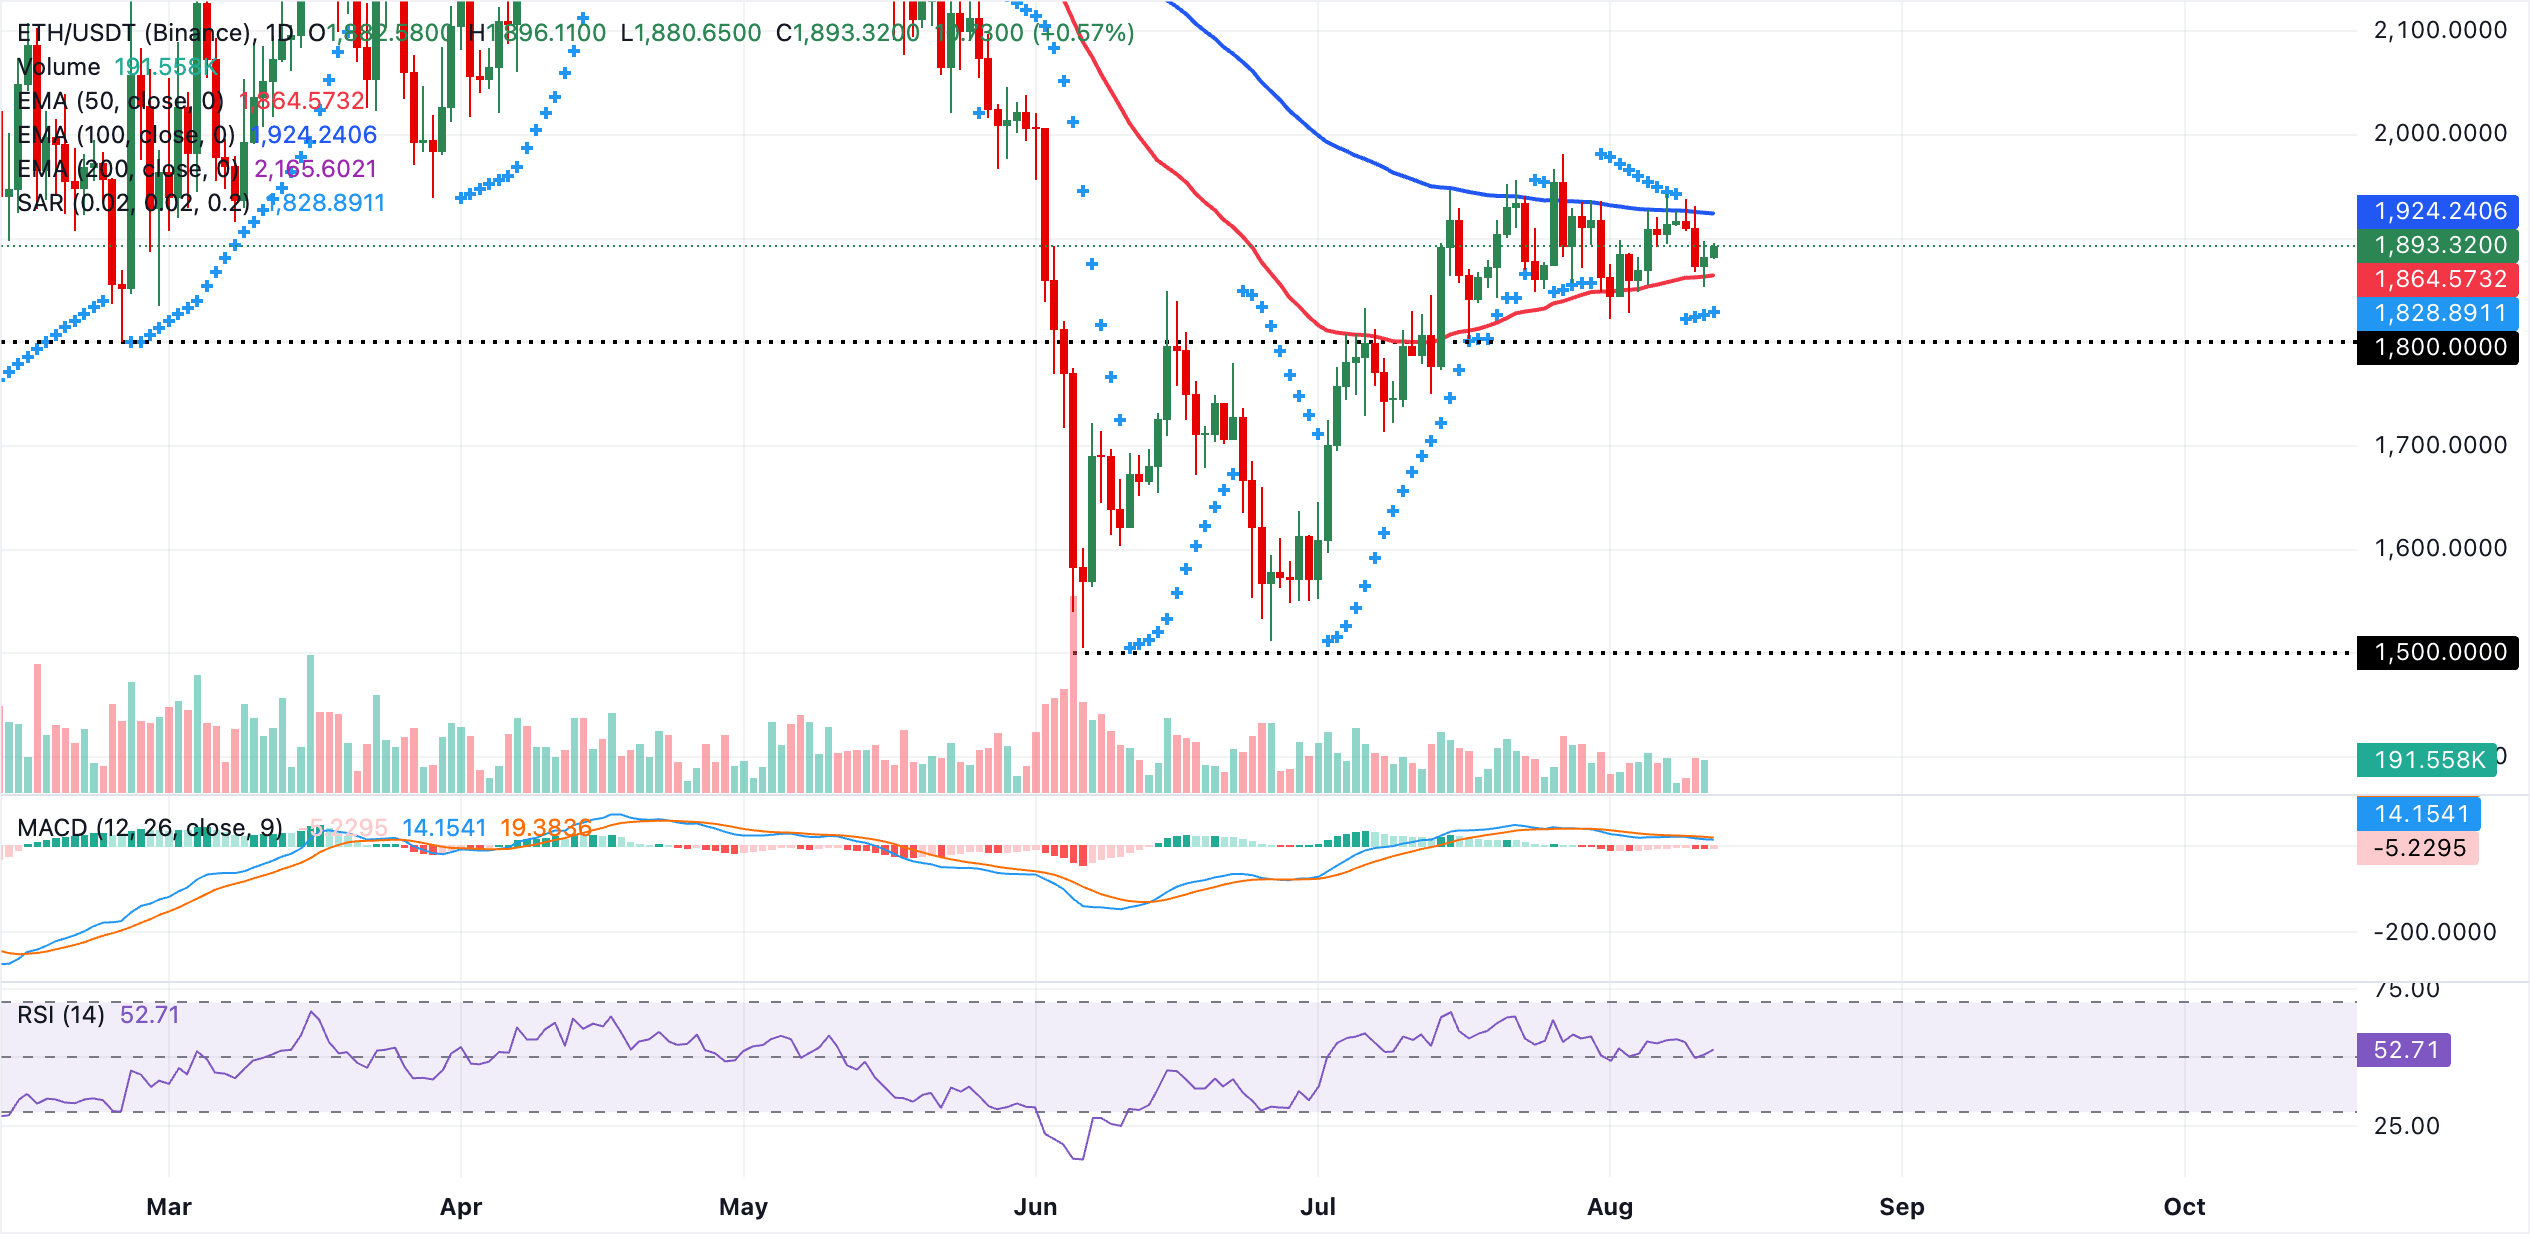
On the topside, immediate resistance lies at the 100‑day EMA at $1,924, followed by a more substantial hurdle at the 200‑day EMA near $2,166, where sellers would be expected to reassert pressure if reached. On the downside, initial support appears at the 50‑day EMA at $1,865, with the latest Parabolic SAR level at $1,829 reinforcing a secondary demand zone. A daily close below these supports would likely open the door to a deeper corrective phase in the coming sessions.
XRP, on the other hand, trades around $1.02. The pair remains under clear downside pressure, holding below the Bollinger middle boundary at roughly $1.06 and the 50-day EMA at about $1.09, which reinforces a bearish near-term bias. The spot price is also well beneath the 100-day and 200-day EMAs, at $1.18 and $1.37 respectively, underscoring a broader downtrend.
Momentum conditions support this view, with the RSI hovering near 38 in a weak, sub-50 regime and the MACD in negative territory, hinting at persistent selling pressure despite some recent stabilization.
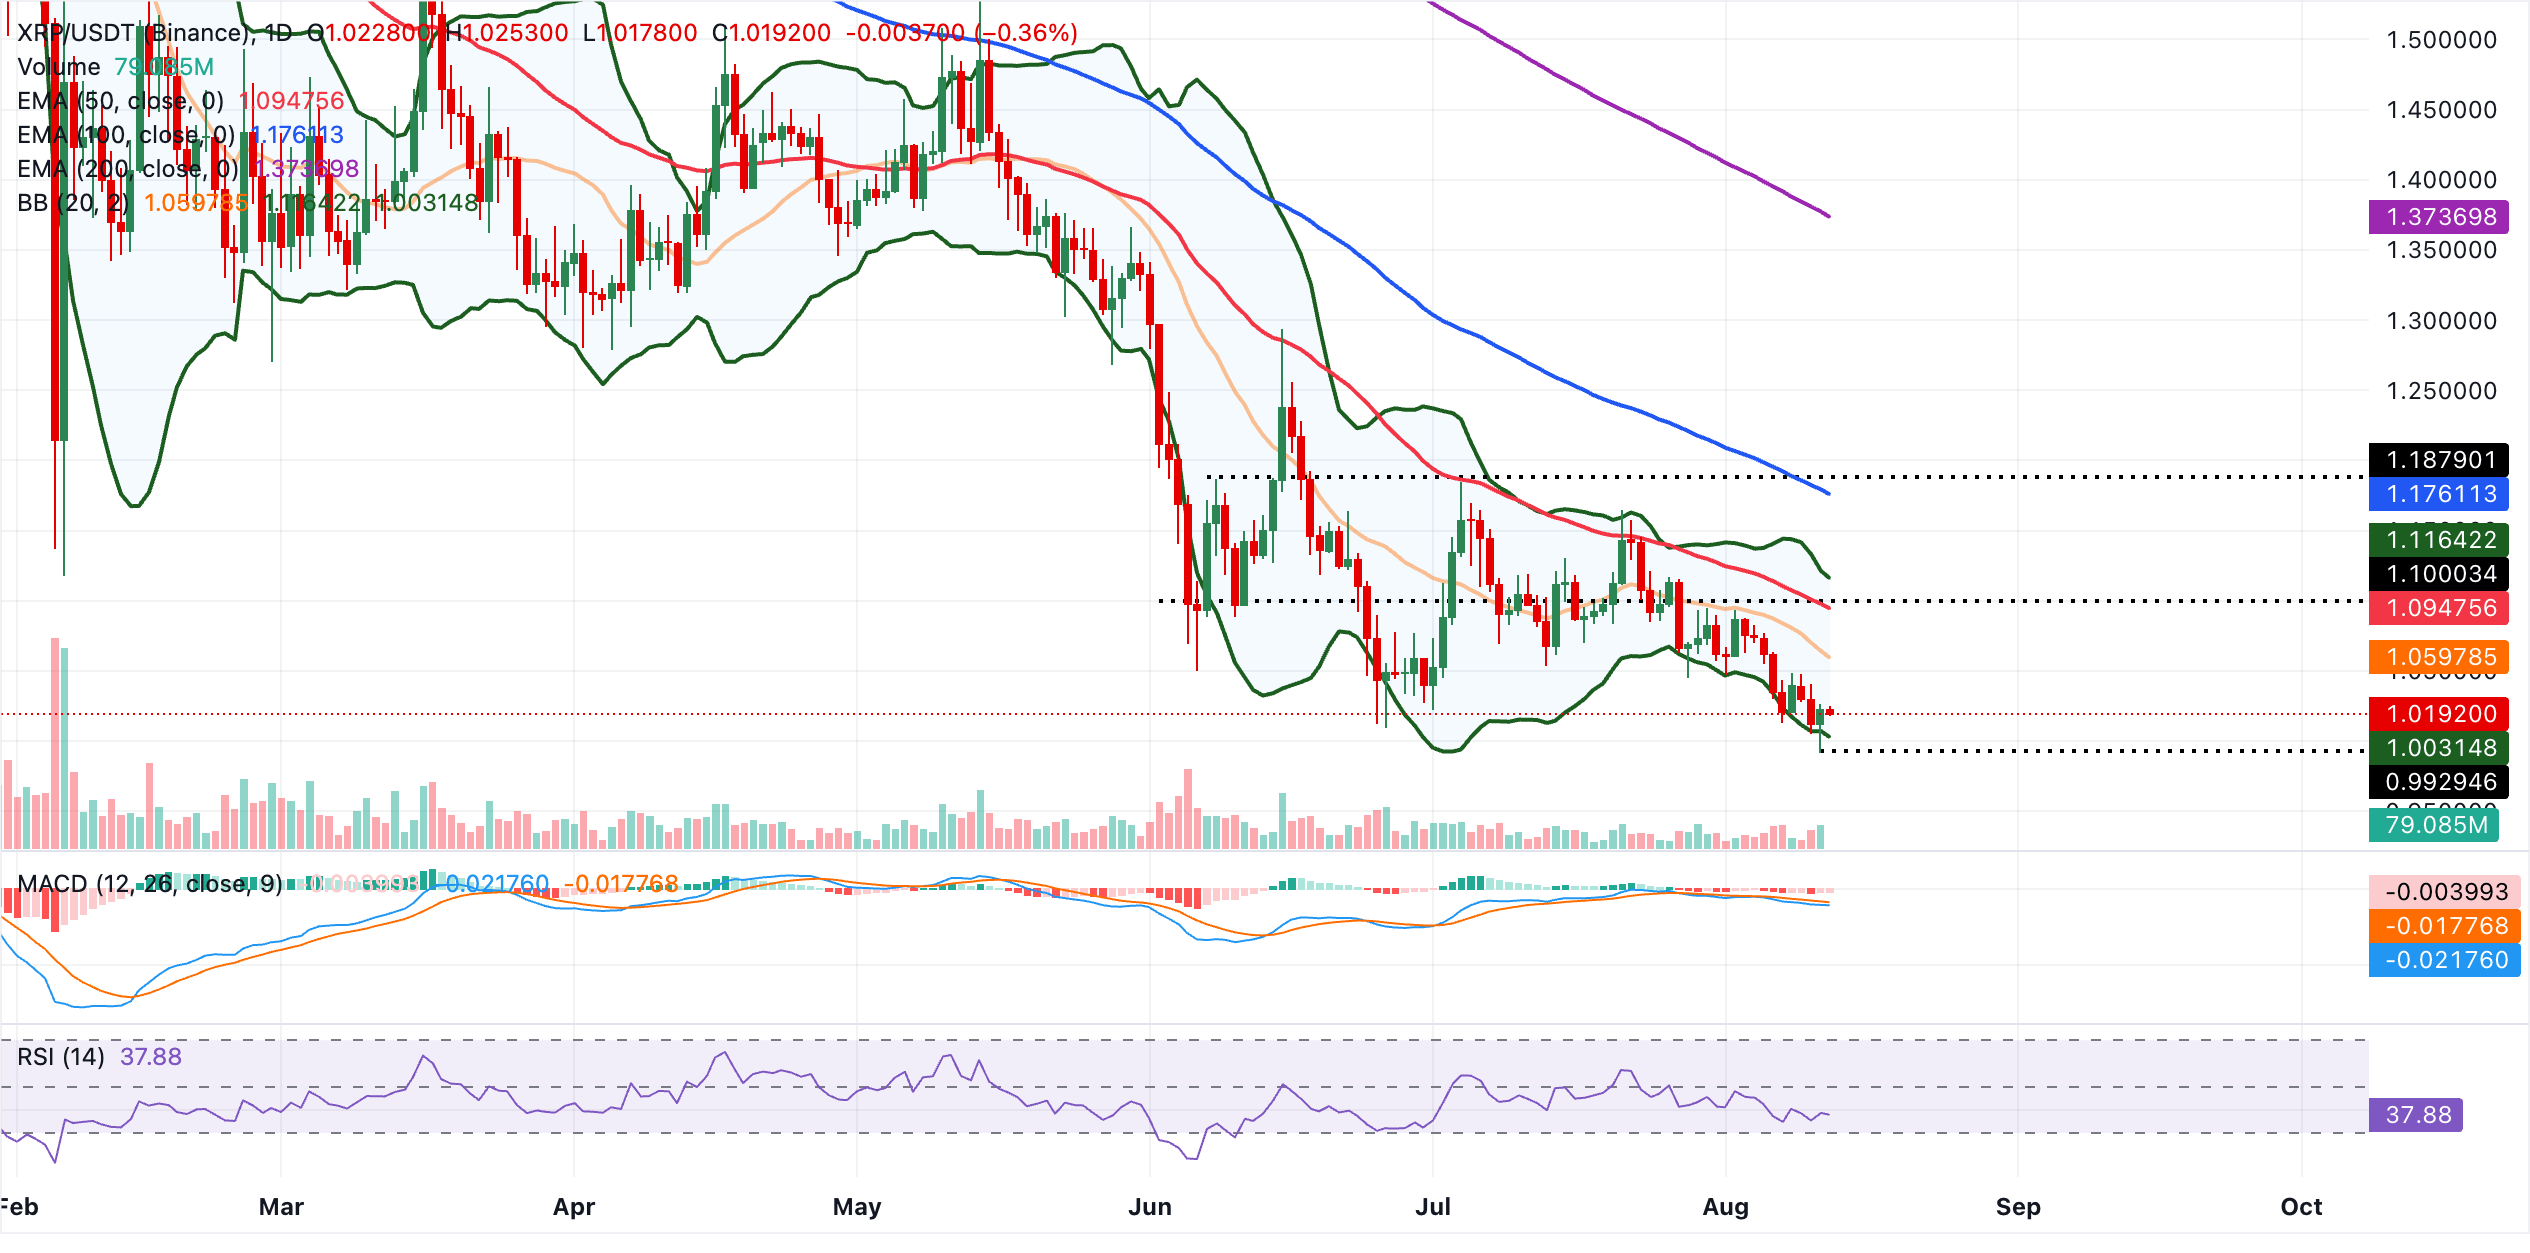
Initial resistance is seen at the Bollinger middle band near $1.06, followed by the 50-day EMA at $1.09 and the upper Bollinger band at around $1.11. Above these, the 100-day EMA at $1.18 and the 200-day EMA at $1.37 form a broader cap that would need to be reclaimed to ease the bearish tone. On the downside, the lower Bollinger band at $1.00 offers immediate support. A decisive break below this floor would open the door to fresh lows and potentially extend the current bearish sequence.
(The technical analysis of this story was written with the help of an AI tool. Know more.)
Bitcoin, altcoins, stablecoins FAQs
Bitcoin is the largest cryptocurrency by market capitalization, a virtual currency designed to serve as money. This form of payment cannot be controlled by any one person, group, or entity, which eliminates the need for third-party participation during financial transactions.
Altcoins are any cryptocurrency apart from Bitcoin, but some also regard Ethereum as a non-altcoin because it is from these two cryptocurrencies that forking happens. If this is true, then Litecoin is the first altcoin, forked from the Bitcoin protocol and, therefore, an “improved” version of it.
Stablecoins are cryptocurrencies designed to have a stable price, with their value backed by a reserve of the asset it represents. To achieve this, the value of any one stablecoin is pegged to a commodity or financial instrument, such as the US Dollar (USD), with its supply regulated by an algorithm or demand. The main goal of stablecoins is to provide an on/off-ramp for investors willing to trade and invest in cryptocurrencies. Stablecoins also allow investors to store value since cryptocurrencies, in general, are subject to volatility.
Bitcoin dominance is the ratio of Bitcoin's market capitalization to the total market capitalization of all cryptocurrencies combined. It provides a clear picture of Bitcoin’s interest among investors. A high BTC dominance typically happens before and during a bull run, in which investors resort to investing in relatively stable and high market capitalization cryptocurrency like Bitcoin. A drop in BTC dominance usually means that investors are moving their capital and/or profits to altcoins in a quest for higher returns, which usually triggers an explosion of altcoin rallies.
추천 기사


