


Canada's Loonie meets another 50% tariff
- USD/CAD trades just above the 1.4100 handle, up around a fifth of one percent and rising for a second straight session after defending the 50-day average last week.
- Washington opens the week with a 50% tariff round on most Canadian goods while the US Trade Representative teases action against dozens more countries.
- Record US import prices show who actually pays for the tariff wall, and Ottawa is racing to the negotiating table anyway.
USD/CAD trades just above the 1.4100 handle into the North American afternoon, up around a fifth of one percent and on track for a second consecutive daily advance. The recovery follows the July slide from the year's high near 1.4250 down to the 50-day Exponential Moving Average (EMA), a floor the pair defended last week with the daily Stochastic Relative Strength Index pinned near zero. The bounce now has a fundamental author, because the trade war has found its way back to Canada's doorstep.
Fifty percent now, dozens of countries next
The White House opened the week with a fresh 50% tariff round on most Canadian goods, framed by administration officials as retaliation for alleged trade discrimination against US products. The follow-through arrived Tuesday, when US Trade Representative Jamieson Greer said on television that action against dozens of countries is coming soon, putting flesh on reports of a broader wave being prepared before the current 10% global regime expires.
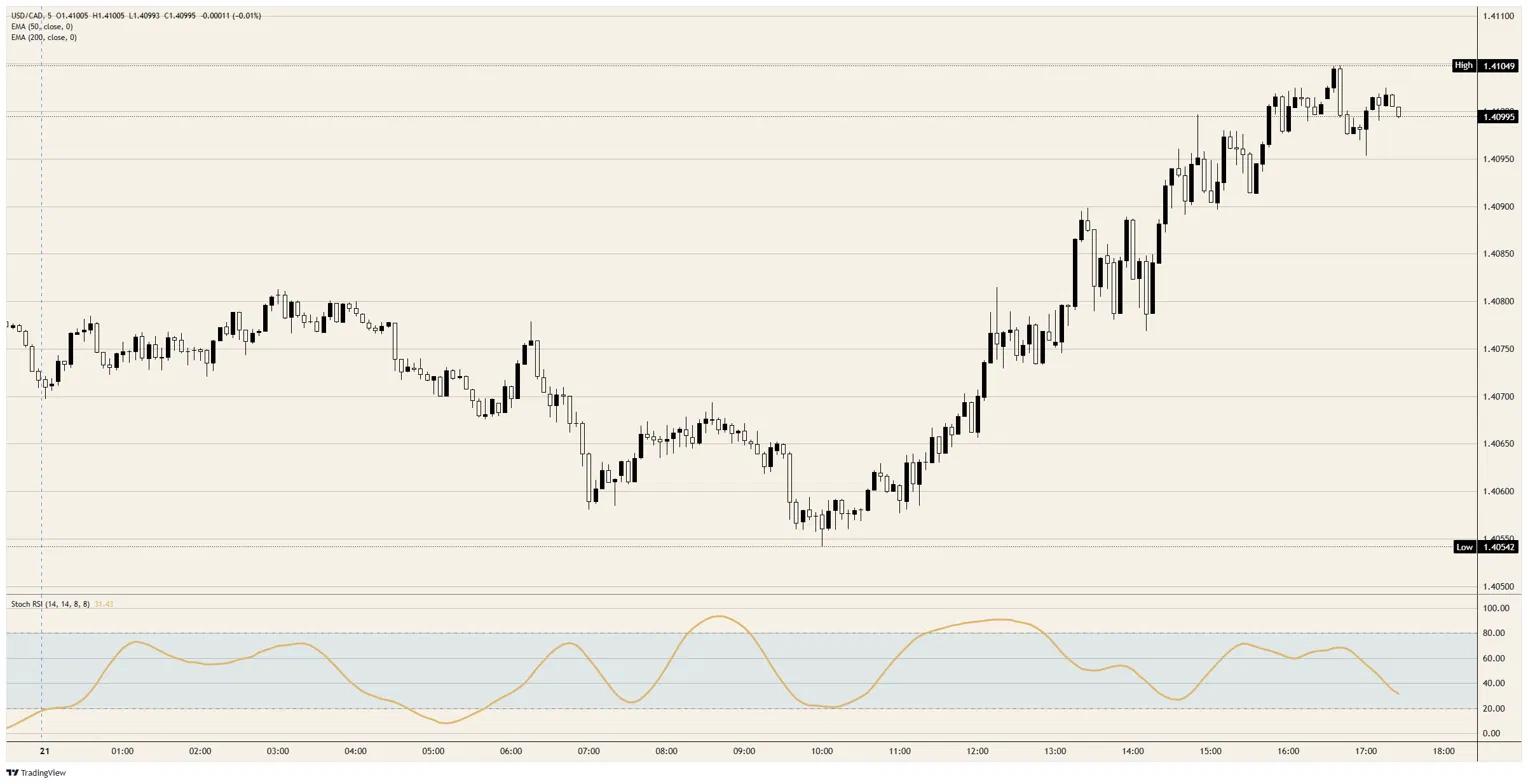
The pair spent the London morning drifting to a session low just above 1.4050 before the North American bid took over and carried it to fresh highs through the 1.4100 handle. The tape read the queue of tariff headlines the way it usually does, as a US Dollar story first and a Canadian growth story second.
Ottawa's answer was to reach for the calendar rather than the retaliation list. Prime Minister Mark Carney has agreed to accelerated trade talks with Washington, a concession to the arithmetic of the United States-Mexico-Canada Agreement (USMCA) review cycle. The US declined to renew the pact in its current form at the 1 July joint review, tipping the process into annual reviews that run until the deal is extended or expires in 2036, and racing to a deal beats a decade in the waiting room.
The forecast said five, the White House said fifty
The awkward institutional detail is that the Bank of Canada's July Monetary Policy Report, finalised on 10 July, embedded an average US tariff rate on Canada of 5.0%, with 1.5% running the other way. Eleven days later, the posted number from the Trump administration on most Canadian goods is 50%. The report's Crude Oil conditioning was already conceded stale at the July press conference, and its tariff conditioning has now aged considerably worse.
The same document assumes the Loonie averages roughly 71 cents US across the projection horizon, and every cent below that assumption imports inflation into an economy already in technical recession. Markets have run that arithmetic to its conclusion. A Bank of Canada hike is fully priced by the 9 December meeting, and a currency leaking lower on tariff risk hardens the case rather than softening it.
The bill lands at the US border
The under-covered half of the story is who actually pays for a tariff wall, and June's import price data answered it before this round was even announced. The US import price index printed a record 150.8 points, the highest reading on a series running back to 1982, with the annual rate at 7.1%, the fastest since August 2022. The index excludes tariffs by construction, so rising border prices under the tariff regime mean exporters are not absorbing the duties. That surcharge lands on the administration's own consumers.
The domestic hiring pulse is not obviously braced for it either. ADP's weekly employment gauge slowed to a 16.5K four-week average at 12:15 GMT this morning, down from 19.25K and a fourth consecutive week of deceleration. A cooling labour market walking into a fresh import price shock is the shape the Federal Reserve meets next week, with markets still carrying a fully priced hike there by December as well.
The docket: Retail sales, flash PMIs, then the Federal Reserve
Canadian May retail sales open the local docket Thursday at 12:30 GMT, with consensus at 1% MoM headline and 1.4% ex-autos, both an acceleration, and an upside print would hand the December hike pricing another data point. Friday brings the preliminary July S&P Global Purchasing Managers Index (PMI) round out of the US at 13:45 GMT, with manufacturing expected at 54.5.
The heavier event sits the following Wednesday, 29 July, when the Federal Reserve decides at 18:00 GMT with no forecast round attached, before Canadian May Gross Domestic Product (GDP) figures land Friday 31 July at 12:30 GMT. Between a tariff shock, a stale forecast, and two central banks priced for hikes, the calendar offers the reclaim trade no shortage of catalysts.
Loonie technical levels
Resistance: The 1.4100 handle is the immediate cap, with the session high just above it. Through that, the 1.4150 June breakout shelf is the line the pair must reclaim to reopen the uptrend, and beyond it the year's high waits just below 1.4250.
Support: The session low just above 1.4050 is the first shelf. Beneath it, the 1.4000 handle and the rising 50-day EMA just above it form the floor that absorbed the July selling.
Bias: Bullish while the pair holds above the 50-day EMA near 1.4000. A daily close through 1.4150 opens a run at the year's high near 1.4250, while a daily close back beneath the 50-day EMA hands control to the sellers and puts the 200-day EMA just below 1.3900 in the frame.
USD/CAD 5-minute chart
Canadian Dollar FAQs
The key factors driving the Canadian Dollar (CAD) are the level of interest rates set by the Bank of Canada (BoC), the price of Oil, Canada’s largest export, the health of its economy, inflation and the Trade Balance, which is the difference between the value of Canada’s exports versus its imports. Other factors include market sentiment – whether investors are taking on more risky assets (risk-on) or seeking safe-havens (risk-off) – with risk-on being CAD-positive. As its largest trading partner, the health of the US economy is also a key factor influencing the Canadian Dollar.
The Bank of Canada (BoC) has a significant influence on the Canadian Dollar by setting the level of interest rates that banks can lend to one another. This influences the level of interest rates for everyone. The main goal of the BoC is to maintain inflation at 1-3% by adjusting interest rates up or down. Relatively higher interest rates tend to be positive for the CAD. The Bank of Canada can also use quantitative easing and tightening to influence credit conditions, with the former CAD-negative and the latter CAD-positive.
The price of Oil is a key factor impacting the value of the Canadian Dollar. Petroleum is Canada’s biggest export, so Oil price tends to have an immediate impact on the CAD value. Generally, if Oil price rises CAD also goes up, as aggregate demand for the currency increases. The opposite is the case if the price of Oil falls. Higher Oil prices also tend to result in a greater likelihood of a positive Trade Balance, which is also supportive of the CAD.
While inflation had always traditionally been thought of as a negative factor for a currency since it lowers the value of money, the opposite has actually been the case in modern times with the relaxation of cross-border capital controls. Higher inflation tends to lead central banks to put up interest rates which attracts more capital inflows from global investors seeking a lucrative place to keep their money. This increases demand for the local currency, which in Canada’s case is the Canadian Dollar.
Macroeconomic data releases gauge the health of the economy and can have an impact on the Canadian Dollar. Indicators such as GDP, Manufacturing and Services PMIs, employment, and consumer sentiment surveys can all influence the direction of the CAD. A strong economy is good for the Canadian Dollar. Not only does it attract more foreign investment but it may encourage the Bank of Canada to put up interest rates, leading to a stronger currency. If economic data is weak, however, the CAD is likely to fall.
추천 기사


