


USD/JPY Price Forecast: Forms Symmetrical Triangle near multi-decade highs
- USD/JPY edges lower to near 162.36 as the US Dollar faces pressure.
- The Fed is expected to leave policy rates steady next week.
- Escalating Middle East conflicts are weighing on the Japanese Yen.
The Japanese Yen (JPY) trades marginally higher against the US Dollar (USD) during the European trading session on Monday. The USD/JPY pair edges down to near 162.36 as the US Dollar faces pressure, with investors remaining confident that the Federal Reserve (Fed) will leave interest rates unchanged in the monetary policy announcement next week.
During the press time, the US Dollar Index (DXY), which tracks the Greenback’s value against six major currencies, trades slightly lower to near 100.70.
The CME FedWatch tool, the odds of the Fed leaving interest rates unchanged in the July meeting are 85.6%, up from 65.8% recorded last week. Traders have trimmed hawkish Fed expectations after the United States (US) Consumer Price Index (CPI) data release for June, which showed that both headline and core inflation cooled down.
Meanwhile, the Japanese Yen faces pressure against its other currency peers amid escalating geopolitical tensions. Late Sunday, US Central Command (CENTCOM) confirmed that it had concluded a ninth straight night of strikes against Iran, clarifying that the latest aggression was in retaliation for the killing of at least three American service members
USD/JPY technical analysis
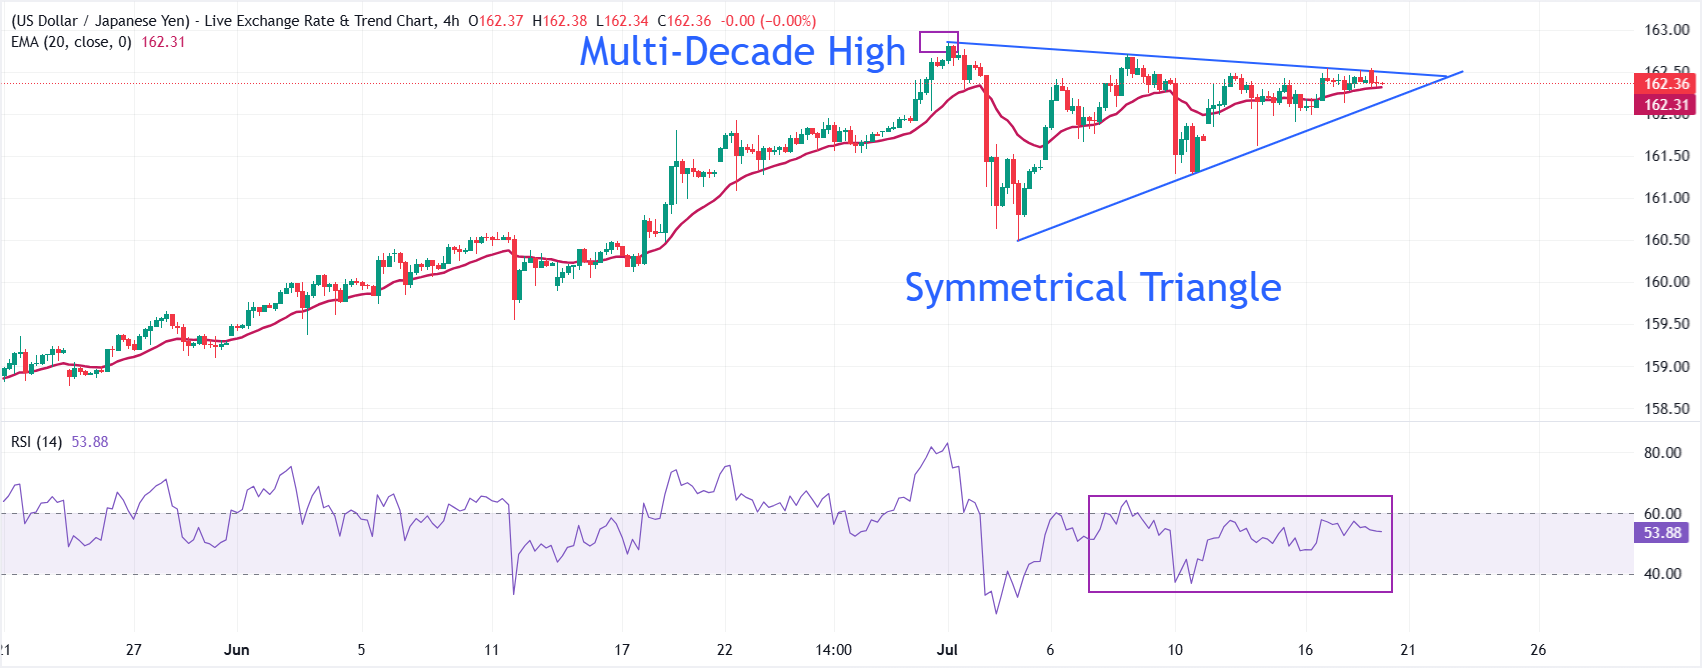
USD/JPY trades at 162.36, holding a modest bullish bias as it consolidates near the multi-decade high of 162.84. The pair trades close to the 20-period Exponential Moving Average (EMA) at 162.31, reflecting a sideways trend.
Price, which sits just under the multi-decade high at 162.84, while a mid-50s Relative Strength Index (RSI) at 53.83 suggests steady but not overextended buying pressure.
On the topside, the multi-decade high at 162.84 is the immediate resistance; a break above that would allow the pair to extend its upside towards 164.00. On the downside, the rising trend-line support near 162.26 is the immediate support level; a sustained break below that zone would expose deeper pullbacks toward the 160.49 origin of the current uptrend.
(The technical analysis of this story was written with the help of an AI tool. Know more.)
Fed FAQs
Monetary policy in the US is shaped by the Federal Reserve (Fed). The Fed has two mandates: to achieve price stability and foster full employment. Its primary tool to achieve these goals is by adjusting interest rates. When prices are rising too quickly and inflation is above the Fed’s 2% target, it raises interest rates, increasing borrowing costs throughout the economy. This results in a stronger US Dollar (USD) as it makes the US a more attractive place for international investors to park their money. When inflation falls below 2% or the Unemployment Rate is too high, the Fed may lower interest rates to encourage borrowing, which weighs on the Greenback.
The Federal Reserve (Fed) holds eight policy meetings a year, where the Federal Open Market Committee (FOMC) assesses economic conditions and makes monetary policy decisions. The FOMC is attended by twelve Fed officials – the seven members of the Board of Governors, the president of the Federal Reserve Bank of New York, and four of the remaining eleven regional Reserve Bank presidents, who serve one-year terms on a rotating basis.
In extreme situations, the Federal Reserve may resort to a policy named Quantitative Easing (QE). QE is the process by which the Fed substantially increases the flow of credit in a stuck financial system. It is a non-standard policy measure used during crises or when inflation is extremely low. It was the Fed’s weapon of choice during the Great Financial Crisis in 2008. It involves the Fed printing more Dollars and using them to buy high grade bonds from financial institutions. QE usually weakens the US Dollar.
Quantitative tightening (QT) is the reverse process of QE, whereby the Federal Reserve stops buying bonds from financial institutions and does not reinvest the principal from the bonds it holds maturing, to purchase new bonds. It is usually positive for the value of the US Dollar.
추천 기사


