


NZD/USD Price Forecast: Holds onto Tuesday’s gains amid risk-on mood
- NZD/USD remains firm near 0.5820 amid an upbeat market mood.
- Traders trump hawkish Fed bets following soft US CPI data.
- Investors await the US PPI data for June.
The New Zealand Dollar (NZD) clings to Tuesday’s gains around 0.5820 during the European trading session on Wednesday. The Kiwi pair reflects strength in a risk-on market environment, driven by easing fears of Federal Reserve (Fed) interest rate hikes this year.
In the European trade, S&P 500 futures trade 0.25% higher around 7,563, indicating strong demand for riskier assets.
According to the CME FedWatch tool, the odds of the Fed raising interest rates in the policy meeting this month have eased to 16.6% from 31% seen last week.
Market participants have scaled back hawkish Fed bets as the United States (US) inflation cooled down at a faster-than-expected pace in June.
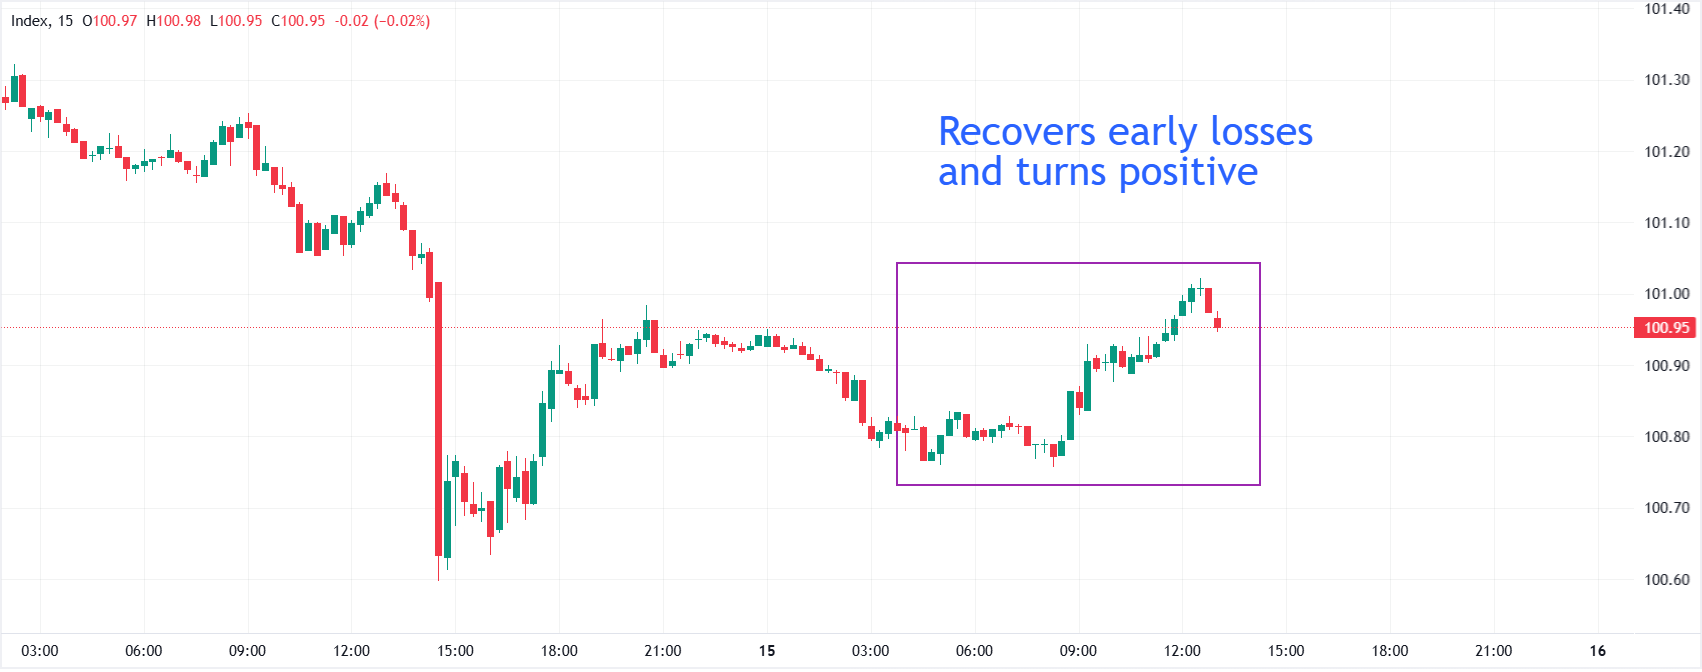
Meanwhile, investors await the US Producer Price Index (PPI) data for June, which will be published at 12:30 GMT. Ahead of the US producer inflation data, the US Dollar Index (DXY), which gauges the Greenback’s value against six major currencies, trades marginally higher to near 101.00 after recovering early losses.
NZD/USD technical analysis
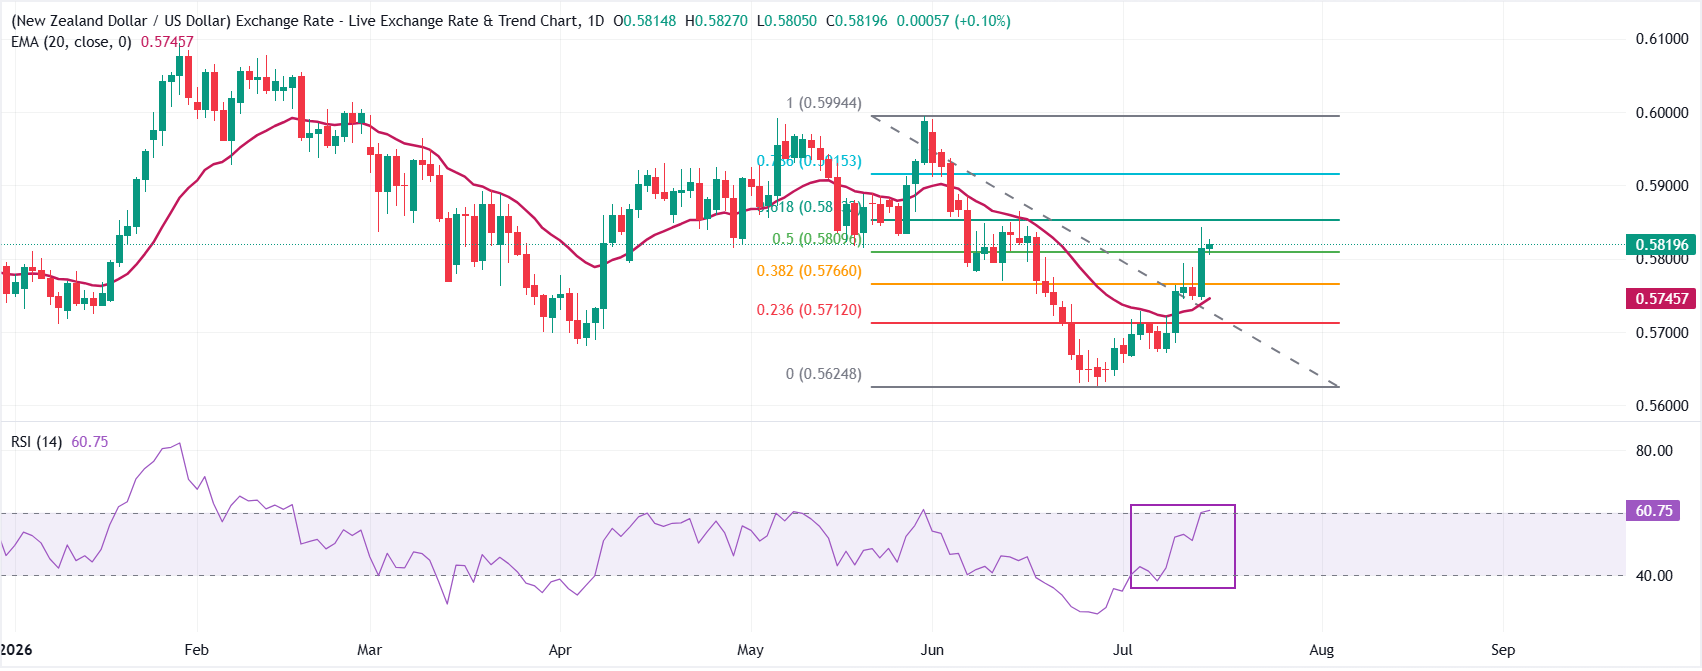
NZD/USD trades marginally higher at around 0.5820. The pair has edged back above the 50.00% Fibonacci retracement at 0.5810 while holding over the 20-day exponential moving average (EMA) at 0.5746, which together hint at a constructive near-term tone.
A rising Relative Strength Index (RSI) at 60.8 reinforces improving bullish momentum, though prices are still capped by the 61.80% retracement at 0.5853 just overhead.
On the topside, immediate resistance is located at the 61.80% Fibonacci retracement at 0.5853, followed by the 78.60% retracement at 0.5915, with the recent swing high at the 100.00% level of 0.5994 acting as a stronger barrier if gains extend. On the downside, initial support is seen at the reclaimed 50.00% retracement at 0.5810, ahead of a minor floor around the 38.20% level at 0.5766 and the 20-day EMA at 0.5746, while deeper declines would expose the 23.60% retracement at 0.5712 and the structural anchor near 0.5625.
(The technical analysis of this story was written with the help of an AI tool. Know more.)
Risk sentiment FAQs
In the world of financial jargon the two widely used terms “risk-on” and “risk off'' refer to the level of risk that investors are willing to stomach during the period referenced. In a “risk-on” market, investors are optimistic about the future and more willing to buy risky assets. In a “risk-off” market investors start to ‘play it safe’ because they are worried about the future, and therefore buy less risky assets that are more certain of bringing a return, even if it is relatively modest.
Typically, during periods of “risk-on”, stock markets will rise, most commodities – except Gold – will also gain in value, since they benefit from a positive growth outlook. The currencies of nations that are heavy commodity exporters strengthen because of increased demand, and Cryptocurrencies rise. In a “risk-off” market, Bonds go up – especially major government Bonds – Gold shines, and safe-haven currencies such as the Japanese Yen, Swiss Franc and US Dollar all benefit.
The Australian Dollar (AUD), the Canadian Dollar (CAD), the New Zealand Dollar (NZD) and minor FX like the Ruble (RUB) and the South African Rand (ZAR), all tend to rise in markets that are “risk-on”. This is because the economies of these currencies are heavily reliant on commodity exports for growth, and commodities tend to rise in price during risk-on periods. This is because investors foresee greater demand for raw materials in the future due to heightened economic activity.
The major currencies that tend to rise during periods of “risk-off” are the US Dollar (USD), the Japanese Yen (JPY) and the Swiss Franc (CHF). The US Dollar, because it is the world’s reserve currency, and because in times of crisis investors buy US government debt, which is seen as safe because the largest economy in the world is unlikely to default. The Yen, from increased demand for Japanese government bonds, because a high proportion are held by domestic investors who are unlikely to dump them – even in a crisis. The Swiss Franc, because strict Swiss banking laws offer investors enhanced capital protection.
추천 기사


