
Silver Price Analysis: XAG/USD explodes above $80 as rally extends
- XAG/USD surges over 5% to fresh YTD highs as geopolitical tensions, weaker US jobs outlook fuel aggressive buying.
- RSI enters overbought territory, yet momentum remains strong, keeping the upside bias firmly intact.
- A break above $81.44 opens $82.00 and $85.87, while $80.00 is key downside support.
Silver (XAG/USD) continues to rise parabolically, up more than 5%, trading above the $80.00 threshold a troy ounce, despite rising US Treasury yields and a strong US Dollar.
Geopolitics continued to drive the precious metals segment higher. This and increasing bets that the Federal Reserve will resume its easing cycle during the year sparked by weakness in the jobs market, pushing the grey’s metal to a new year-to-date (YTD) high of $81.43.
XAG/USD Price Analysis: Technical outlook
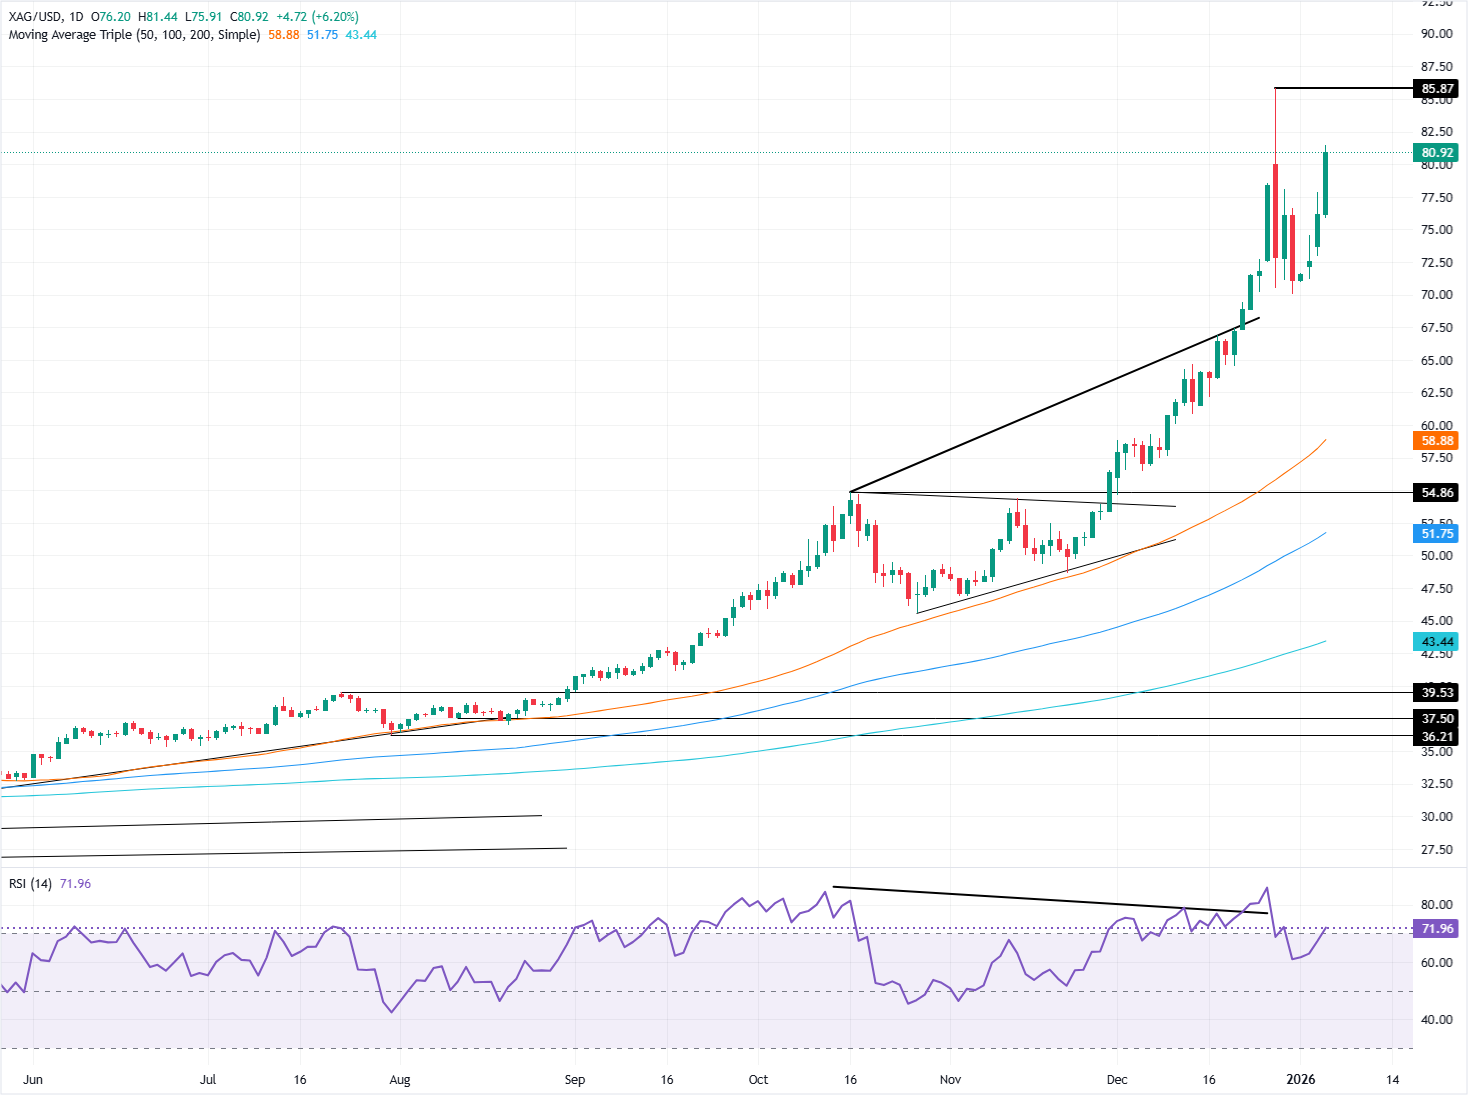
Silver’s technical picture indicates that bulls continued to control the narrative, while the Relative Strength Index (RSI) turns overbought. Nevertheless, as the RSI crosses the 70 level, it’s worth nothing that due to the strength of the move, XAG/USD is not as overbought as shown by the RSI.
If the RSI crosses above 80, then Silver could be considered overbought, but so far it seems that the trend is overextended, subject to a retracement. However, the path of least resistance is upwards.
The first key resistance is the day’s high of $81.44. Once surpassed, the next stop would be the $82.00 mark ahead of the all-time high at $85.87. Conversely, if XAG/USD dives below $80.00, this could exacerbate a pullback, with the January 5 high at $77.88, being the first support level. Once cleared, the next stop would be $75.00.
XAG/USD Price Chart – Daily
Silver FAQs
Silver is a precious metal highly traded among investors. It has been historically used as a store of value and a medium of exchange. Although less popular than Gold, traders may turn to Silver to diversify their investment portfolio, for its intrinsic value or as a potential hedge during high-inflation periods. Investors can buy physical Silver, in coins or in bars, or trade it through vehicles such as Exchange Traded Funds, which track its price on international markets.
Silver prices can move due to a wide range of factors. Geopolitical instability or fears of a deep recession can make Silver price escalate due to its safe-haven status, although to a lesser extent than Gold's. As a yieldless asset, Silver tends to rise with lower interest rates. Its moves also depend on how the US Dollar (USD) behaves as the asset is priced in dollars (XAG/USD). A strong Dollar tends to keep the price of Silver at bay, whereas a weaker Dollar is likely to propel prices up. Other factors such as investment demand, mining supply – Silver is much more abundant than Gold – and recycling rates can also affect prices.
Silver is widely used in industry, particularly in sectors such as electronics or solar energy, as it has one of the highest electric conductivity of all metals – more than Copper and Gold. A surge in demand can increase prices, while a decline tends to lower them. Dynamics in the US, Chinese and Indian economies can also contribute to price swings: for the US and particularly China, their big industrial sectors use Silver in various processes; in India, consumers’ demand for the precious metal for jewellery also plays a key role in setting prices.
Silver prices tend to follow Gold's moves. When Gold prices rise, Silver typically follows suit, as their status as safe-haven assets is similar. The Gold/Silver ratio, which shows the number of ounces of Silver needed to equal the value of one ounce of Gold, may help to determine the relative valuation between both metals. Some investors may consider a high ratio as an indicator that Silver is undervalued, or Gold is overvalued. On the contrary, a low ratio might suggest that Gold is undervalued relative to Silver.
추천 기사


