


Tyson Foods Jumps 8.7% on Bets Beef Has Bottomed, With $65.70 the Next Hurdle
TradingKey - Tyson Foods (NYSE: TSN) jumped 8.72% to $63.95 on Monday, November 16, from Friday's $58.82, after its fiscal fourth-quarter report, and premarket trading has eased to $63.22. The rally came on a day when the S&P 500 fell 1.92% and the Nasdaq lost 2.49%, as investors moved toward defensive stocks before Nvidia's earnings.
The outlook itself was not strong. Tyson expects sales to shrink in fiscal 2027 and operating profit to stay roughly flat, yet the stock jumped anyway, because investors are betting the worst of its beef losses is close to an end.
A Quarter That Beat Lowered Expectations
Sales rose 5.2% to $14.59 billion, above the roughly $14.1 billion forecast, helped by an extra week in the quarter. Excluding that extra week and legal accruals, sales fell 4.0%. Adjusted EPS, which excludes one-time items, fell 47% to $0.61 from $1.15 but came in just above the $0.60 consensus, according to BigGo Finance. On a GAAP basis, Tyson lost $0.22 a share.
Adjusted operating income fell 41% to $361 million, a 2.6% margin, down from 4.3% a year earlier. By segment, Beef lost $171 million, a negative 3.4% margin, and Chicken earned $389 million, an 8.7% margin, down from 12.7%. Prepared Foods held up well, with operating income up to $321 million and a 12.6% margin, while Pork earned $16 million and International $49 million.
Beef Losses Are the Story
For the full fiscal year, the Beef segment lost about $654 million, up from $275 million, as a tight US cattle supply kept costs high. The fourth quarter also included an $80 million non-cash write-down on live cattle inventory. Tyson is now restructuring its beef network around three plants it plans to run long term and has said its Pasco, Washington facility is for sale.
That is why investors see a bottom forming. Tyson guided fiscal 2027 beef results to between a $300 million loss and a $100 million profit, a big improvement from this year at the midpoint. Across the industry, capacity is leaving the market. JBS said its North American beef margin rose from negative 2.9% in July to 3.9% in September, partly because processing capacity is shrinking. COO Wes Morris also pointed to positive early signs in cattle supply, and a phased reopening of the Mexican border could add up to 800,000 head of cattle in fiscal 2027.
The risk is that the recovery takes longer. The USDA expects beef production to fall about 2% in fiscal 2027, which could keep cattle scarce and costs high, and CFO Curt Calaway warned that the second quarter is seasonally difficult because of weather.
Chicken Cools as Guidance Stays Flat
Chicken has been carrying the company, but it is expected to slow. Full-year Chicken operating income was about $1.86 billion, and Tyson guided fiscal 2027 to $1.3 billion to $1.6 billion, citing industry supply growth and higher grain and input costs. Prepared Foods should stay steady at $1.25 billion to $1.4 billion.
In total, Tyson expects adjusted operating income of $1.7 billion to $2.15 billion, with a midpoint of about $1.93 billion, slightly below fiscal 2026's $1.98 billion. It guided sales down 3.5% to 5.5% as it sells less beef, and free cash flow, the cash left after running the business and paying for new equipment, of $0.8 billion to $1.3 billion, down from $1.66 billion in fiscal 2026. Tyson also raised its dividend 2% to $2.08 a year for Class A shares, about a 3.3% yield at Monday's close, by my calculation.
After the jump, the stock looks fully valued. It traded at about 17 times forward earnings at Friday's close, above its five-year average of about 16 times, according to TIKR, and the average analyst target of about $64 now sits right at the share price. Analysts had expected fiscal 2027 EPS of $3.84 before the report, and that figure may come down given the flat guidance.
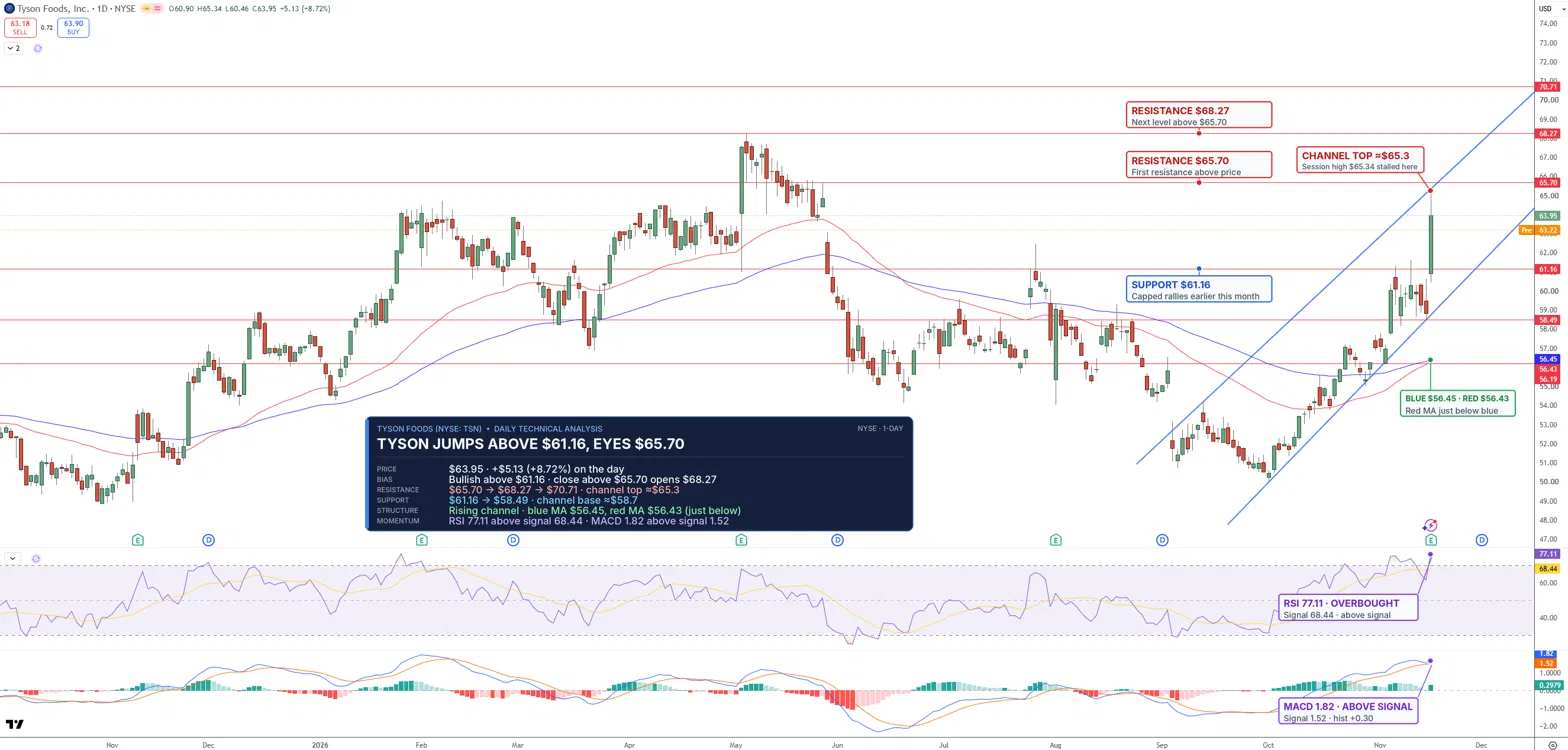
Tyson Foods Technical Analysis: Daily Close Above $65.70 Could Open $68.27
That optimism shows clearly on the daily chart. The stock broke cleanly above $61.16, a level that capped rallies earlier this month, and the results sparked the move. The uptrend has been steady since October, with price climbing inside a rising channel, two parallel lines that have guided prices higher. The red moving average at $56.19 is also about to cross above the blue one at $56.45, a bullish sign, since moving averages track the average price over recent sessions. Still, the session high of $65.34 stalled at the top of the channel.
RSI, a momentum gauge that runs from 0 to 100, has jumped to about 77, in overbought territory, above the 70 level where buying is often seen as stretched. A short pause or pullback would be normal.
TSN Price Chart - Source: Tradingview
A daily close above $65.70 could open $68.27, followed by $70.71. On the downside, $61.16 is now key support, followed by $58.49.
I'm bullish while Tyson holds above $61.16, though overbought conditions could trigger a brief pause first.
Key Levels
- Last close: $63.95, up 8.72% on Monday, November 16 (premarket: $63.22)
- Support: $61.16, $58.49
- Resistance: $65.70, $68.27, $70.71
- RSI: 77.11
- Bullish trigger: Daily close above $65.70
- Bearish trigger: Daily close below $61.16
FAQs
Why did Tyson Foods stock jump after earnings?
Tyson beat fourth-quarter sales and EPS estimates, and investors bet its beef losses are near a bottom, as it guided fiscal 2027 beef results to between a $300 million loss and a $100 million profit after a $654 million loss this year.
What is the Tyson Foods stock forecast now?
The bias is bullish while TSN holds above $61.16. A daily close above $65.70 could open $68.27 and $70.71, while a drop below $61.16 would point to $58.49, and overbought conditions could cause a brief pause first.
Bottom Line
Tyson's rally rests on beef losses shrinking, while chicken profits cool and total profit guidance stays flat. The level that matters is $61.16. In my view, holding it keeps the channel intact with $65.70 next, while a daily close back below it would suggest the post-earnings jump went too far.
Recommended Articles


