


Gold Price Analysis Today | Forex Gold Analysis | XAU/USD Analysis - November 11, 2026


Today's Gold Price
Gold price chart for today
*0% Commission and Low Spreads 0️⃣
*$50,000 in Free Virtual Funds 💰
*$100 New Customer Bonus 🎁
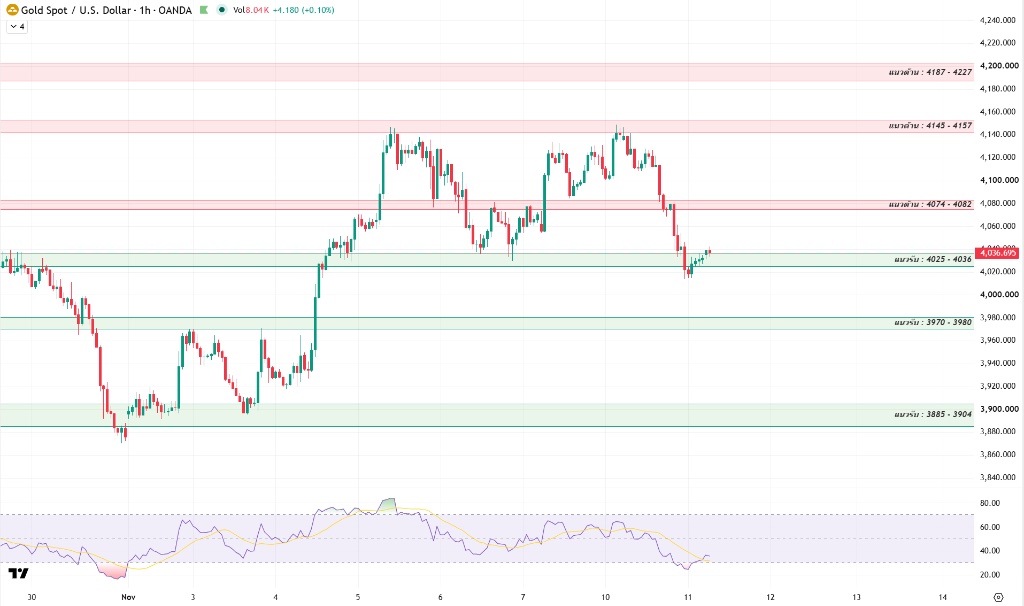
Gold (XAU/USD) traded near $4,036 this morning (November 11, 2026) after plunging more than $100 as hotter-than-expected U.S. CPI pushed the 10-year Treasury yield above 5.00% and strengthened the dollar. Markets priced in a 100% chance of a December Fed rate hike, with attention on Waller's signals about a possible 50 bps move. The $4,025–4,036 area is in focus today as gold looks to absorb selling pressure and form a base for a potential rebound.
Today's Key Points
Key Points |
|
|
|
Hotter-than-expected U.S. CPI pushes yields above 5%, sending gold down more than $100 as silver also falls sharply
The U.S. Labor Department reported that October CPI rose 0.4% and core CPI increased 0.3%, both above expectations. Shelter costs rose 0.3% and accounted for more than 30% of inflation, reflecting persistent and widespread price pressures.
The 10-year Treasury yield surged above 5.00%, boosting the dollar. Spot gold fell $107.60 (-2.60%) to $4,031.80, and silver dropped 3.55% to $51.41 as the opportunity cost of holding non-interest-bearing assets rose sharply.
Markets price in a 100% chance of a December Fed hike as Waller leaves the door open to a 50 bps move to curb inflation
The inflation report pushed futures pricing for a Fed hike at the December 8–9 meeting to a 100% probability, split between an 88.2% chance of a 25 bps hike and an 11.8% chance of a 50 bps hike. Markets had previously assigned almost no weight to a move of that size.
Pressure increased after Fed Governor Christopher Waller said rates should rise in December and left the door open to a 50 bps hike if core inflation remained elevated. The latest core CPI reading reached that threshold, according to the source. Richmond Fed President Tom Barkin favored waiting for more data.
Oil falls to a 2-month low as the U.S. holds off on striking Iran and diplomacy yields no clear deal
Brent crude fell 1.17% to $91.49 and WTI touched $86.04, the lowest levels since August 31, as concerns about energy supply eased. President Trump said he was prepared to delay a strike on Iran at the request of countries in the region, while Marco Rubio said sanctions continued to exert sufficient pressure.
Iranian security official Mohsen Rezaei said there had been no formal talks with the U.S., with disputes over sanctions and shipping through the Strait of Hormuz still unresolved. A smaller war risk premium pushed oil prices lower, though uncertainty remained.



Technical Analysis of Gold (XAU/USD)
On the 1-hour chart, gold fell sharply from a high of $4,148 to test initial support at $4,025–4,036. Lower candle wicks began to appear, suggesting buyers were stepping in to absorb sell-side liquidity around this key support after heavy selling.
The 1-hour RSI (14) fell from 64 to 28, entering oversold territory, before ticking up slightly. That suggests selling pressure is easing, although price remains below all moving averages, so the bounce so far amounts to a technical rebound.
The key test today is whether gold holds above $4,025–4,036. If the base holds, a technical rebound could test initial resistance at $4,074–4,082. If the rebound is rejected, a bull trap could send prices back toward the same support.
A sustained move back above $4,074–4,082 would open the way toward $4,145–4,157 and $4,187–4,227. A break below initial support at $4,025–4,036 would expose the next support at $3,970–3,980 and the deeper base at $3,885–3,904.
Today's Gold Price Outlook
Possible Scenarios |
|
|
|
Today's Trading Strategy
Short-term traders: Trade the range cautiously. Wait for signs of buying around $4,025–4,036 or for a break back above $4,082 before buying. Always use a stop-loss.
- Buy: Wait for a pullback to $4,025–4,036 and a clear reversal candle, or consider buying on a break above $4,082. The source lists profit targets at $4,074–4,082 and $4,145, with a stop-loss below $4,015.
- Sell: Consider selling if a rebound into $4,074–4,082 or $4,145–4,157 is rejected, or on a break below $4,025. The target is near $3,980, with a stop-loss above $4,090.
Longer-term traders: High rates are weighing on gold in the near term, but U.S. debt remains a structural tailwind. The suggested approach is to wait for a firm base near $3,970–3,980 before gradually accumulating.
Daily Support and Resistance Levels
Type | Price Level |
Support #1 | $4,025–4,036 |
Support #2 | $3,970–3,980 |
Support #3 | $3,885–3,904 |
Resistance #1 | $4,074–4,082 |
Resistance #2 | $4,145–4,157 |
Resistance #3 | $4,187–4,227 |
Today's Questions (FAQ)
Why did hotter-than-expected CPI send gold down more than $100 so quickly?
The CPI surprise led markets to price in a 100% chance of a December Fed hike, with a possible increase of as much as 50 bps. The 10-year Treasury yield broke above 5.00% and the dollar strengthened rapidly. Investors sold gold as the opportunity cost of holding non-interest-bearing assets rose sharply.
How could Christopher Waller's hawkish stance affect gold from here?
Waller's stance suggests that curbing inflation remains the Fed's top priority, and the latest core CPI reading has already reached the threshold for considering a 50 bps hike, according to the source. Uncertainty about the size of any increase at the December meeting could limit the recovery and keep gold under pressure in the near term.
Read more
The above content was completed with the assistance of AI and has been reviewed by an editor.


