


Gold Price Forecast: Gold Holds Key $3,850 Support, US October Retail Sales May Drive Rebound Toward $4,000


TradingKey - As of the Asian session on Tuesday (November 17), gold (XAUUSD) maintained a weak rebound intraday today after recent continuous declines to a nearly one-year low, edging up 0.2% during the session to trade near $3,865. Previously, as the US dollar continued to strengthen, US Treasury yields remained high, and market expectations for a December Fed rate hike further heated up, gold remained under short-term pressure, falling to as low as $3,832.70 on Monday, its lowest since October 2025. Notably, US October retail sales data is due to be released today, which could become a key factor influencing the short-term trajectory of gold prices.
US Retail Sales Expected to Slow: Can It Ease Fed Rate Hike Pressure?
The market currently expects U.S. retail sales to increase by 0.2% month-over-month in October, significantly lower than September's 0.8%; retail sales excluding autos are projected to rise 0.4%, down from the prior reading of 0.9%. September retail sales previously posted strong performance, but part of the growth stemmed from rising gasoline prices; core retail sales—excluding autos, gasoline, building materials, and food services—grew by just 0.1%. This suggests that although headline retail sales growth was relatively strong, underlying consumer spending momentum did not accelerate across the board. As energy price fluctuations and the high-base effect of prior consumption growth gradually take effect, the market expects retail sales growth to moderate in October.
For gold, the key to this retail sales report lies in whether U.S. consumer demand remains resilient and whether the data can shift expectations for a Federal Reserve rate hike in December. Previously released U.S. CPI and PPI data for October showed that inflation pressures remain elevated, and several Fed officials have recently signaled hawkish stances. According to the CME FedWatch Tool, the market currently sees a 95.5% probability of the Fed raising rates by 25 basis points in December and a 4.5% probability of a 50-basis-point hike. Consequently, the U.S. dollar hit a new high since April 2025, while Treasury yields remained elevated, raising the opportunity cost of holding non-yielding gold and serving as a major reason for the recent continuous decline in gold prices.
If today's retail sales print comes in below expectations, especially with weak core retail sales, it could indicate that U.S. consumption growth momentum is slowing, thereby dampening market expectations for further Fed monetary tightening. In that scenario, the U.S. dollar and Treasury yields could retreat, paving the way for gold to rebound from recent lows. Conversely, if retail sales significantly exceed expectations and spending growth is not primarily driven by higher prices, it could reinforce the view that the U.S. economy remains resilient, further bolstering the Fed's hawkish stance and likely keeping gold prices under pressure. In addition, investors need to monitor the minutes of the Fed's October meeting, scheduled for release on Wednesday, to assess policymakers' attitudes toward the future rate-hike path.
Gold Price Technical Analysis
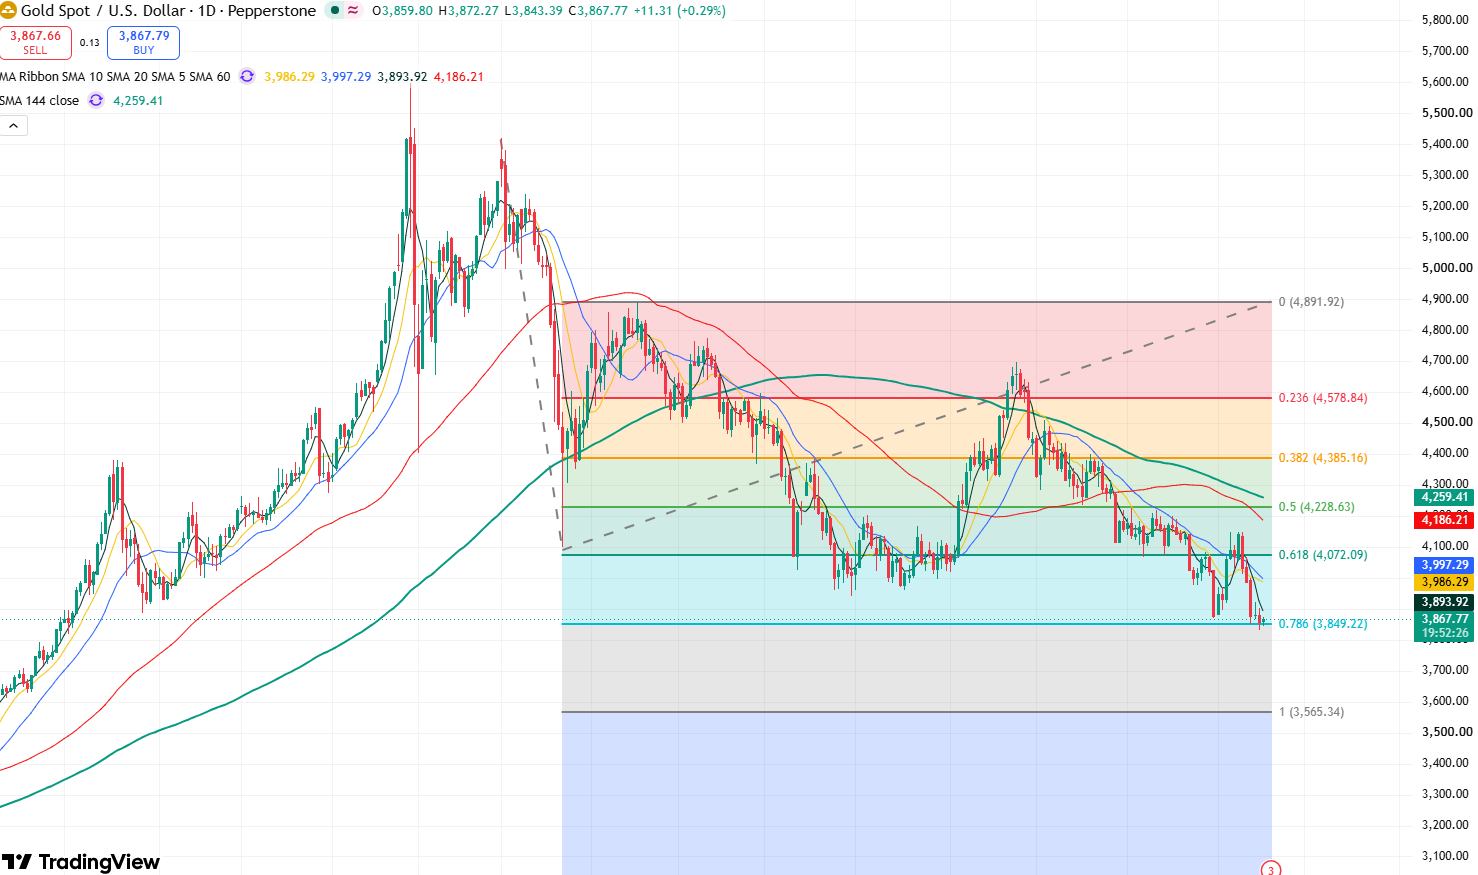
Gold price daily chart, Source: TradingView
From the daily chart, gold has continued its downward trend recently. After falling below the $4,000 and $3,900 marks last week, gold prices dropped further to $3,832.70 on Monday, hitting a new low in over a year and indicating that short-term downward pressure has not yet eased.
However, it is worth noting that gold closed at $3,856.46 on Monday, remaining firmly above $3,850. Meanwhile, this level corresponds to the 0.786 Fibonacci retracement level, indicating strong support and suggesting that gold prices could see a short-term rebound.
At present, the likelihood of a short-term rebound in gold prices outweighs that of a decline. If retail sales data released today falls short of expectations and pushes gold firmly back above $3,900, the next resistance level to watch is near $3,920, where the previous rebound stalled. If this level is breached, gold is expected to rebound further toward the $4,000 mark.
On the downside, the primary support level to watch is $3,850, followed by Monday's low of $3,832.70. If this level is lost, gold will test toward $3,800, or even experience a deeper pullback toward $3,550.
Read more
* The content presented above, whether from a third party or not, is considered as general advice only. This article should not be construed as containing investment advice, investment recommendations, an offer of or solicitation for any transactions in financial instruments.


