


Bitcoin lost its 200-day average — but the exit started three sessions before the CPI


Bitcoin is trading near $73,400, down about 2.5% on the day and roughly 11-week lows. The intraday low of $72,836 took it below its 200-day moving average near $73,100 for the first time since August.
The obvious explanation is Tuesday's inflation print. October CPI rose 0.4% against a 0.3% consensus, core rose 0.3% for a third straight month, and December hike odds moved to 89-100%. Higher real yields, stronger dollar, weaker non-yielding assets — gold fell 2.7%, Bitcoin fell 2.5%. Clean story.
Except the exits didn't start on Tuesday.
The 200-day break is the headline; the double top is the setup
The 200-day break matters for trend followers, but the structure that produced it was already visible a week earlier.
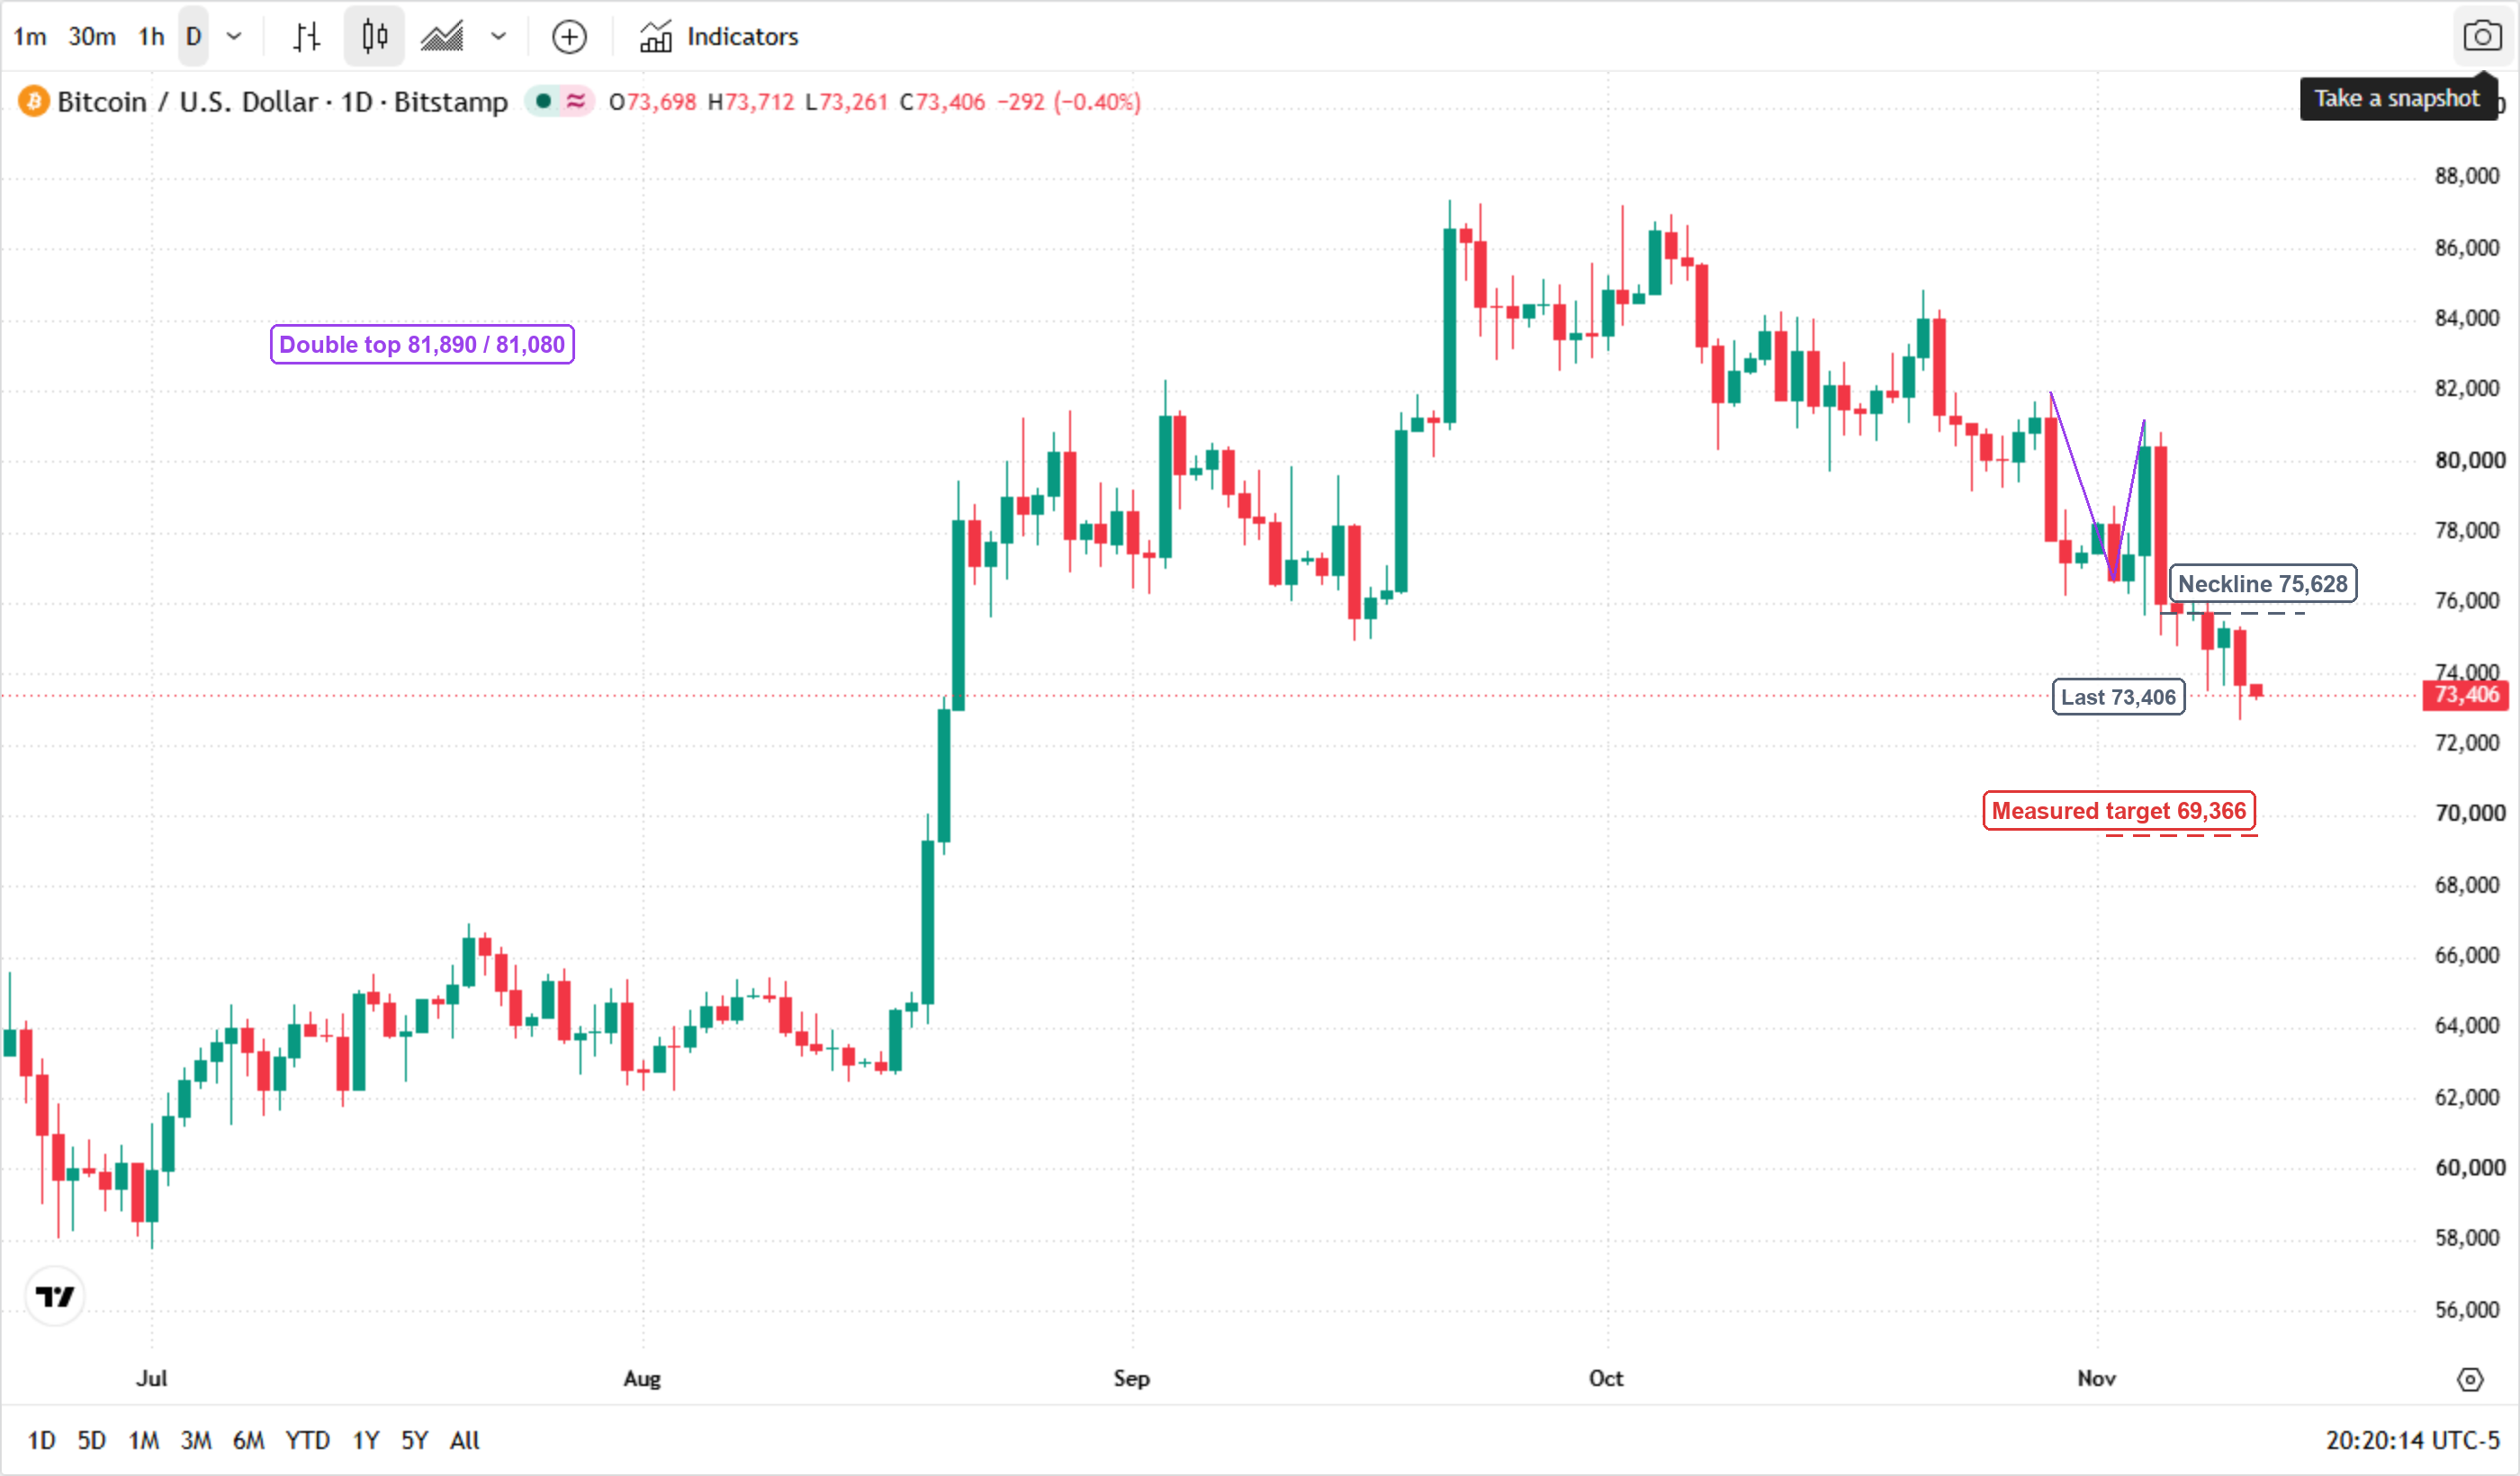
Bitcoin put in a high of 81,890 on 29 October, pulled back, then made a second high of 81,080 on 4 November. Two peaks within 0.99% of each other, six sessions apart, with a 6.7% drawdown between them. That is a textbook double top — and the neckline at 75,628, the low of that 4 November session, broke on 5 November.
81,890 then 81,080: the lower second peak
The second peak never quite reached the first. That matters because a double top that fails to make a higher high is what a market looks like when buyers are still present but no longer dominant.
The measured move from that pattern is 69,366 — the neckline minus the height of the pattern (75,628 minus 6,262). That is where the chart says the next test sits, provided price stays below the neckline.
The break happened before the data, not after
This is the part the headline misses. The neckline broke on 5 November, five days before the CPI release. By the time inflation data hit on 10 November, Bitcoin was already 5% below its second peak.
Tuesday's move accelerated an existing structure. It did not create one.
$705 million of longs, and $6.6 billion of USDT that left first
The liquidation numbers confirm how much leverage was stacked against that neckline.
Over 24 hours, roughly $632 to $705 million in crypto positions were liquidated, with about 82% of it long — some 117,988 traders were closed out. Bitcoin longs accounted for $150 to $169 million and ETH longs about $240 million; the largest single liquidation was a $31.5 million ETH-USDT contract on HTX.
The leverage came out before the data did
Read those numbers alongside the flow data and the sequence becomes clear:
Spot Bitcoin ETF outflows ran for a third straight session, with about $201 million leaving on 9 November, after $1.28 billion the previous week. BlackRock's IBIT alone shed $213 million.
USDT's market cap has contracted by $6.6 billion over 60 days — a shrinkage more than twice the size of the post-FTX period. Stablecoin supply is the dry powder of crypto; it does not shrink when buyers are waiting.
Spot trading volume is at its lowest since 2016. Thin books turn a modest sell order into a 2.5% day.
So the ordering is: stablecoin supply shrank, ETFs bled, leverage got liquidated, and the index price finally broke. The CPI was the trigger for the last leg, not the cause of the move.
* Chart source: TradingView (Bitcoin / U.S. Dollar, Bitstamp, daily)
Where the double top measures next
The chart now carries the whole scenario, so there is only one condition to state: a daily close back above 75,628 would invalidate the pattern and put the 200-day average back in play as support. Everything below that level keeps the 69,366 measured target live.
Two things would make that invalidation more likely than the target:
Stablecoin supply stabilising. If USDT's market cap stops contracting, the marginal seller from the leverage flush is gone. That is a slower signal than price, but it leads it.
ETF flows turning. Three sessions of outflows is a wobble; a fourth week is a regime. The 12.8 billion dollars that left in the week to 7 November is the number to beat.
And one thing that argues the other way: December hike odds at 89-100% leave little room for a dovish surprise. A hot PPI on Friday 13 November would push real yields higher again, and Bitcoin at $73,400 is now trading 16.5% below where it started the year with its 200-day average overhead rather than underneath.
Read more
Before making any trading decisions, it is important to equip yourself with sufficient fundamental knowledge, have a comprehensive understanding of market trends, be aware of risks and hidden costs, carefully consider investment targets, level of experience, risk appetite, and seek professional advice if necessary.
Furthermore, the content of this article is solely the author's personal opinion and does not necessarily constitute investment advice. The content of this article is for reference purposes only, and readers should not use this article as a basis for any investment decisions.
Investors should not rely on this information as a substitute for independent judgment or make decisions solely based on this information. It does not constitute any trading activity and does not guarantee any profits in trading.
If you have any inquiries regarding the data, information, or content related to Mitrade in this article, please contact us via email: insights@mitrade.com. The Mitrade team will carefully review the content to continue improving the quality of the article.


