


US October PPI Preview: Fed Rate Hike Expectations Rise, PPI May Be Key Variable; How Will US Stocks, Dollar, and Gold Move?

TradingKey - On Friday (Nov. 13) Eastern Time, the U.S. will release the October Producer Price Index (PPI). Following the October CPI once again exceeding expectations, the market will look to the PPI to further gauge whether U.S. producer price pressures are spreading, as well as the likelihood of the Federal Reserve raising interest rates by 25 basis points or 50 basis points in December.
October PPI MoM May Cool Significantly, but Inflation Pressures Not Yet Relieved
According to a Dow Jones survey, headline PPI is expected to rise 0.4% month-over-month in October, cooling significantly from 1.3% in September. Core PPI, which excludes food and energy, is expected to increase 0.3% month-over-month, down from 0.7% in September. However, driven by base effects, headline PPI year-over-year growth is projected to climb further from 6.3% to 6.6%, reaching one of the higher levels since late 2022, while core PPI is expected to be around 5.0% year-over-year.
Looking at the September PPI data, the sharp increase was largely driven by energy prices. Final demand PPI rose 1.3% month-over-month in September, the largest monthly gain since March 2022, and was up 6.3% year-over-year. Within the reading, prices for final demand goods rose 2.6%, with energy prices surging 10.8%, while gasoline and diesel fuel prices rose 20.3% and 21.0%, respectively. However, services prices also rose 0.8%, and the PPI excluding food, energy, and trade services climbed 0.5%, indicating that production-side inflation was not entirely derived from energy.
Entering October, energy price pressures eased compared with September. Calculated based on the PPI's primary price collection window, WTI crude oil prices fell by about 10.9% compared to the corresponding period in September, while Brent crude dropped by approximately 3.8%, representing a key reason the market expects headline PPI to pull back sharply from 1.3% to 0.4% month-over-month.
However, this does not mean U.S. inflation pressures have noticeably improved. The recently released October CPI rose 0.4% month-over-month, topping market expectations of 0.3%; core CPI rose 0.3%, also beating the 0.2% forecast, with shelter, food, transportation, and certain goods prices all continuing to rise. Following the data release, U.S. Treasury yields and the U.S. dollar moved notably higher, further reinforcing market expectations for a Federal Reserve rate hike in December.
For investors, the real focus of this PPI release is on core prices and services categories. If headline PPI pulls back due to cooling energy but core PPI still reaches 0.3% or higher, while categories such as healthcare, financial services, and trade margins remain strong, the market may perceive that inflation is spreading from energy into broader areas. In addition, certain PPI subcomponents feed directly into the calculation of the Fed's favored PCE price index, meaning these details may be even more important than the headline data itself.
According to the CME FedWatch Tool, the market has essentially fully priced in a Fed rate hike in December. As of November 12, interest rate futures implied an approximately 90.8% probability of a 25-basis-point rate hike in December and an approximately 9.2% probability of a 50-basis-point hike. Fed Governor Waller previously stated that he supports at least a 25-basis-point rate hike in December and suggested that a larger increase should be considered if inflation continues to show strength.
Therefore, if October PPI comes in noticeably higher than 0.4% and core PPI reaches 0.4% or higher, the market may further raise the probability of a 50-basis-point hike. Conversely, if both headline and core PPI come in below expectations, it could ease the recently rapid buildup in hawkish pricing. However, with CPI having already exceeded expectations, a softer PPI report may still not be sufficient to completely alter the baseline expectation for a December rate hike.
How Will October PPI Data Impact US Stocks, the Dollar, and Gold?
Regarding U.S. equities, if the October PPI—particularly core PPI—comes in significantly higher than expected, the market may further raise the probability of an aggressive Fed rate hike in December. U.S. Treasury yields face continued upside risks, which would weigh on high-valuation sectors such as the Nasdaq, AI, and semiconductors. Recently, the 10-year U.S. Treasury yield has approached 5% again, with rising interest rates placing a clear constraint on tech valuations. If month-over-month PPI falls to 0.3% or even lower, accompanied by cooling core prices, it would help ease concerns over a 50-basis-point rate hike, and a pullback in Treasury yields could provide room for growth stocks to recover.
Regarding the U.S. dollar, the greenback is currently supported by strong inflation and hawkish Fed expectations. On November 12, the U.S. Dollar Index touched 103.02, hitting its highest level since April 2025. If the PPI tops expectations again, especially if core and services prices remain resilient, the market may further bet on more aggressive policy tightening by the Fed, and the U.S. interest rate advantage will continue to support the dollar. If the PPI comes in significantly below expectations, it could weaken trades betting on a 50-basis-point rate hike, leaving room for a temporary pullback in the dollar.
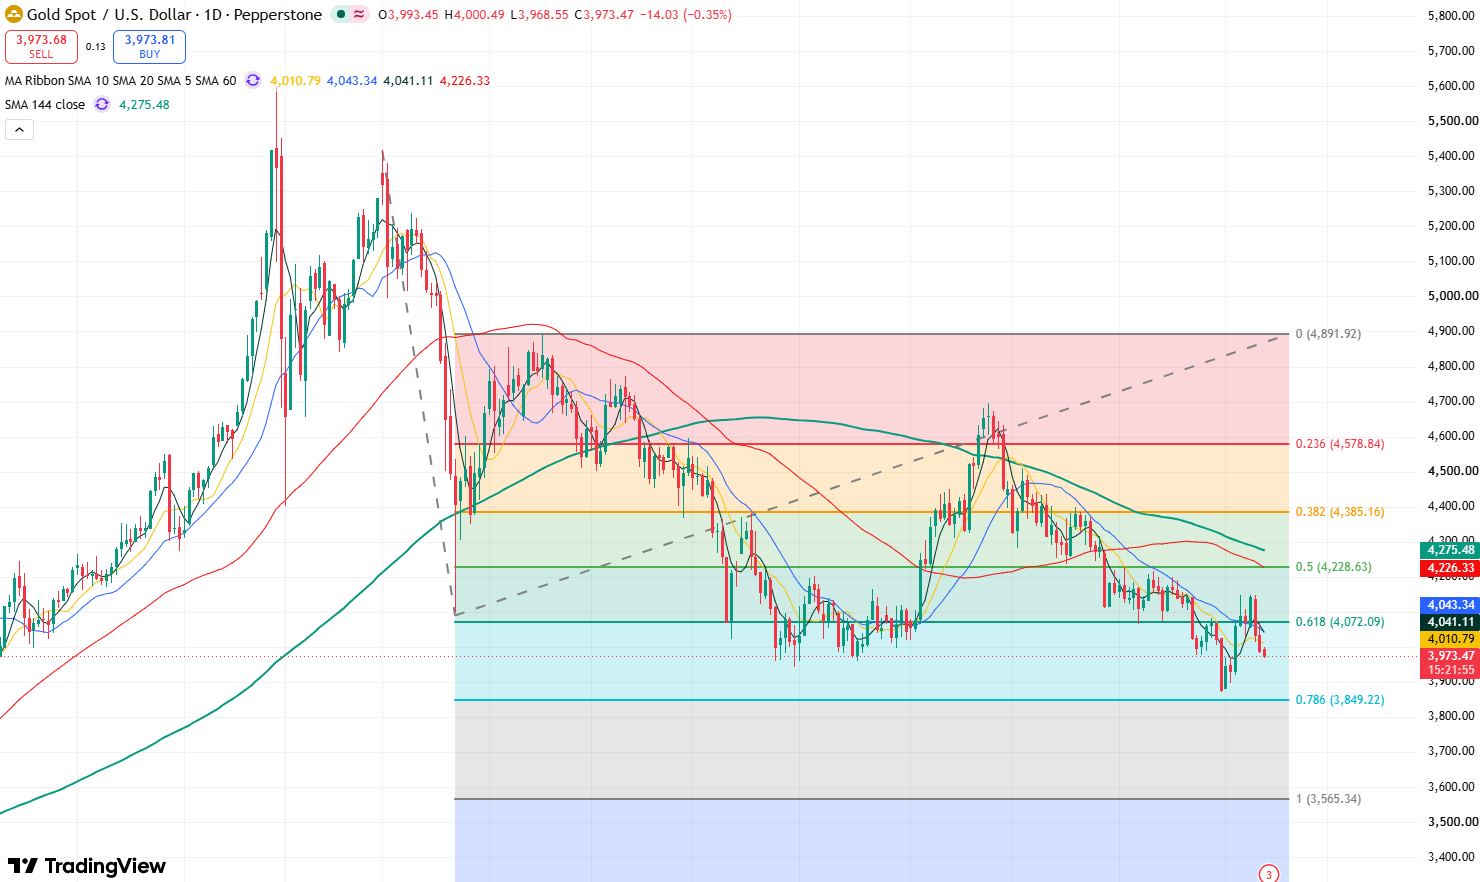
Gold Price Daily Chart, Source: TradingView
Regarding gold (XAUUSD), gold fell to $3,875 on November 12, hitting a more than one-week low, with a strong dollar and rate-hike expectations serving as the primary headwinds. If the PPI comes in higher than expected, further strength in real U.S. Treasury yields and the dollar could keep gold under pressure, potentially continuing to test support near $3,880. If producer-side inflation cools significantly and the market dials back expectations of an aggressive rate hike, it could push the dollar and yields lower, creating conditions for a gold rebound, with the potential to climb back above $4,000 and further test resistance around $4,150.
Read more
* The content presented above, whether from a third party or not, is considered as general advice only. This article should not be construed as containing investment advice, investment recommendations, an offer of or solicitation for any transactions in financial instruments.


