


Core CPI stuck at 0.3% for a third straight month — and BLS couldn't publish the number that would explain it

October CPI came in at 0.4% month on month against a 0.3% consensus. Core, which strips food and energy, printed 0.3% against 0.2% expected — the third consecutive month at exactly 0.3%.
Then the detail that matters more than either headline: the Bureau of Labor Statistics published no year-on-year figure at all. October 2025 price collection was lost to the government shutdown, so there is no base to compare against. The last annual reading anyone has is September's 3.7%.
So the market spent Tuesday pricing a number it could not fully see, and it repriced the short end of the curve accordingly.
The 0.4% wasn't energy — energy cooled to 0.7%
For two years the story of US inflation was oil. That story is over, at least for this month.
Energy rose 0.7% in October, down from 5.2% in September. Gasoline added 1.0%, electricity 0.9%, and natural gas actually fell 0.8%. If energy had simply held September's pace, headline CPI would have been far hotter than 0.4%.
What replaced it is slower-moving and harder to argue away.
Shelter did more than a third of the work
Shelter rose 0.3% and accounted for more than 30% of the monthly increase. Rent added 0.2%, owners' equivalent rent 0.3%. Food rose 0.5%, split almost evenly between groceries (+0.4%) and restaurants (+0.5%).
Shelter is the single largest weight in the index and the slowest to turn. It is also the component most directly tied to the policy rate — which is why a 0.3% monthly print in shelter keeps core pinned at 0.3% even as goods deflate.
Transport services at 0.8% is the number the Fed can't wave through
Transportation services rose 0.8%, motor vehicle insurance 0.7%, medical care 0.3%. Against that, used cars and trucks fell 1.2% and communication slipped 0.1%.
That split is the whole argument in one line: goods are still deflating, services are not. A central bank can look past a used-car discount. It cannot look past insurance and transport services running at three times the target pace, month after month.
The 2-year moved 21bp. The 10-year moved 12.
Here is where the market's reaction becomes informative rather than merely large.
The 2-year Treasury yield jumped 18 to 21 basis points — the biggest single-day move since the April 2025 tariff shock. The 10-year added about 12 basis points to 4.983%, having touched 5.021% intraday. The 30-year reached roughly 5.30%.
Short end up twice as much as the long end is not a inflation-expectation move. It is a policy-path move: the market revised how many more hikes are coming, not how high inflation settles in 2031.
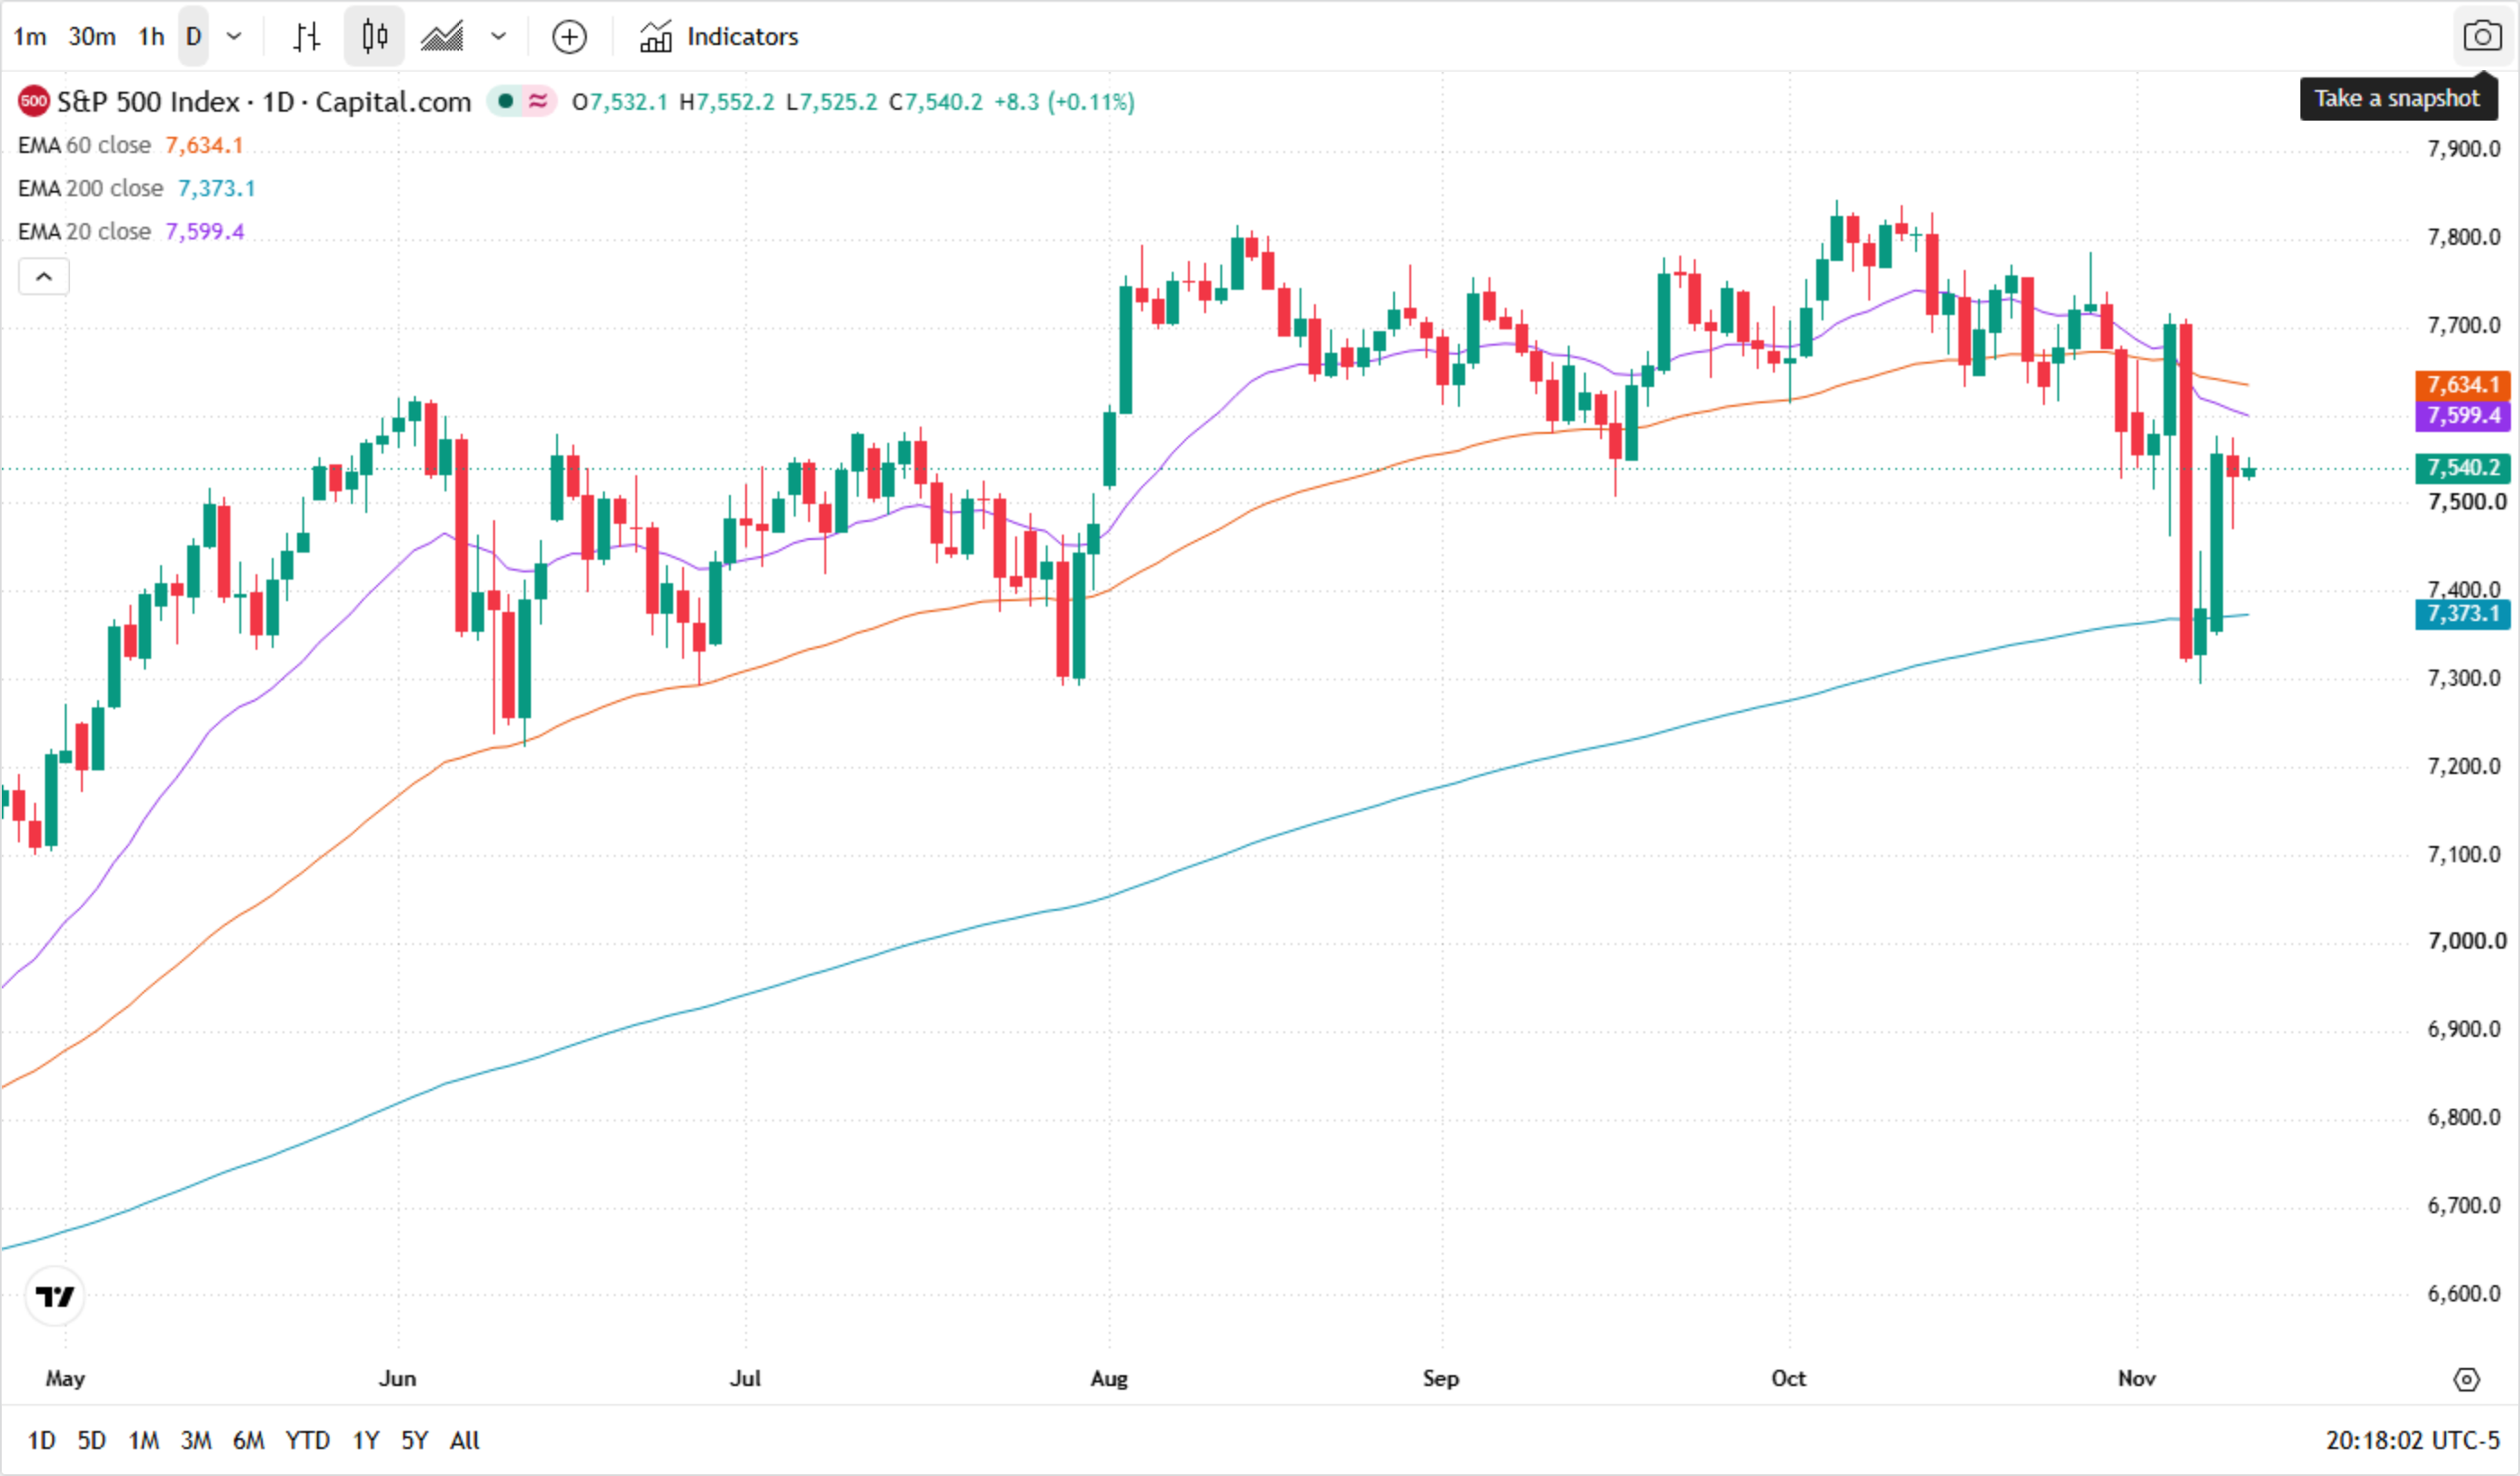
* Chart source: TradingView (S&P 500 CFD, Capital.com, daily)
A policy-path repricing, not an inflation-expectation repricing
Fed Governor Waller, speaking before the data, said a 0.3% core print would make him consider a 50 basis point move in December. Dallas Fed's Logan argued for at least two more 25bp hikes. The Fed hiked 25bp in September and held in October.
Pricing now sits at 89% to 100% for a 25bp hike on 8-9 December, with roughly 10-15% odds of 50bp. The dollar closed up 0.7% at 102.25 and gold fell 2.7% — both consistent with real yields rising, not with a growth scare.
The equity reaction was correspondingly modest: S&P 500 -0.38% to 7,520.93, Nasdaq -0.74%, Dow -0.30%. The index is still above its 200-day average near 7,373, which tells you the market is repricing the discount rate, not abandoning the earnings story.
Why the missing annual number makes 13 November bigger
Because BLS cannot publish a year-on-year rate, the next inflation signal arrives with October PPI on Friday 13 November. Producer prices are not a substitute for CPI, but they are the only fresh upstream reading before the December meeting — and with energy cooling, the pipeline question is whether services and tariff-related input costs are still climbing.
Three things to watch, in order:
12 November — Treasuries reopen. Wednesday 11 November is Veterans Day: the bond market is closed while NYSE and Nasdaq trade. That means Tuesday's repricing has not yet been tested by a full cash session. If the 10-year holds above 4.95% once dealers are back, the move was conviction. If it fades, it was positioning.
13 November — October PPI. The CPI print told us services are sticky. PPI tells us whether that stickiness is still building upstream or already peaking.
8-9 December — FOMC. The market has moved from "whether" to "how much". A 25bp hike is close to fully priced; the risk to asset prices is a 50bp outcome, which Waller has now put explicitly on the table.
The cleanest way to read this week: inflation stopped being an oil story and became a shelter-and-services story, and the Fed's reaction function repriced from the front end. If you are watching one level to judge whether that repricing sticks, it is the 10-year at 4.95% once the bond market reopens on Thursday.
Read more
* The content presented above, whether from a third party or not, is considered as general advice only. This article should not be construed as containing investment advice, investment recommendations, an offer of or solicitation for any transactions in financial instruments.


