


Silver Price Falls Below $50 to Hit Near One-Year Low: Why Is Silver Falling?

TradingKey - As of the Asian session on Monday (November 16), silver prices (XAGUSD) extended their recent decline, falling for the third consecutive trading day and dropping nearly 3% intraday to trade near $47.40, hitting a fresh low in nearly a year. Silver fell 6.18% cumulatively last week, losing the key $50 psychological level, as mounting expectations of further Fed rate hikes drove the U.S. dollar and Treasury yields higher, keeping silver prices under sustained pressure.
The recent sustained decline in silver has been primarily driven by U.S. inflation pressures and shifting expectations for Federal Reserve monetary policy. U.S. October CPI rose 0.4% month-over-month, higher than market expectations of 0.3%. Although the newly released October PPI rose only 0.3% month-over-month, below the expected 0.4%, its year-over-year increase still reached 6.5%, indicating that producer-level inflation pressures remain elevated. Fed officials have also continued to deliver hawkish signals, with Kansas City Fed President Schmid stating that inflation remains too high. According to the CME FedWatch tool, the market prices in an approximately 90.8% probability of a 25-basis-point rate hike by the Fed in December and an approximately 9.2% probability of a 50-basis-point hike, reflecting strong expectations for further monetary policy tightening.
Driven by this, the U.S. dollar remained near its highest level since April 2025, and the 10-year U.S. Treasury yield climbed back above 5%, briefly touching near 5.16% last week. A stronger dollar raises the cost of silver for non-dollar investors, while higher Treasury yields, especially real yields, increase the opportunity cost of holding non-yielding silver.
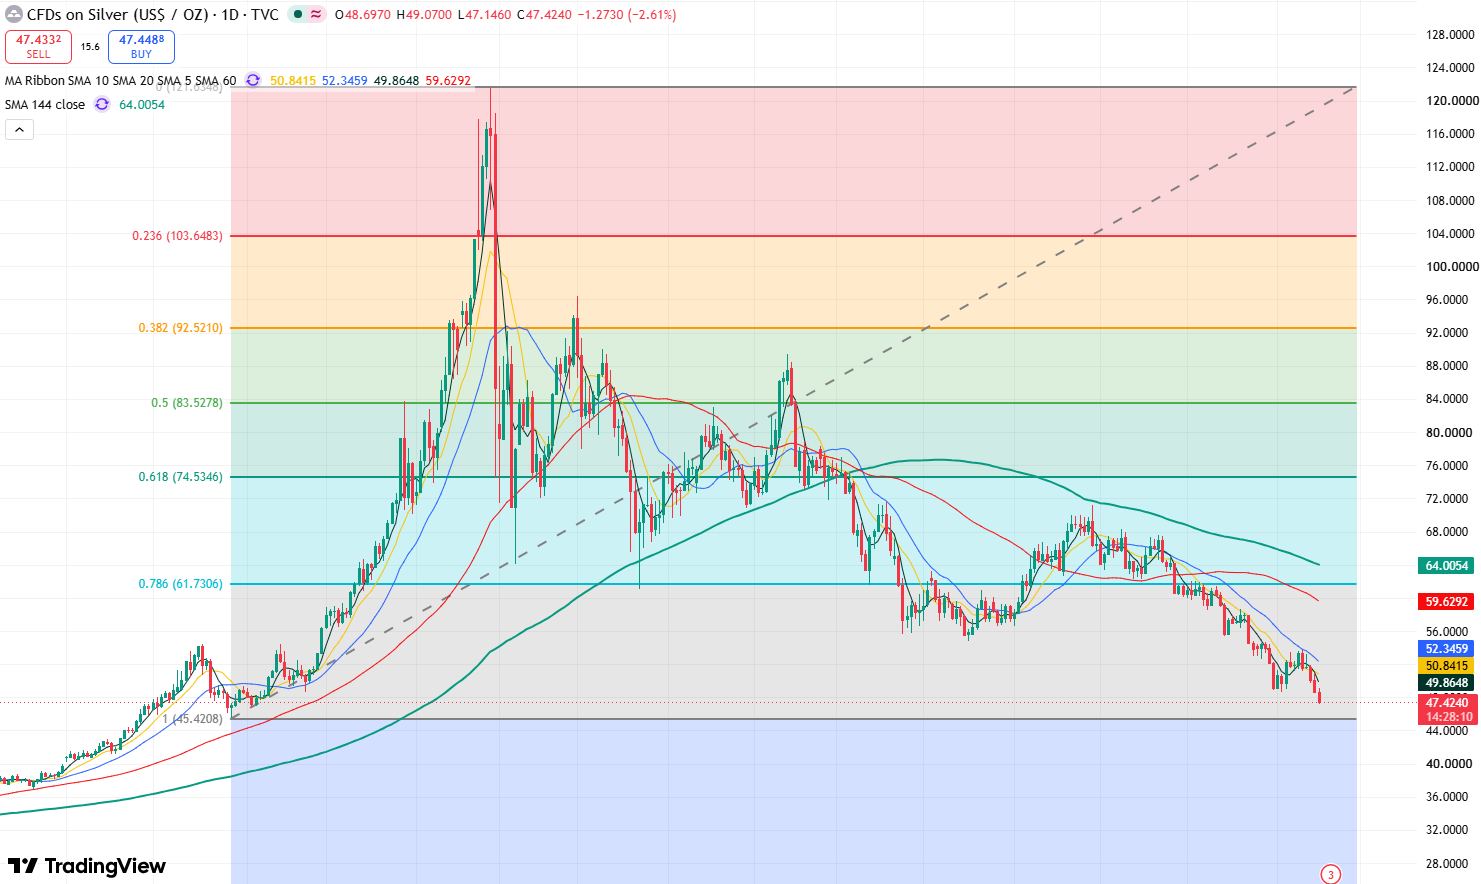
Silver price daily chart, Source: TradingView
From the daily chart of silver, as the highs and lows of the candlestick pattern continue to shift downward, and after silver broke below the November 3 low of $48.61 last week, further downside room has opened up, indicating that the short-term downtrend remains intact.
In terms of technical indicators, the Relative Strength Index (RSI) stands at 30.25, approaching oversold territory, which indicates heavy short-term selling pressure, though a technical rebound is also possible after consecutive declines. However, an oversold condition does not mean the downtrend has ended until prices break back above short-term moving averages.
At present, silver prices may continue to decline in the short term. The primary downside target will be to test the support level near $45. If this level is lost, silver will pull back further toward the $40 mark.
To the upside, the primary resistance to watch is the $48–$48.8 area. If silver breaks above this level, the next resistance to monitor is near $50. Only when silver firmly regains ground above $50 will short-term downward pressure be significantly alleviated.
Read more
* The content presented above, whether from a third party or not, is considered as general advice only. This article should not be construed as containing investment advice, investment recommendations, an offer of or solicitation for any transactions in financial instruments.


