


S&P 500 Forecast: Index Poised to Retest Record High in November After 500-Point Pullback, Biggest Daily Gain in Nearly Seven Months
TradingKey - On November 9, Eastern Time, U.S. stocks rebounded sharply following a significant pullback the previous week. The S&P 500 rose 2.35% to close at 7,549.94, marking its largest single-day gain since April 8; the Dow Jones Industrial Average climbed 2.15% to 52,389.75, and the Nasdaq Composite advanced 2.74% to 25,253.14. Technical analysis indicates that the medium- to long-term trend for the S&P 500 remains bullish.
Oversold Tech Stocks Rebound as Oil Slump Eases Inflation Concerns
From a fundamental perspective, the primary driver behind Monday's broad rally in U.S. stocks was the sharp drop in oil prices. After U.S. President Donald Trump downplayed the possibility of launching military strikes against Iran again, crude oil prices fell rapidly, and retreating energy costs partially eased market concerns over reigniting inflation. Following the previous week's most pronounced weekly correction for the S&P 500 and the Nasdaq since April 2025, risk appetite subsequently staged a recovery.
A rebound in the technology and semiconductor sectors further amplified index gains. The Philadelphia Semiconductor Index rose 6.85% on Monday, with AMD (AMD) surging 13.26% and Broadcom (AVGO) climbing 8.78%. Previously, AI-related stocks had fallen consecutively amid concerns over data center regulation, returns on capital expenditures, and valuations. However, both Morgan Stanley and UBS recently noted that the prior pullback in select AI stocks was excessive, driving some capital back into the tech sector. Nvidia (NVDA), meanwhile, bucked the trend to fall 4.27%, weighed down by an investigation related to its CEO.
Overall, institutions remain notably divided on the future trajectory of the S&P 500. Morgan Stanley recently noted that the current market correction may have entered its late stages, but in the near term, the S&P 500 could still retest the 7,100–7,300 range before potentially resuming its year-end upward trend. Meanwhile, its published year-end 2026 target remains at 8,000 points. Both Goldman Sachs and JPMorgan Chase expect the S&P 500 to reach 8,000 points, while UBS Global Research and Citigroup have set targets of 8,100 points. In contrast, Bank of America forecasts 7,400 points, and Wells Fargo projects 7,700 points.
S&P 500 Index Technical Analysis
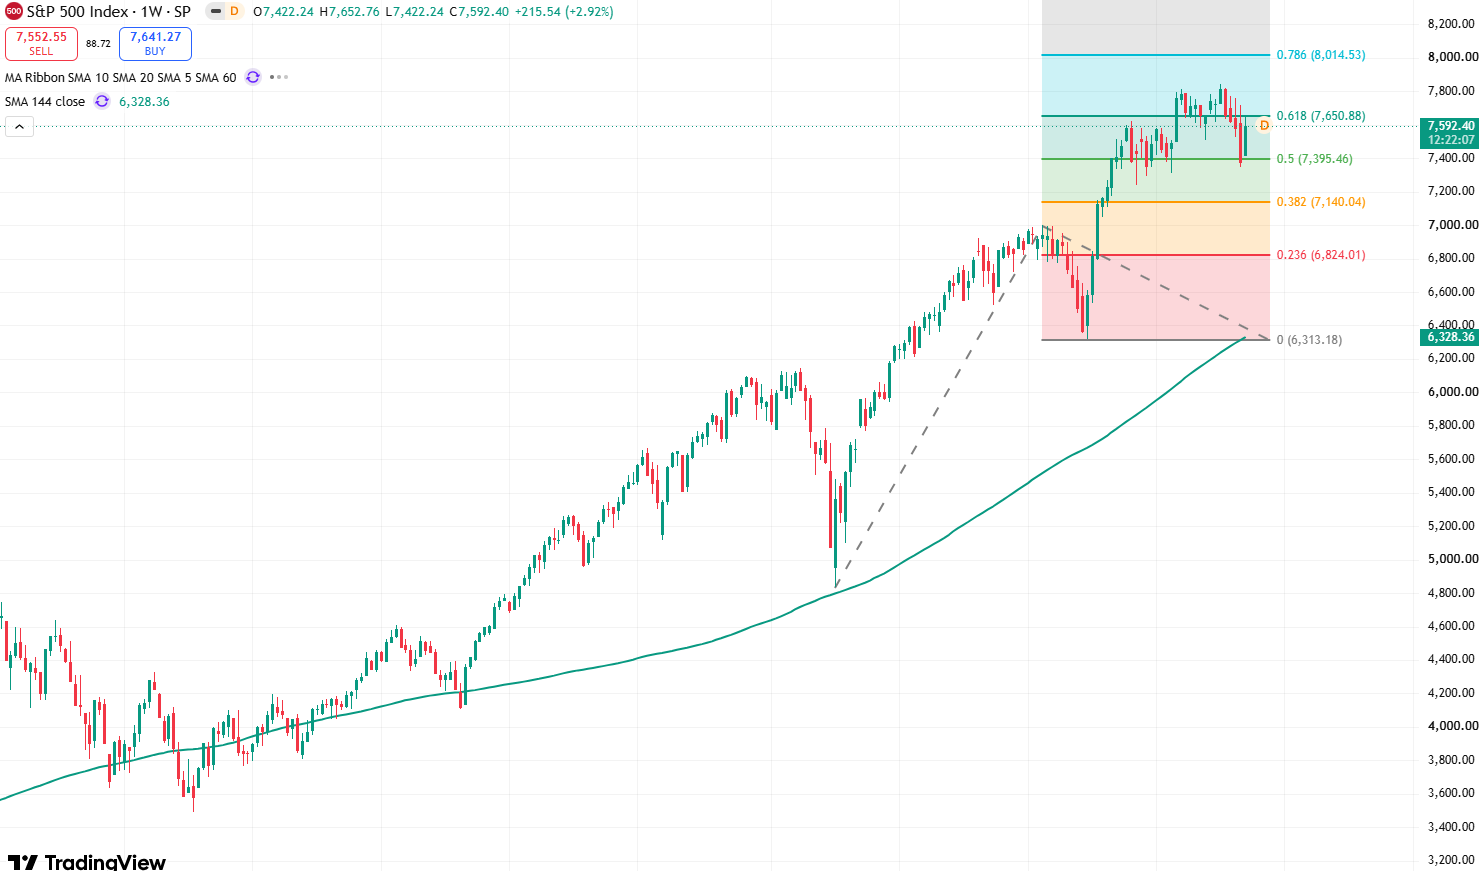
S&P 500 weekly chart, Source: TradingView
From the weekly chart of the S&P 500, a 2.35% surge on Monday helped the index reclaim the 7,500 round-number mark and close at 7,549.94. After previously dropping to near 7,350, the index has recovered part of its earlier losses, and its short-term price structure has improved significantly compared to last week.
Looking at the overall trend, the 60-week and 144-week moving averages on the weekly chart have consistently maintained a bullish alignment, indicating that the medium- to long-term trend for the S&P 500 remains bullish.
On the upside, the initial level to watch is near 7,600. If the index breaks and holds above this level, the next range to watch is 7,700–7,715. Only a decisive breakout and consolidation above 7,715 would open the door to challenge the previous all-time high of 7,844.52, or even push further toward 8,000.
On the downside, initial support lies at 7,500. If the index falls back below 7,500 in the short term, attention will turn to the 7,350–7,400 zone, which sits near the key low formed during the previous pullback. If this level fails to hold, the index could slide further toward around 7,200.
Recommended Articles


