

Ripple Price Forecast: XRP risks losing $1.00 support as 24-hour liquidations hit $20 million

Source Fxstreet
  • XRP corrects and trades around $1.00 amid growing selling pressure and technical weakness.
  • XRP derivatives hit hard, with 24-hour liquidations exceeding $20 million.
  • XRP remains heavily oversold with a negative MACD indicator, but recovery prospects seem limited.

Ripple (XRP) remains on edge, trading around $1.00 on Friday. The remittance token’s sharp decline has persisted since November 5, initially triggered by the $6.3 billion Binance hack and later accentuated by the United States (US) midterm elections.

The US Consumer Price Index (CPI) report released earlier this week showed inflation increased mildly, reinforcing broad expectations that the Federal Reserve (Fed) will hike interest rates in December.

XRP liquidations weigh on price action

Appetite for digital assets remains significantly weak, as reflected in the Fear & Greed Index, which held at 20 in Extreme Fear territory on Friday, down from 28 the previous day. This outlook aligns with the ongoing sell-off in the broader crypto market and in XRP derivatives.

CoinGlass data shows that 24-hour liquidations average over $20 million, mostly in long positions. Only $1.2 million in short positions has been liquidated over the period, indicating that bulls are taking the biggest hit. Persistent liquidations could put more pressure on XRP, as more traders are forced to close their positions.
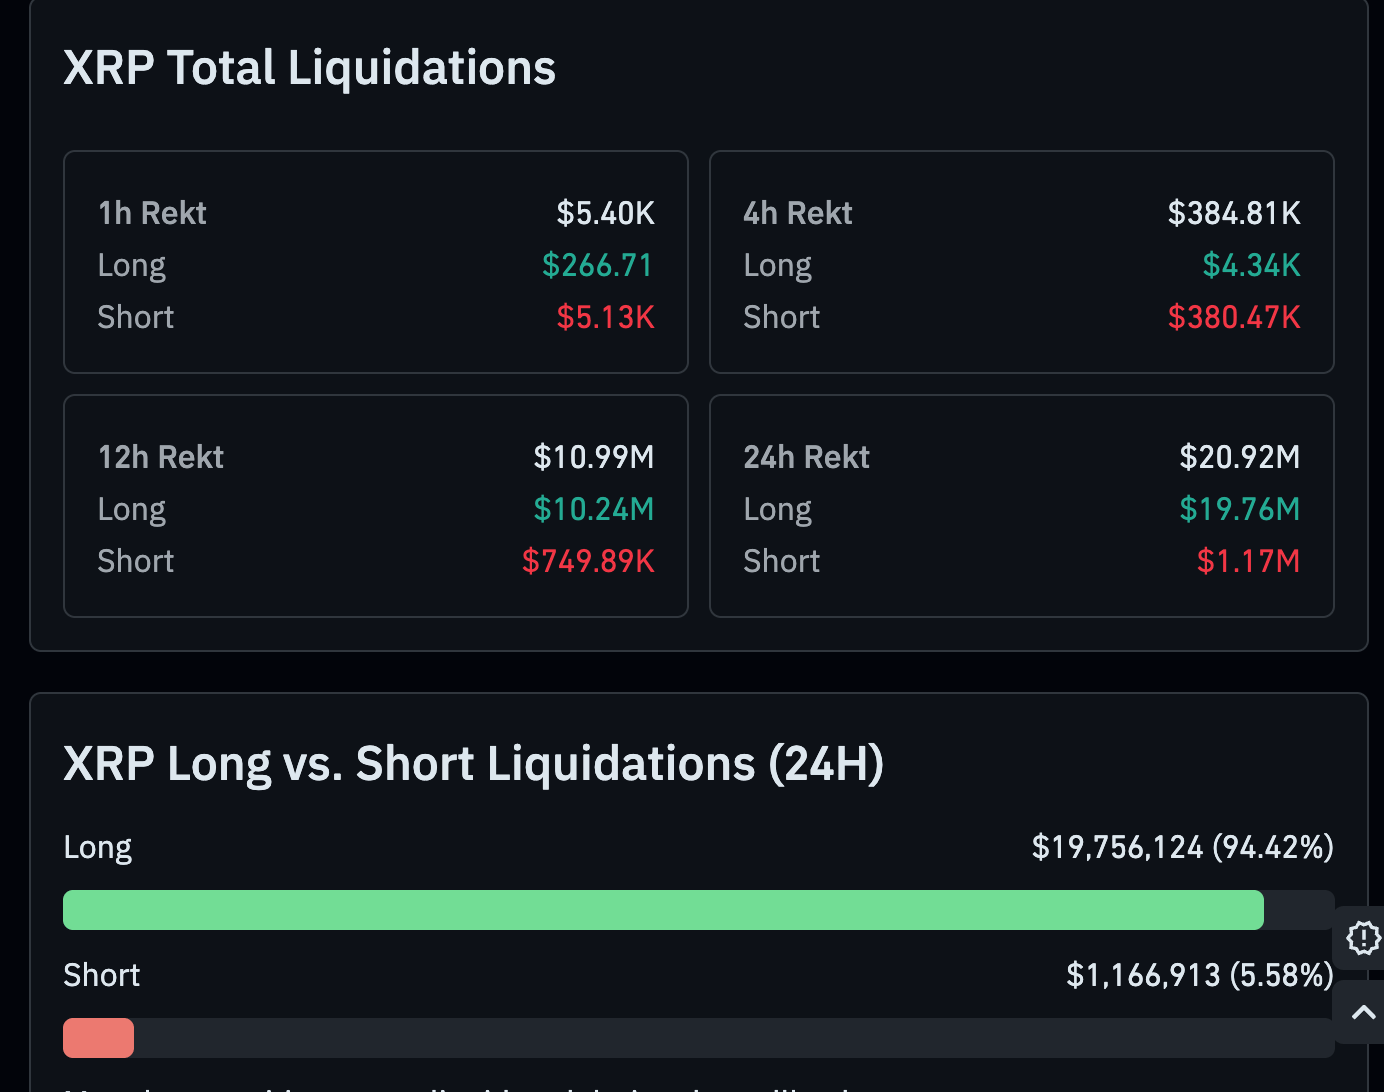
XRP liquidations | Source: CoinGlass

Technical analysis: XRP falters as sellers gain ground

XRP trades at $1.03, extending a clear bearish bias as price holds well beneath the short- and long-term Exponential Moving Averages (EMAs) and the active SuperTrend line. A dense overhead structure is pressing the pair lower, with the 10-day SuperTrend at $1.19 leading a series of exponential moving averages, including the 50-day EMA at $1.26, the downward resistance trendline break level at $1.27, the 100-day EMA at $1.29, and the 200-day EMA at $1.34.

Momentum conditions reinforce the downside tone, as the Moving Average Convergence Divergence (MACD) remains in negative territory with a weak profile, while the Relative Strength Index (RSI) at 22 slips deep into oversold territory, hinting that while pressure is strong, the market is vulnerable to short-lived corrective bounces rather than a sustained recovery for now.

Chart Analysis XRP/USDT (Binance)
XRP/USDT daily chart

With no meaningful support levels defined below the current price in the current dataset, the focus stays on the pivotal $1.00 demand area and, on the topside, the initial recovery hurdle at the SuperTrend barrier around $1.19. A daily close above this level would be needed to ease immediate selling pressure, exposing the 50-day EMA at $1.26 and the nearby descending trendline resistance at $1.27 as the next caps.

Further up, the 100-day EMA near $1.29 and the 200-day EMA around $1.34 compose a broader medium-term resistance band that would likely limit any rebound, keeping the overall structure bearish as long as XRP trades below this cluster.

(The technical analysis of this story was written with the help of an AI tool. Know more.)

Cryptocurrency metrics FAQs

The developer or creator of each cryptocurrency decides on the total number of tokens that can be minted or issued. Only a certain number of these assets can be minted by mining, staking or other mechanisms. This is defined by the algorithm of the underlying blockchain technology. On the other hand, circulating supply can also be decreased via actions such as burning tokens, or mistakenly sending assets to addresses of other incompatible blockchains.

Market capitalization is the result of multiplying the circulating supply of a certain asset by the asset’s current market value.

Trading volume refers to the total number of tokens for a specific asset that has been transacted or exchanged between buyers and sellers within set trading hours, for example, 24 hours. It is used to gauge market sentiment, this metric combines all volumes on centralized exchanges and decentralized exchanges. Increasing trading volume often denotes the demand for a certain asset as more people are buying and selling the cryptocurrency.

Funding rates are a concept designed to encourage traders to take positions and ensure perpetual contract prices match spot markets. It defines a mechanism by exchanges to ensure that future prices and index prices periodic payments regularly converge. When the funding rate is positive, the price of the perpetual contract is higher than the mark price. This means traders who are bullish and have opened long positions pay traders who are in short positions. On the other hand, a negative funding rate means perpetual prices are below the mark price, and hence traders with short positions pay traders who have opened long positions.

Disclaimer: For information purposes only. Past performance is not indicative of future results.
placeholder
Gold Price Analysis Today | Forex Gold Analysis | XAU/USD Analysis - November 11, 2026Get the latest gold price analysis, forex gold insights, and XAU/USD analysis for November 11, 2026. Read on for the details.
Author  Mitrade
Nov 11, Wed
Get the latest gold price analysis, forex gold insights, and XAU/USD analysis for November 11, 2026. Read on for the details.
placeholder
Bitcoin lost its 200-day average — but the exit started three sessions before the CPIBitcoin fell 2.5% to about $73,400 on 11 November, an 11-week low, breaking its 200-day moving average near $73,100. The 24-hour liquidation tally reached $632 to $705 million, roughly 82% of it longs. But spot ETF outflows began three sessions earlier and USDT's market cap has shrunk $6.6 billion in 60 days — the leveraged length left before the inflation print did. A double top at 81,890 and 81,080 leaves a measured target of 69,366.
Author  Suzie
Nov 11, Wed
Bitcoin fell 2.5% to about $73,400 on 11 November, an 11-week low, breaking its 200-day moving average near $73,100. The 24-hour liquidation tally reached $632 to $705 million, roughly 82% of it longs. But spot ETF outflows began three sessions earlier and USDT's market cap has shrunk $6.6 billion in 60 days — the leveraged length left before the inflation print did. A double top at 81,890 and 81,080 leaves a measured target of 69,366.
placeholder
Nvidia slid 7.7% after hours while AMD and Broadcom rose — the AI trade changed hands, it didn't breakNvidia closed Wednesday at 173.73, up 2.87%, then fell as much as 8.1% to 159.44 after reports that its board was preparing for a possible leadership change. The same session, the Philadelphia Semiconductor Index rose 5.7% with all 30 components higher, CoreWeave jumped 24.7% on 168% revenue growth, and Micron added 11.9%. If AI demand were being repriced, AMD and Broadcom would not be bid. This is a governance discount on one name, and 204.54 — the 200-day average — is the level that settles it.
Author  Irene Q.
Nov 12, Thu
Nvidia closed Wednesday at 173.73, up 2.87%, then fell as much as 8.1% to 159.44 after reports that its board was preparing for a possible leadership change. The same session, the Philadelphia Semiconductor Index rose 5.7% with all 30 components higher, CoreWeave jumped 24.7% on 168% revenue growth, and Micron added 11.9%. If AI demand were being repriced, AMD and Broadcom would not be bid. This is a governance discount on one name, and 204.54 — the 200-day average — is the level that settles it.
placeholder
Gold hit a one-year low while central banks bought 321 tonnes — the sellers were never the ones you thinkSpot gold closed at 3,876 on Thursday, down 2.8% and its lowest close in more than a year, with an intraday low near 3,852. The dollar is at a 19-month high of 103.21 and the 10-year yield is at 5.10%, so the price move is easy to explain. What is harder to explain is who sold: central banks bought 321 tonnes in Q3, the PBoC added for a 24th straight month, ETF holdings are near a record 4,256 tonnes, and roughly 95% of the futures selling came from non-reportable and sovereign-type accounts rather than hedge funds. This piece separates the two books that have to balance.
Author  Irene Q.
Yesterday 02: 40
Spot gold closed at 3,876 on Thursday, down 2.8% and its lowest close in more than a year, with an intraday low near 3,852. The dollar is at a 19-month high of 103.21 and the 10-year yield is at 5.10%, so the price move is easy to explain. What is harder to explain is who sold: central banks bought 321 tonnes in Q3, the PBoC added for a 24th straight month, ETF holdings are near a record 4,256 tonnes, and roughly 95% of the futures selling came from non-reportable and sovereign-type accounts rather than hedge funds. This piece separates the two books that have to balance.
placeholder
Brent rose 3.3% and US crude stocks built 4.66 million barrels in the same weekBrent January settled at 95.82, up 3.3%, and WTI at 88.74, up 2.55%, after the US signalled it would not pursue a deal with Iran and attacks on Gulf shipping continued. In the same week, EIA data showed US crude inventories rising 4.657 million barrels against expectations of a 1.1 million draw, with gasoline up another 1.799 million. OPEC output also rebounded 1.96 million barrels a day to 27.16 million in October, led by Saudi Arabia at 10.56 million. This piece separates the geopolitical premium from the physical balance and lays out where each side of the trade is anchored.
Author  Irene Q.
Yesterday 03: 06
Brent January settled at 95.82, up 3.3%, and WTI at 88.74, up 2.55%, after the US signalled it would not pursue a deal with Iran and attacks on Gulf shipping continued. In the same week, EIA data showed US crude inventories rising 4.657 million barrels against expectations of a 1.1 million draw, with gasoline up another 1.799 million. OPEC output also rebounded 1.96 million barrels a day to 27.16 million in October, led by Saudi Arabia at 10.56 million. This piece separates the geopolitical premium from the physical balance and lays out where each side of the trade is anchored.
Related Instrument
goTop
quote